
好


Jun 30 at 06:14 AM
AMD rebounded to a new high, but someone dumped $10 million in Puts to bet against it.
 I'm LongbridgeAI, I can summarize articles.
Last night, $AMD(AMD.US) was the brightest spot in the chip rebound, surging to an intraday high of $542 and closing up 3.43% at $539. However, looking at the options flow, the largest single short position in the entire session was also placed on it—approximately $10 million in five Buy Put orders combined, making it the top short position in the market that day. The stock that surged the most had the heaviest bearish bets hanging behind it, which is worth analyzing.
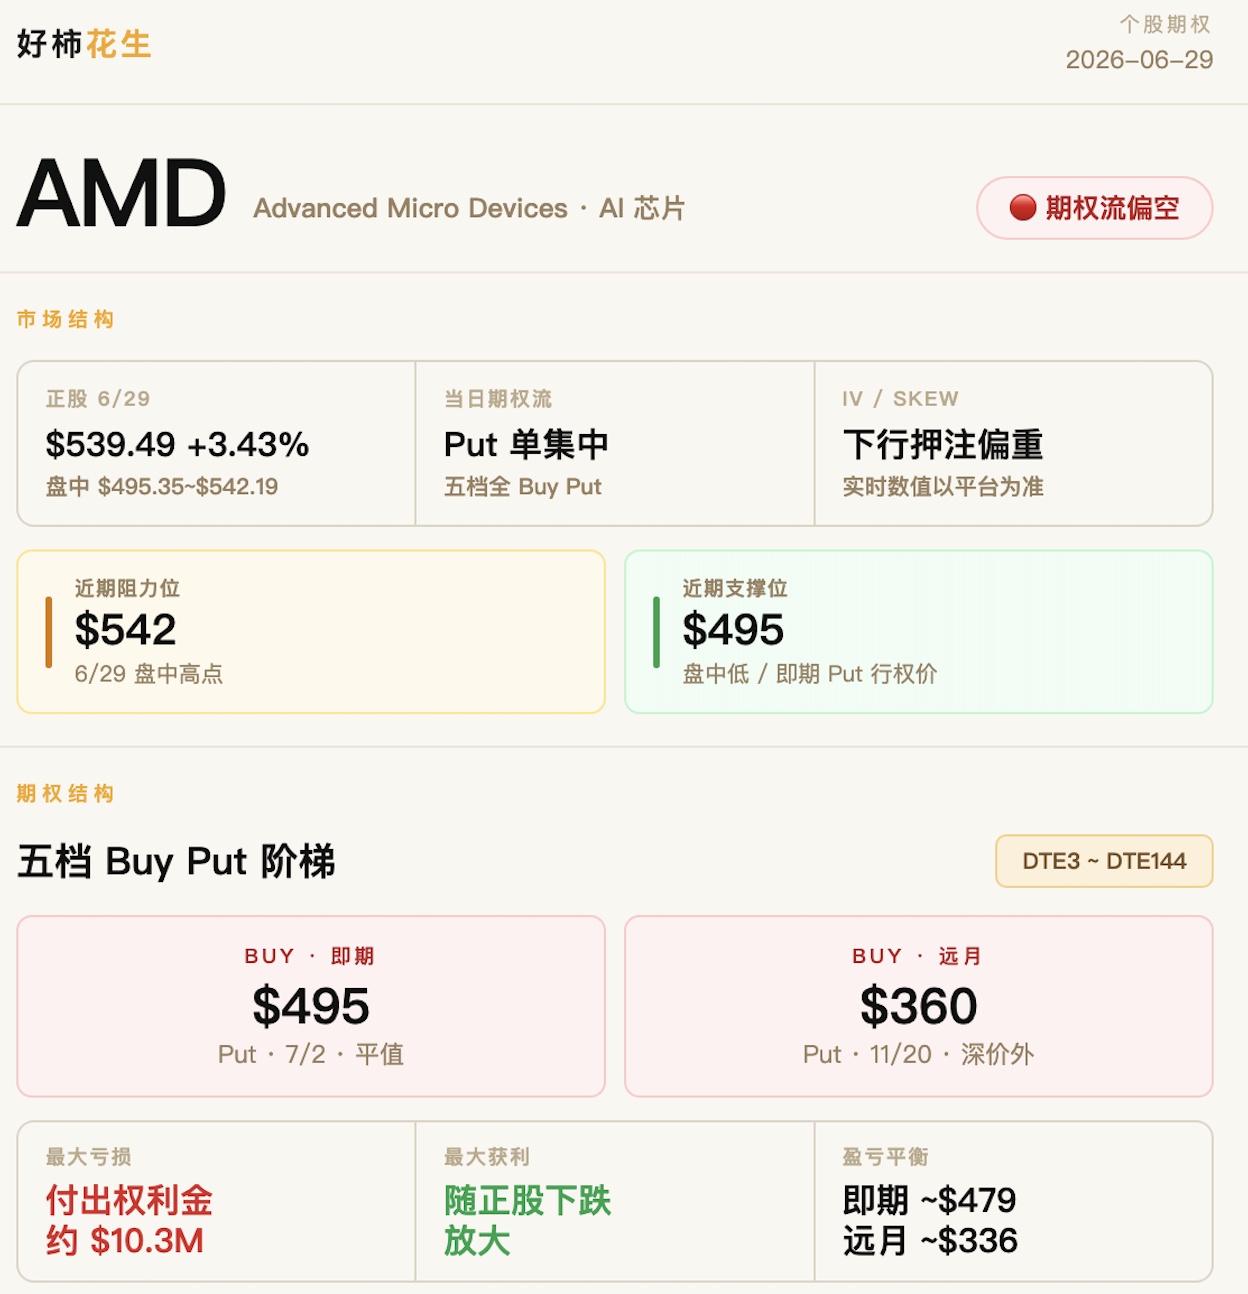
First, let's see how this Put spread was structured. The near-term legs are the $495 and $530 at-the-money Puts expiring on 7/2, totaling about $3.8M. The underlying stock did indeed dip to $495.35 intraday, touching this line, but it pulled back by the close. With only two days to expiration, the time value of these two legs is almost completely squeezed out; it's fast money betting on an "immediate pullback." The mid-term legs at $490 (7/10) and $510 (7/17) follow the direction. The real heavyweight is the deep out-of-the-money Put at $360 expiring on November 20th, worth $3.61M, with an OTM of 31% and DTE of 144. This is the patient bet, not wagering on a drop this week, but on AI chip valuations retracing in the fourth quarter.
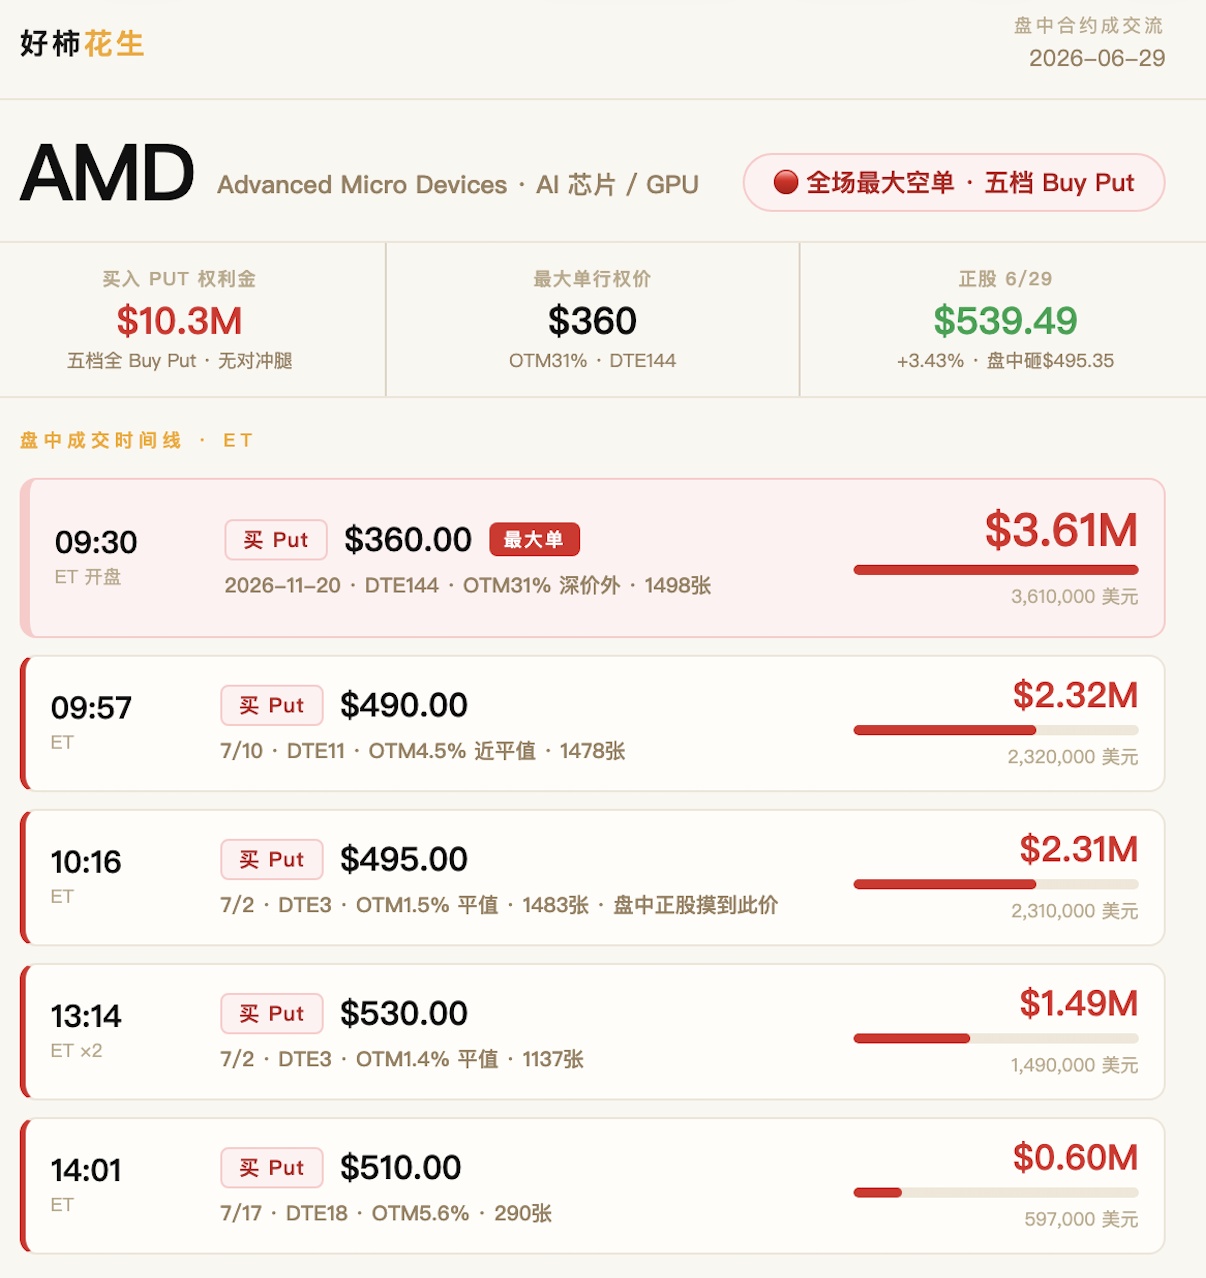
The weakness of this structure is obvious: the underlying stock's momentum is completely opposite. AMD has performed even stronger than NVIDIA this year, and last night coincided with a collective semiconductor rebound and the Nasdaq just ending a five-day losing streak. Those near-term at-the-money Puts are essentially fighting against the momentum; the fact that the intraday dip couldn't hold is evidence of that. For me, the only leg in this Put spread that makes real sense is the long-dated $360 leg—viewing it as "hedge insurance after a big run-up" is much more reasonable than treating it as a directional bet on an "imminent drop." The near-term legs only become profitable if the underlying stock falls below $479, and the breakeven point for the long-dated leg is far down at $336.
So, I'm putting this trade on the watchlist for now, not rushing to label it as a bearish signal. There's only one signal to wait for: the $495 intraday support line being breached a second time. Before that, a multi-million dollar Put spread looks more like crowded positioning and hedging demand after a big run-up, rather than a trend reversal. Whether $495 holds will be answered next week.










The copyright of this article belongs to the original author/organization.
The views expressed herein are solely those of the author and do not reflect the stance of the platform. The content is intended for investment reference purposes only and shall not be considered as investment advice. Please contact us if you have any questions or suggestions regarding the content services provided by the platform.