
Does AI debt signal a turning point for the Nasdaq? European/American 'pregnancy line' questions the rebound
 I'm LongbridgeAI, I can summarize articles.
[Today's FX Market] August 19 Trading Strategy
Title: Will AI Debt Signal a Nasdaq Turning Point? Doubts Raised Over EUR/USD Doji Pattern Amid Rebound
Gold/USD (XAU/USD) – Two Strong Resistance Levels at Play; Watch for Double Top Confirmation
Daily Chart: The 10-year U.S. Treasury yield has hit its highest level since January last year, significantly weighing on precious metals. Spot gold formed a bearish engulfing candle, marking a new closing low since August 7 and weakening the recent bullish momentum. As warned in our column yesterday, resistance from the line connecting the year-to-date high and the technical pressure at May 20’s low of 4450 have materialized. Prices have broken below the psychological integer level of 4400 and the mirror level of May’s low/June 17’s high at 4360, turning both into intraday resistance. Indicators signal strong "momentum stall": the MACD fast line turned downward above the zero axis, showing a tendency to form a death cross with the signal line; RSI has dropped away from overbought territory.
4-Hour Chart: Gold prices have shown significant pullbacks twice recently when approaching the aforementioned 4450 resistance. During the Asian session, prices are gradually nearing last week’s low of 4310, a crucial potential double top neckline. Note that silver is forming a similar pattern and has already confirmed a double top structure. If gold breaks down similarly, downside targets December 31 last year’s low of 4270. Subsequently, July’s high of 4200 marks the upper edge of a previous low triangle; holding this level is the baseline for maintaining the current upward impulse wave. July 22’s high of 4165 also offers some support. Indicators: MACD death cross again, fast line pulling back toward zero; RSI enters weak zone, increasing risk of short-term trend weakness.
Resistance Levels: 4360, 4400, 4450
Support Levels: 4310, 4270, 4200
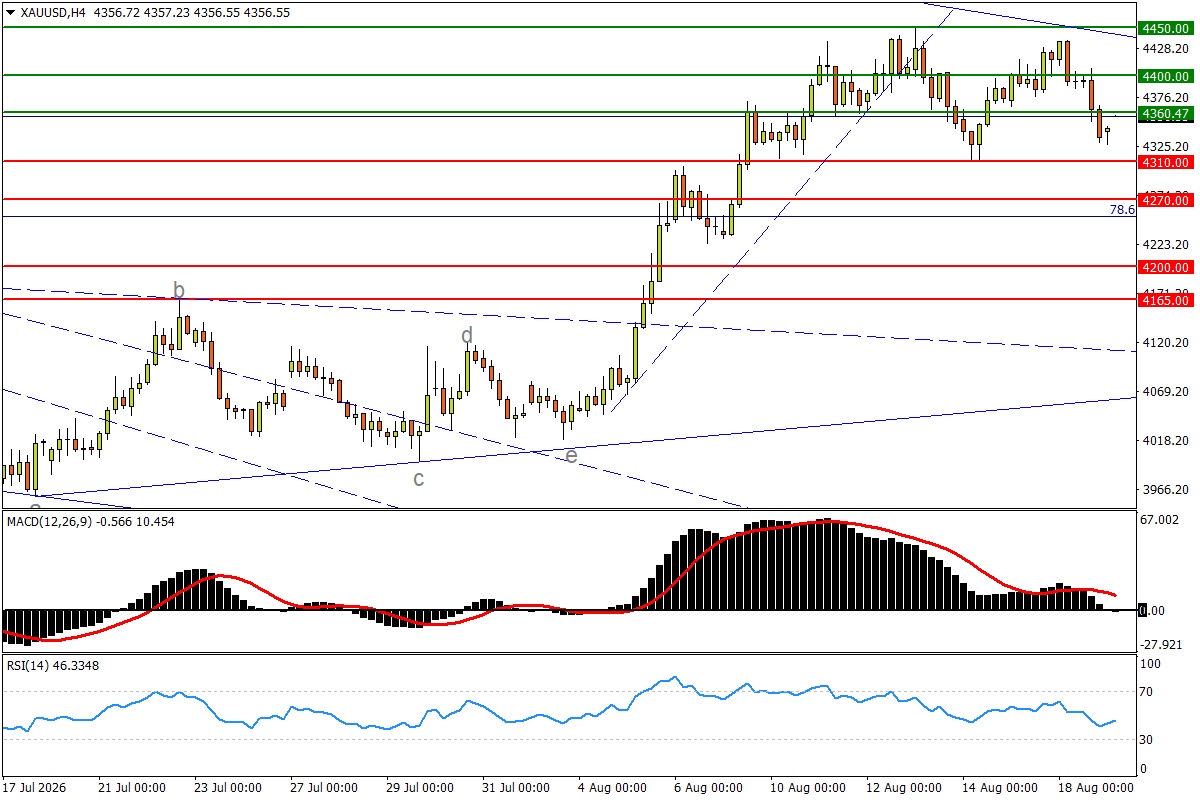
*XAUUSD H4 Source: FXTM
Nasdaq 100 Index (NAS100) – AI Debt Concerns Spark Worries; Potential Turning Point in Secondary High Zone
Daily Chart: Besides soaring Treasury yields, Goldman Sachs’ warning that "AI bond issuance far exceeded expectations" has ignited concerns about sector debt accumulation. A sharp drop in chip and optical communication sectors dragged the Nasdaq 100 to record a bearish engulfing candle below historical highs. The index failed to stay above the 30,000 mark for three consecutive days and appears to be forming lower highs in this swing. This makes the test of the mirror level of July 22’s high/August 6’s low at 29,200 critical; a break below would sharply amplify "turning point" risks. Subsequent support lies around May 19’s low of 28,580 and June’s low near 28,200, which also correspond to the waist of a previous high diamond pattern and the lowest point of the entire formation; another break would fuel fears of a medium-term major top. On the upside, the market aims to reclaim May mid-month high 29,700 to the 30,000 threshold; only after stabilizing there can it challenge the record level of 30,745. Indicators: MACD fast line turns down above zero; RSI pulls back to neutral zone after hitting resistance, posing severe challenges to previous strong momentum.
Resistance Levels: 30000, 30745, 31800
Support Levels: 29000, 28580, 28200
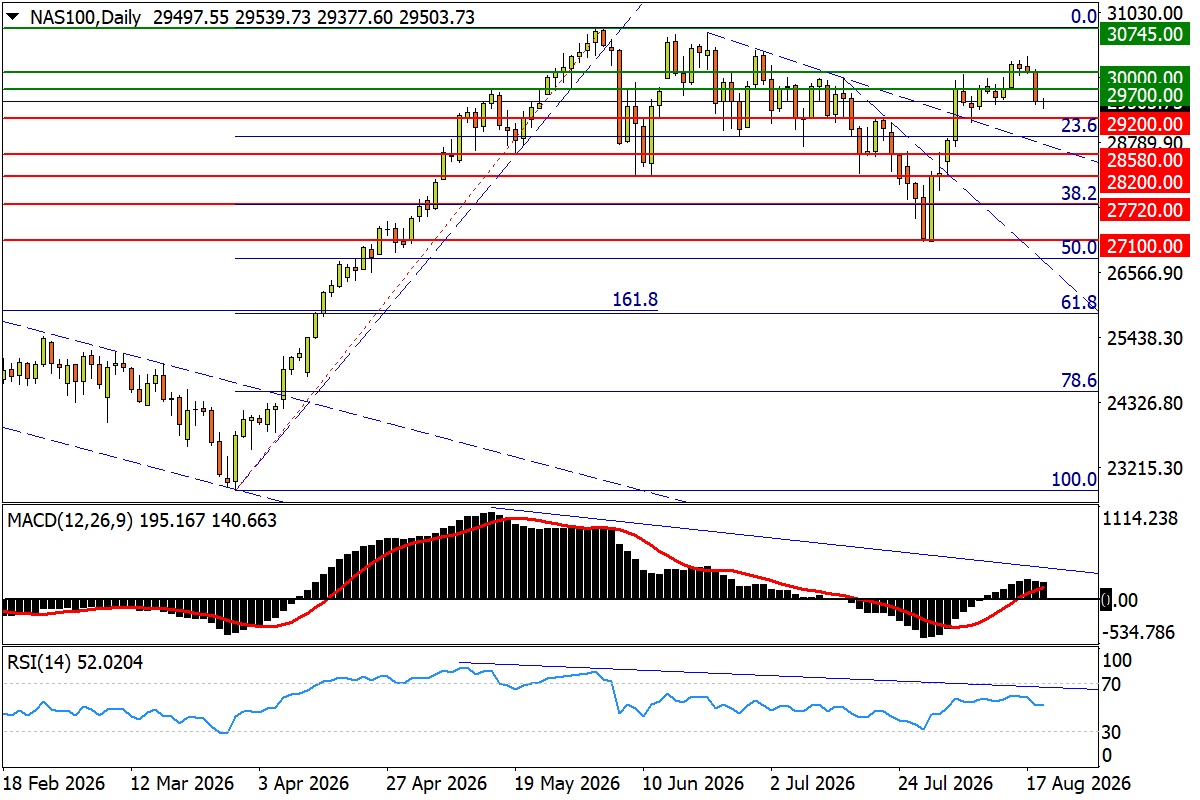
*Nasdaq 100 Daily Chart
Nikkei 225 Index (JP225) – Sharp Drop Below 70,000; Strong "Lower High" Signal
Daily Chart: AI debt panic spreads to global markets, with Japanese chip-related stocks dragging the index down significantly, while Nikkei futures showed weakness overnight. The long black candle overnight abruptly halted this month’s rebound. The position just below the 70,000 threshold also deals a blow to bullish confidence. The current setup marks the second time since the rally from the tariff crisis trough that a downward turning point appears suspected at a secondary swing high (previously resolved by a triangle continuation pattern at year-end). It is urgent to reclaim the lower edge of the June 15 gap fill at 67,375 to temporarily stop the bleeding. Conversely, if the July 8 volatile low of 65,350 fails, it will likely fail to prevent further market slide. Subsequent support watches the mirror level of May 11’s high/May 28’s low at 63,800, and June’s low at 62,300. Indicators: MACD signal line recovers above zero, but fast direction plunges; RSI dips slightly to neutral zone, facing harsh tests for this month’s counterattack.
Resistance Levels: 67375, 68775, 70000
Support Levels: 65350, 63800, 62300
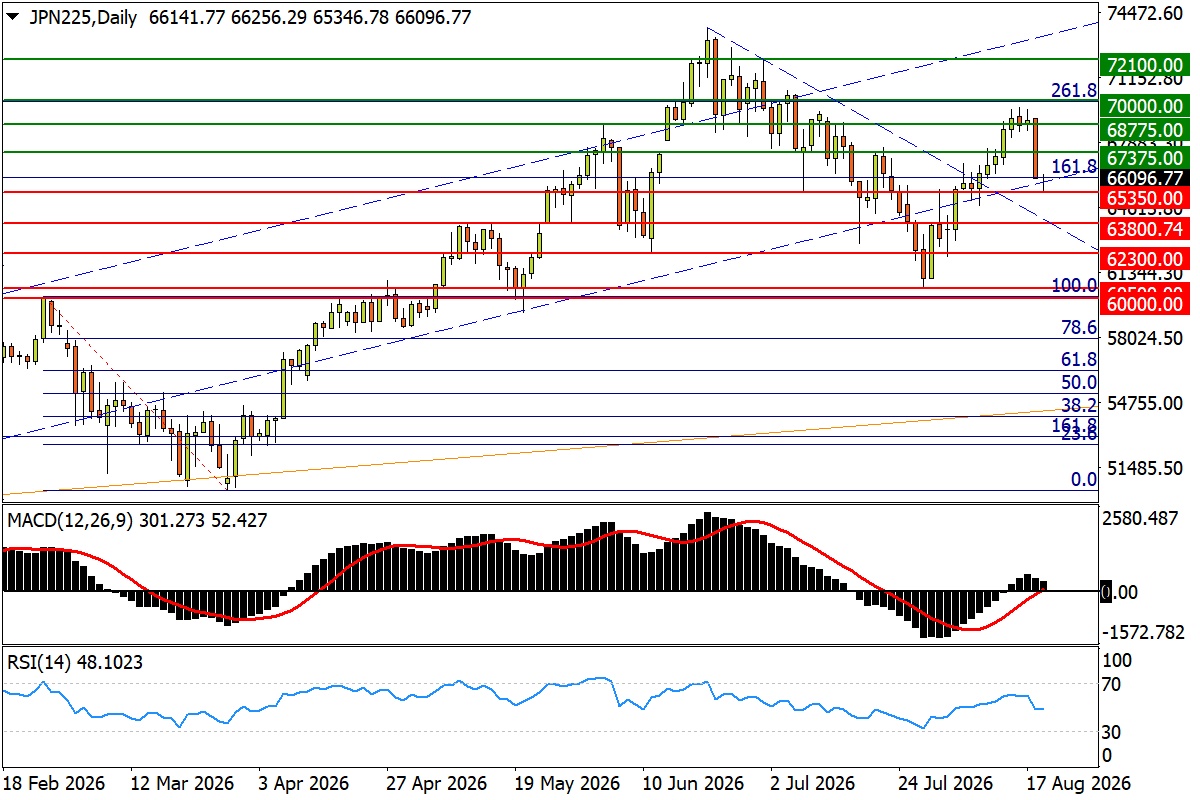
* JP225 D1 Source: FXTM
Euro/USD (EUR/USD) – Doji Forms During Rebound; Focus on Strength of Low Line Connection
Daily Chart: U.S. long-term yields hit pre-2008 crisis highs, slowing non-U.S. currency rebounds recently. EUR/USD formed a small doji below the stage high established early in the week; this doji pattern is typically viewed as signaling a potential trend reversal. Carefully monitor whether the potential uptrend support connecting July’s low and August 13’s low remains intact; holding firm and bouncing up would be a strong signal that EUR/USD successfully retested the Jan/April high line last week and is resuming its rise. Indicators: MACD continues slow rise above zero; RSI flattens below overbought line, bullish momentum gradually slowing.
4-Hour Chart: The short-term swing uptrend for EUR/USD remains intact, but early-week 攻势 failed to surpass June 16’s high of 1.1620, an important prior weekly high. Only a break opens larger recovery space; subsequent resistance references include the Apr-May double top neckline at 1.1655 and May 29’s high at 1.1685. However, if the pair breaks below last October’s mid-month low of 1.1540, upward rhythm will loosen. If June early-month low 1.1500 is breached, the uptrend structure breaks, exposing direct risk of returning to mid-year weakness. Indicators: MACD death cross above zero; RSI hits overbought line and flattens, bulls still relatively dominant in short term.
Resistance Levels: 1.1620, 1.1655, 1.1685
Support Levels: 1.1540, 1.1500, 1.1465
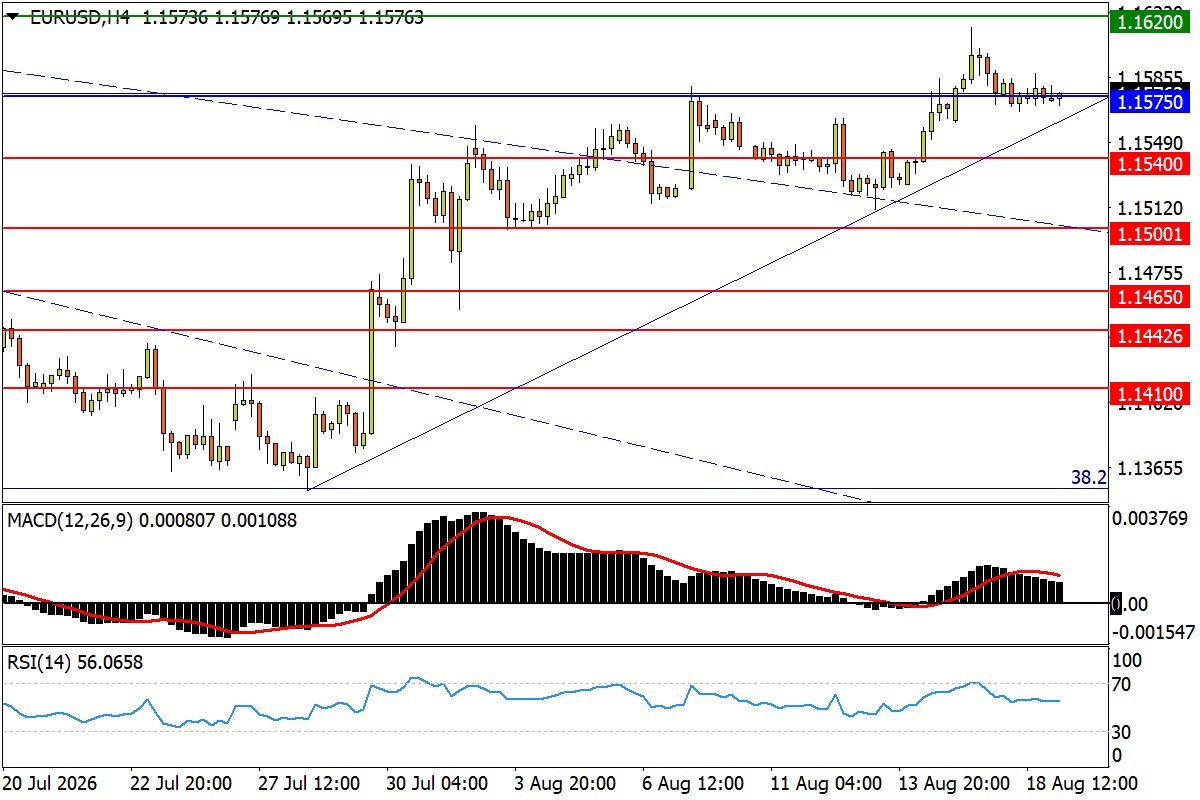
*Euro/USD 4-Hour Chart
Crude Oil – US-Iran Standoff Continues; Is the Doji a Bullish Relay?
Daily Chart: Middle East tensions remain deadlocked with no progress; oil prices refreshed monthly highs early in the week before entering a wait-and-see mode. From a pure technical probability perspective, the small doji overnight is more likely a bullish relay; however, market operation is dominated by supply/demand expectations bound to geopolitical situations. The existence of strong resistance between March 23/June 9 highs of 84.80 and early May lows of 86.70 always adds difficulty to rebound continuation. A break could target the 90 level up to July’s high near 92.00. Indicators: MACD golden cross near zero, awaiting signal line turn up; RSI flattens in strong zone, bulls retain slight advantage.
4-Hour Chart: Oil price volatility was particularly dull overnight; multiple horizontally arranged dojis appear "abrupt" amidst frequent geopolitical storms. However, this phenomenon represents accumulating kinetic energy in the long-short struggle, preparing for the next breakout. Note that MACD has not yet reached above the previous swing high to create divergence environment; RSI also continues to flatten below overbought line. If potential pullback breaks the 81.85 level (38.2% retracement of 20-22 uptrend), consider the possibility of "failed bottom-fishing" this month. Subsequent support watches April’s volatile low of 79.00, and March 10’s volatile valley of 75.85 combined with the important defense line formed by July/August low connections.
Resistance Levels: 84.80, 86.70, 90.00
Support Levels: 81.85, 79.00, 75.85
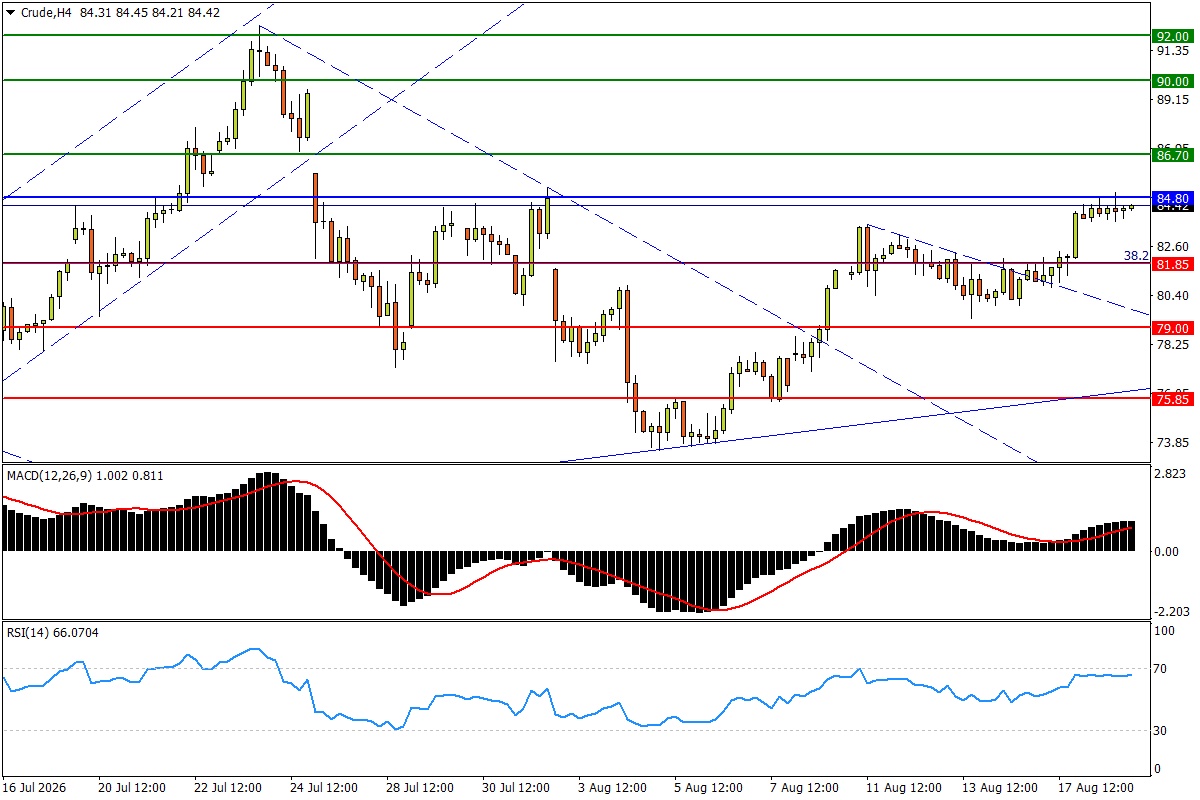
*Crude H4 Source: FXTM







The copyright of this article belongs to the original author/organization.
The views expressed herein are solely those of the author and do not reflect the stance of the platform. The content is intended for investment reference purposes only and shall not be considered as investment advice. Please contact us if you have any questions or suggestions regarding the content services provided by the platform.