
The pound breaks its wave pattern! DAX40 shows a three-crow hanging void
 I'm LongbridgeAI, I can summarize articles.
[Today's FX Market] August 20 Trading Strategy
Title: GBP Breaks Intraday Pattern! DAX40 Shows Three Black Crows in Suspended State
The U.S. Treasury unexpectedly announced a doubling of its long-term bond buyback scale, causing U.S. Treasury yields to fall significantly. Relief from debt concerns stabilized market sentiment, leading to a moderate rebound in U.S. stocks, a sharp surge in gold prices, and the US dollar hitting a three-month low.
Pound Sterling / US Dollar (GBP/USD) – Subverting Yearly Swing Patterns, Divergence at Upper Resistance
On the daily chart, the simultaneous decline in U.S. Treasury yields and the dollar has reactivated the offensive against non-U.S. currencies. The GBP/USD pair has reached its highest point since mid-May. If the price action was still hesitant around the July high of 1.3555 before this move, it is now firmly stepping on the late February highs, completely breaking away from the state of continuous downward movement from the mid-year swing highs. As long as it holds above the April high of 1.3600, it can launch another attack on the overnight high of 1.3630 (mid-June last year's high) and the May high of 1.3655. Technically, the MACD is expanding its advantage above the zero line; the RSI is approaching overbought levels, highlighting the overall strength of the pound.
On the 4-hour chart, the GBP/USD shows signs of escaping the month's upward-sloping consolidation channel. However, the current intraday pullback testing the "upper rail" will create an opportunity to reassess the immediate trend direction: if 1.36 is held, the overnight momentum will continue with full force; but if it falls back inside the original uptrend channel, it will signal exhaustion after the sharp rally. Strong buying support is expected at 1.3555, which serves as the red line maintaining the current upward rhythm. Subsequently, the lower boundary of the recent uptrend and the mirror level of the May 25 high/February 6 low at 1.3510 must not be lost. Technically, both the MACD fast line and RSI show signs of resistance at high levels, suggesting that the overnight upward pulse may temporarily come to an end.
Resistance Levels: 1.3630, 1.3655, 1.3700
Support Levels: 1.3555, 1.3510, 1.3480
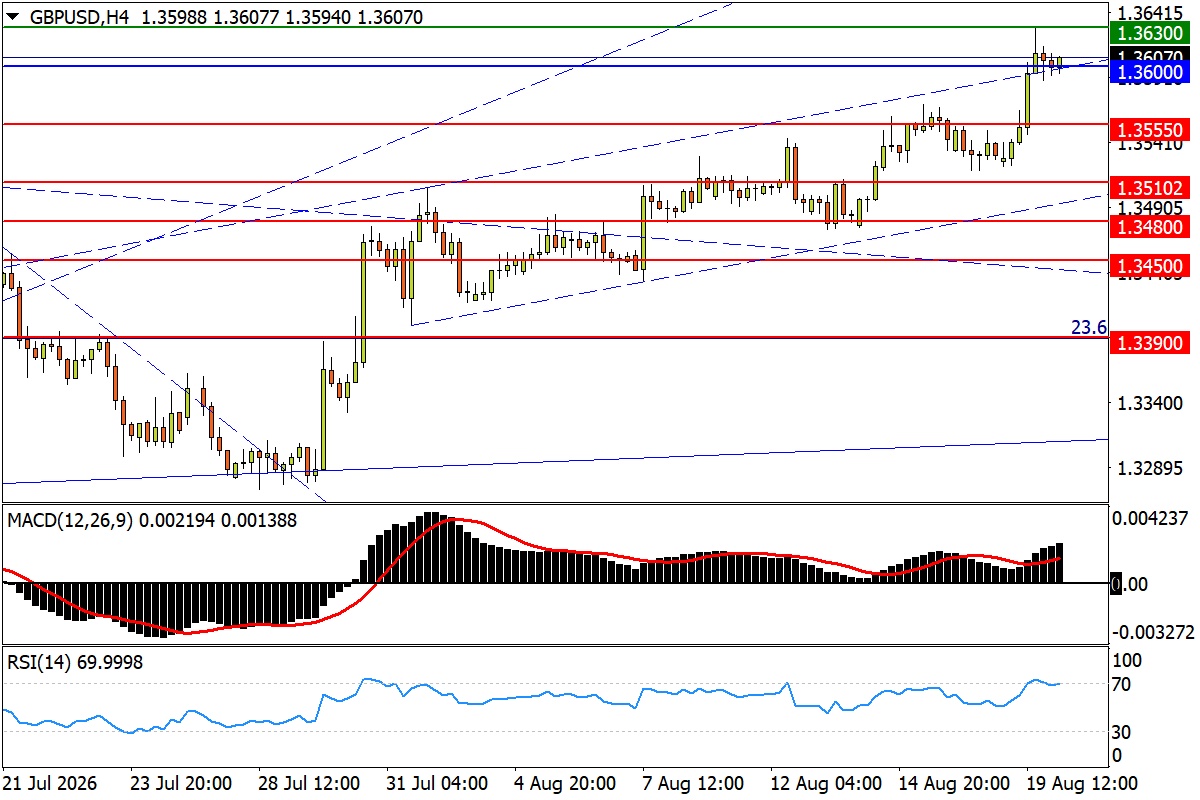
*GBP/USD 4-Hour Chart
US Dollar / Swiss Franc (USD/CHF) – Complex Head-and-Shoulders Breakout Realized, Targeting Yearly Uptrend Bottom
On the daily chart, unlike the strong performance seen in other major currencies breaking out and accelerating higher, the significant drop in USD/CHF overnight changed the recent pattern of slow, gradual gains. We have previously emphasized the technical significance of the lower boundary of the slow-gain channel starting from July 3; following the breakout, the currency pair accelerated its slide. Immediate support can be found at the mid-March high of 0.7960, which was approached early in the session. Subsequently, the mid-term low formed in January, along with the April 30 high of 0.7925 and the May high of 0.7905, will jointly form a key defense network. Technically, the MACD fast line crossed below the zero line; the RSI dropped straight into weak territory, both being clear signals of a trend shifting from strong to weak.
On the 4-hour chart, the USD/CHF made a huge leap overnight, creating the most volatile intraday range since January. The slight retracement during the Asian session brought the price to the neckline of the small double top from November-December last year, around 0.7990-0.80. However, the mirror level of the June 11 high/July low at 0.8010 immediately above is likely to face heavy selling pressure; only a recovery could temporarily curb the bears' momentum. Higher resistance can be referenced at the January/April highs of 0.8040, and the October last year high of 0.8075. Technically, the MACD dives rapidly below the zero line; the RSI probes the oversold zone and bounces slightly. If the latter recovers the oversold line, short-term price action may continue to repair.
Resistance Levels: 0.8010, 0.8040, 0.8075
Support Levels: 0.7960, 0.7925, 0.7905
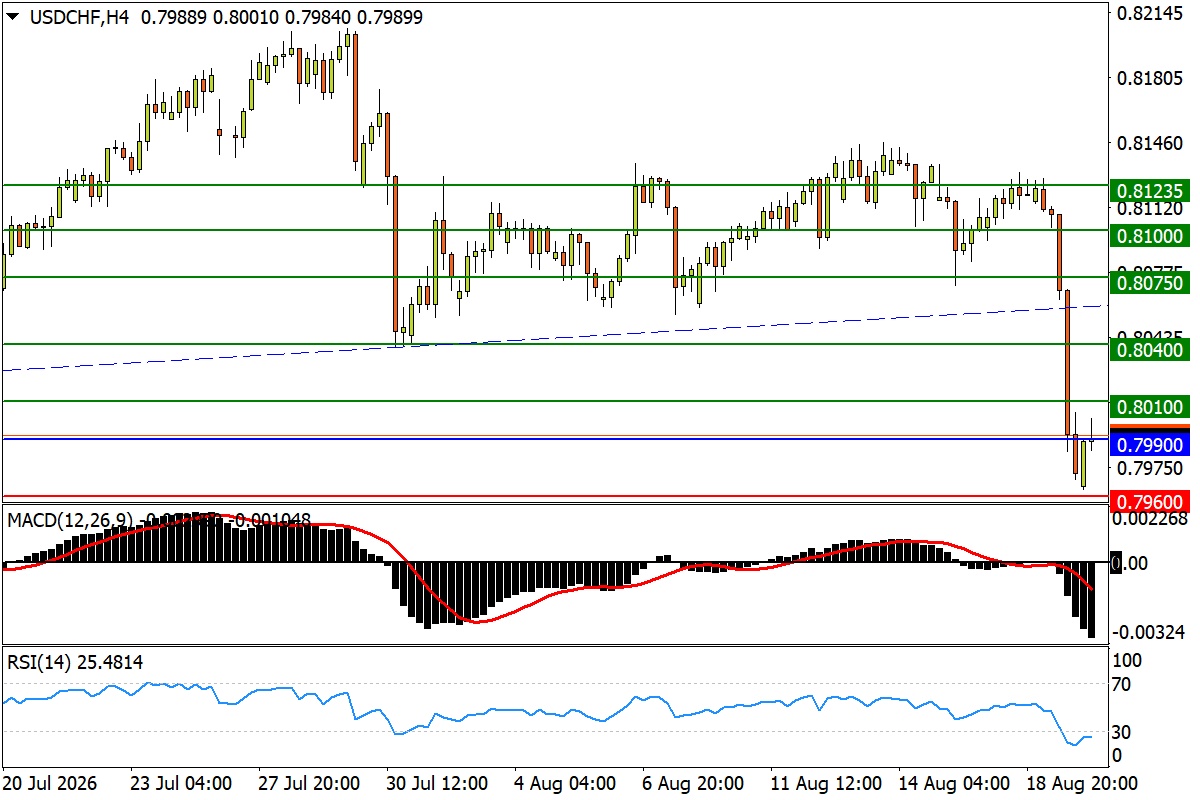
*USD/CHF 4-Hour Chart
Gold / US Dollar (XAU/USD) – Doubling Buybacks Inject New Strength, Double Bottom Midpoint Clears Strong Resistance
On the daily chart, the news of doubled long-term bond buybacks caused both the dollar and U.S. Treasury yields to fall. Gold prices received a massive boost, using this opportunity to sweep away the heavy pressure at the mid-year downtrend peak and last week's highs. After breaking the May 20 low of 4450 and gaining upward inertia, the price is now approaching the 61.8% retracement level of 4540 from the rise to record highs between October last year and present. Subsequently, above the late May rebound high of 4600, the 4650 level gathers the February 6 volatile low and the April arc top neckline, where heavy selling pressure is expected. Technically, the MACD offensive accelerates again above the zero line; the RSI approaches the overbought line again, recording a strong rebound process.
On the 4-hour chart, gold's volatility over the past week has transformed short-term double-top risks into a double-bottom continuation. From a short-term indicator perspective, driven by the rapid price surge, the MACD formed a sharp golden cross above the zero line; however, the RSI touched the overbought line again, meaning the market faces the risk of exceeding limits once more. However, as long as the potential pullback holds the aforementioned 4450 level, the "pullback to the W-bottom neckline" action remains another excellent opportunity for a new rally. Conversely, a break below the subsequent psychological integer level of 4400, and the mirror level of the May low/June 17 high at 4360, is expected to find some buying support. Bulls always have the chance to hold higher swing lows above the latter.
Resistance Levels: 4540, 4600, 4650
Support Levels: 4450, 4400, 4360
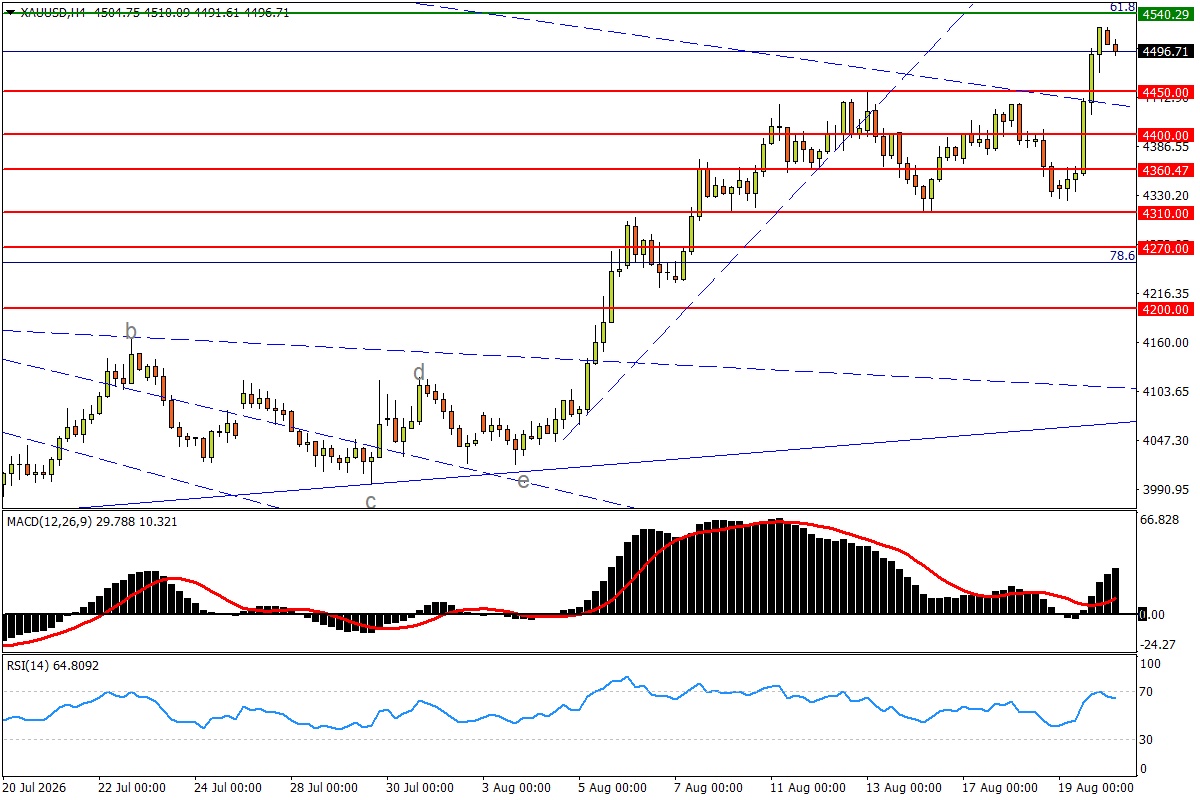
*XAUUSD H4 Source: FXTM
German DAX40 Index (GER40) – Three Black Crows Below Top Edge, Support Focuses on July High
On the daily chart, European stocks did not "appreciate" the news of U.S. Treasury buybacks. The German DAX40 index fell for three consecutive days, gradually detaching from the wide-range oscillation uptrend peak since May. Also note that the Stoxx 50 index, representing broad European blue chips, has broken out into four consecutive bearish candles. The last time such a signal appeared in the market was when the U.S.-Iran conflict first erupted in February. The DAX index seemed to have 磨 off its edge for upward attacks near the top edge; whether it continues to adjust after hitting the wall depends on whether the July high of 25930 below is solid. Subsequent positions close to the January high of 25530 and the February high of 25400 are likely to have strong support. Downward, it will soon face the key defense line built by the May 6 high of 25100 and the lower boundary of the uptrend. Conversely, for the trend to reverse, it needs to recover the inverse 1.618x mapped level of 26350 from last year's tariff shock decline, while the uptrend top edge will still exert deterrence in the record high region. Oscillators release warnings of 受阻 momentum: MACD death cross at high levels; RSI gradually falling away from the overbought line.
Resistance Levels: 26350, 26600, 27000
Support Levels: 25930, 25400, 25100
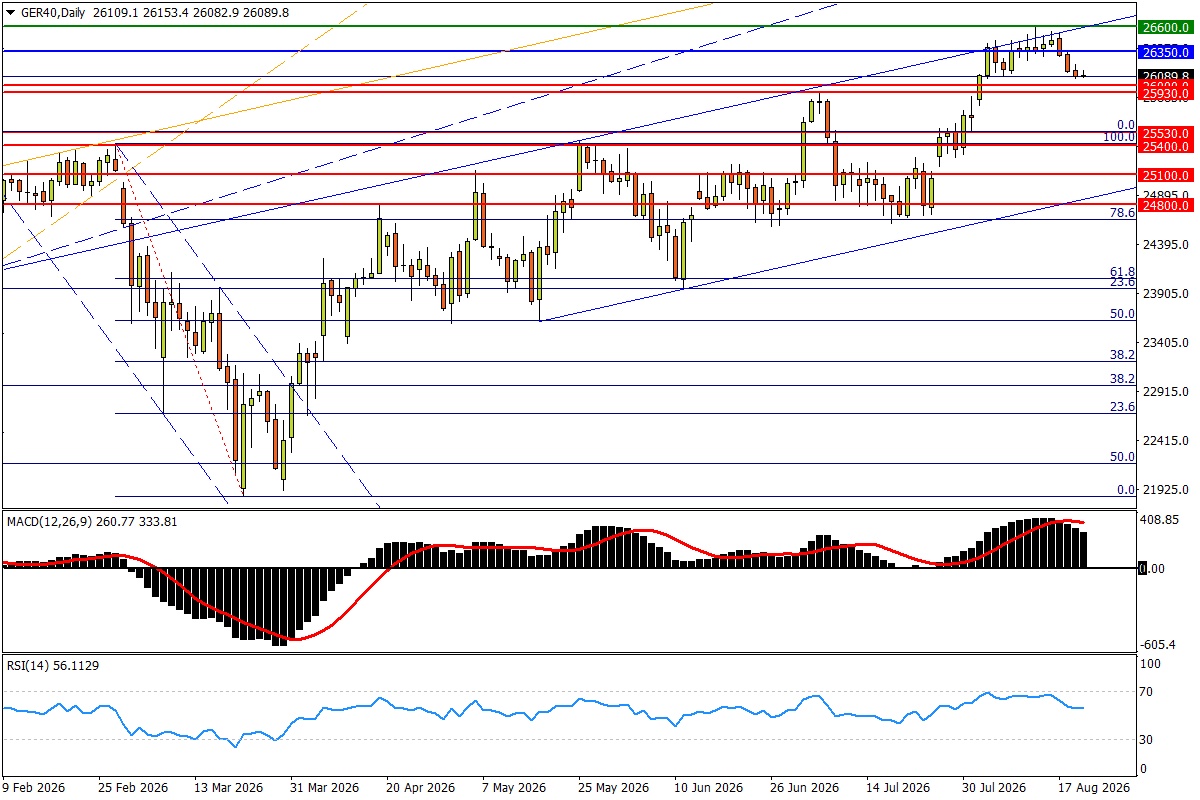
*GER40 Daily Source: FXTM
Crude Oil (Crude) – Sanction Threats Provide Support, Game Focuses on Potential Neckline
On the daily chart, Trump hinted that major sanctions against Iran might be imposed this week, with oil prices continuing to hold onto recent rebound highs. Crude oil closed with a second doji candle overnight, with intraday volatility slightly wider than the previous day. The market is still building momentum to 冲击 the strong resistance zone between the March 23/June 9 highs of 84.80 and the early May lows of 86.70. Given the formation of higher swing lows earlier this month, the method by which bulls attack the former and the 90 level - the pre-July high of 92.00 - will be the key basis for judging whether the trend can emerge from the main wave 3 rally after the July start. Technically, the MACD flattened out after a golden cross near the zero line; the RSI also moved horizontally in the strong zone, indicating relatively hesitant bullish momentum.
On the 4-hour chart, oil prices are no longer "weaving straight lines" like dead water as they were the previous day, but facing the potential head-and-shoulders neckline since July 27 (i.e., around 84.80), the direction remains unclear for now. On the downside, given the constant "chasing" of the two bottom-line connections this month, if crude oil fails to continue its counterattack rhythm and even breaks back below 81.85 (the 38.2% retracement level of the 2020-2022 uptrend), then the foundation of the current rebound will surely loosen. Subsequent support focuses on the April volatile low of 79.00. Technically, the MACD forms a flat death cross above the zero line, failing to surpass the previous swing high; the RSI drops slightly away from the overbought line, revealing signs of insufficient momentum.
Resistance Levels: 84.80, 86.70, 90.00
Support Levels: 81.85, 79.00, 75.85
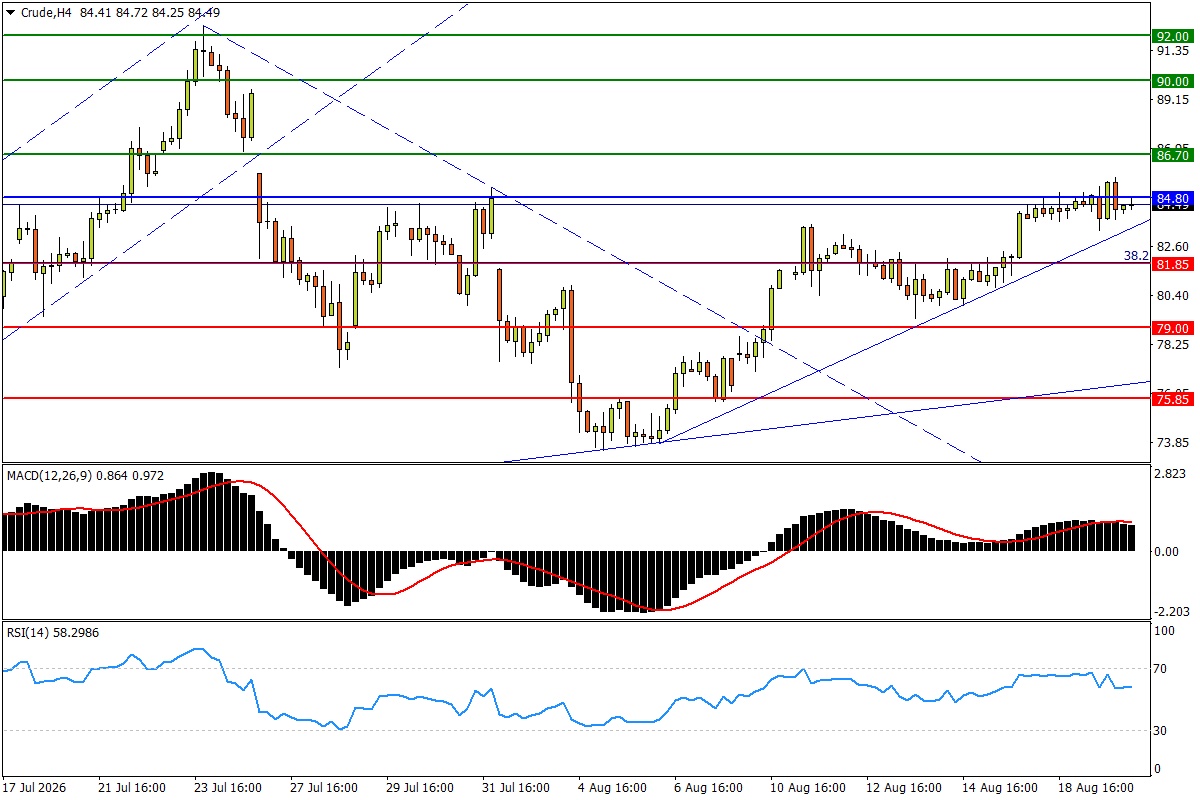
*Crude H4 Source: FXTM


The copyright of this article belongs to the original author/organization.
The views expressed herein are solely those of the author and do not reflect the stance of the platform. The content is intended for investment reference purposes only and shall not be considered as investment advice. Please contact us if you have any questions or suggestions regarding the content services provided by the platform.