Balance Sheet Analysis: A Comprehensive Guide to Assessing Corporate Financial Health
Learn to assess a company's financial health through balance sheet analysis, master key concepts of assets, liabilities, and equity, and use critical financial ratios to spot investment opportunities and risks.
Have you ever wondered how to evaluate a company's financial health when investing in stocks? Beyond tracking fluctuations in share prices, professional investors carefully analyze a company’s financial statements—and the balance sheet is one of the most critical documents. The balance sheet offers a clear picture of a company’s assets, liabilities, and shareholders’ equity at a specific point in time, providing a “snapshot” of its financial position. By learning to read and analyze a balance sheet, you can more accurately assess a company’s financial strength, risk level, and investment potential.
What Is a Balance Sheet?
The balance sheet is one of the three primary financial statements, used to show a company’s financial condition on a particular date. Unlike the income statement (profit and loss statement), which records performance over a period, the balance sheet shows a “snapshot” of the company at a moment in time—hence it's called a static report.
A balance sheet consists of three core elements: assets, liabilities, and shareholders’ equity. Assets illustrate where the company’s money has been invested, such as on equipment, inventory, or property; liabilities and shareholders’ equity show the sources of those funds, including bank loans, payables, or capital invested by shareholders. This statement enables investors to quickly grasp what resources a company owns, how much it owes, and the value actually owned by its shareholders.
The Balance Sheet Equation
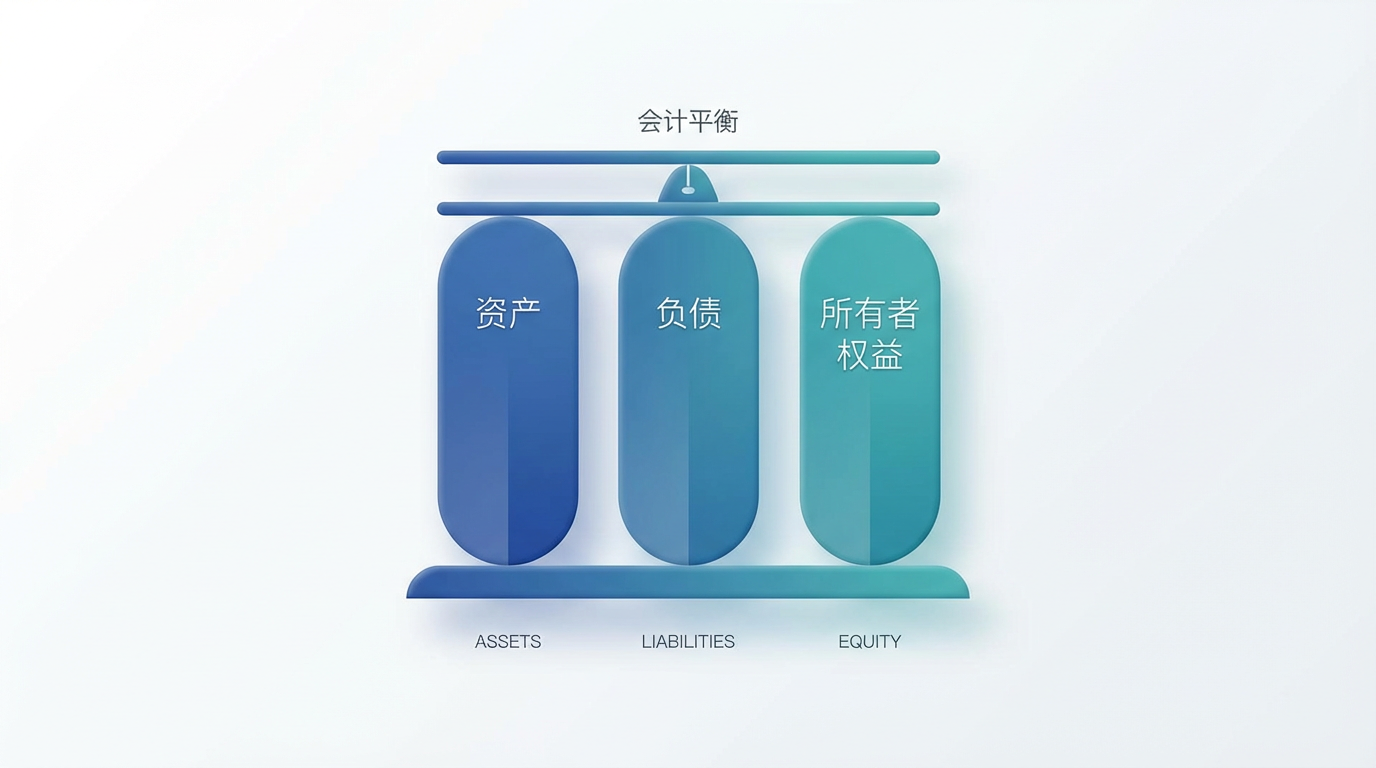
The balance sheet, also known as the Statement of Financial Position, is constructed upon a fundamental accounting equation:
Assets = Liabilities + Shareholders’ Equity
All company assets arise from two sources: borrowed funds (liabilities) or owners’ investments (shareholders’ equity). For example, if you start a coffee shop and contribute $500,000 of your own capital, then borrow another $300,000 from a bank—for a total of $800,000 spent on equipment and renovations—the balance sheet will list your assets (equipment and renovations) as $800,000, liabilities (bank loans) as $300,000, and shareholders’ equity (your invested capital) as $500,000. Both sides of the equation are balanced.
From an investment perspective, shareholders’ equity is also known as “book value” or “net asset value,” representing the value of assets that truly belong to shareholders after all liabilities have been settled. The higher the shareholders’ equity, the greater the company’s self-owned capital and its resilience to risk.
The Three Main Components of the Balance Sheet
Assets: Resources Owned by the Company
Assets are economic resources that a company owns or controls, capable of generating future economic benefit. Assets are categorized by liquidity into current and non-current assets.
Current assets are assets expected to be converted to cash within a year or an operating cycle, including:
- Cash and cash equivalents: bank deposits, short-term notes, and other highly liquid funds
- Accounts receivable: money owed by customers, typically collectible within months
- Inventory: raw materials, work-in-progress, and finished goods awaiting sale
- Short-term investments: financial assets that can be realized within a year
Non-current assets are long-term assets with a useful life longer than a year or an operating cycle, including:
- Fixed assets: tangible assets like land, buildings, machinery, and equipment
- Intangible assets: non-physical assets such as patents, trademarks, and goodwill
- Long-term investments: equity or bond investments expected to be held for more than a year
Liabilities: The Company’s Debts
Liabilities are the company’s obligations to external parties—debts that must be settled in the future. Like assets, liabilities are split into current and non-current portions.
Current liabilities are short-term debts due within a year or an operating cycle, including:
- Accounts payable: money owed to suppliers
- Short-term loans: bank loans due within one year
- Accrued payroll: wages and bonuses owed to employees
- Taxes payable: taxes accrued but not yet paid
Non-current liabilities are long-term debts due after one year or operating cycle, including:
- Long-term borrowings: bank loans or corporate bonds with longer maturities
- Long-term payables: unpaid installments on asset purchases
- Deferred tax liabilities: taxes to be paid in the future
Shareholders’ Equity: The Actual Value Owned by Shareholders
Shareholders’ equity represents shareholders’ claims on the net assets of the business, calculated as assets minus liabilities. Main components include:
- Share capital: capital invested by shareholders
- Capital reserves: share premium from issuing shares at a price above par
- Retained earnings: accumulated, undistributed profits retained over the years
- Other comprehensive income: unrecognized gains or losses, e.g. from foreign exchange changes
Retained earnings are key for assessing long-term profitability. Consistently growing retained earnings signal ongoing profitability and reinvestment; negative or declining retained earnings could reflect prolonged losses or overly generous dividends.
How to Read a Balance Sheet
When analyzing a balance sheet, investors should pay close attention to several aspects:
Understand Asset Allocation
Look at where the bulk of a company’s assets lie. Tech firms may have more intangibles and cash, while manufacturers hold more fixed assets and inventory. Asset allocation reveals the company’s business profile and operating model.
Examine Liquidity
Compare the scale of current assets versus current liabilities. Current assets should at least cover current liabilities, ensuring the company’s ability to meet short-term obligations. If current assets fall well short of current liabilities, there could be a looming liquidity crisis.
Evaluate the Debt Level
Debt itself isn’t always bad—modest leverage can boost capital efficiency. But high debt ratios mean greater financial risk. Compare liabilities to assets or shareholders’ equity to see if the leverage is within reasonable bounds.
Track Trends
A balance sheet for a single period offers limited insight. Compare figures across multiple periods to spot trends. For example, a sharp increase in accounts receivable could suggest collection problems, while ballooning inventory might indicate weak sales performance.
Using Key Financial Ratios for Analysis
While the balance sheet provides plentiful data, it’s hard to judge quality by absolute numbers alone. Calculating key financial ratios enables a more accurate assessment of financial health. Data analysis tools from Longbridge can help you compute and compare these ratios quickly.
Current Ratio
Current Ratio = Current Assets ÷ Current Liabilities
The current ratio measures a company’s short-term solvency—its ability to cover liabilities due within a year using current assets. Generally, a ratio above 1 is recommended. Standards vary by industry: retail may have lower ratios due to fast inventory turnover, while manufacturing needs higher ratios due to longer cycles.
A current ratio below 1 means current assets may not cover short-term debts, risking cash flow problems. But a very high ratio may also be inefficient, signaling idle cash not used for investment or expansion.
Quick Ratio
Quick Ratio = (Current Assets – Inventory) ÷ Current Liabilities
The quick ratio, or “acid-test” ratio, is a stricter liquidity indicator. Since inventory is relatively illiquid, it is subtracted—leaving only highly liquid assets like cash and receivables. A ratio above 0.8–1 is usually sufficient—meaning the company can repay short-term debt even without selling inventory.
Retail and manufacturing often have a lower quick ratio, which is normal. But if the quick ratio is persistently low or deteriorating, this is a warning of rising short-term risk.
Debt Ratio
Debt Ratio = Total Liabilities ÷ Total Assets
The debt ratio reflects the proportion of assets financed by debt—the higher it is, the greater the leverage and risk. Usually, a ratio below 50–60% is advisable, but norms differ by industry. Utilities or real estate firms often have higher ratios; tech and service firms lower.
High debt ratios mean heavier debt servicing pressure when business slows and more profit eroded by interest. Moderate debt can boost shareholder returns via leverage, but always consider industry traits and development stage.
Equity Ratio
Equity Ratio = Shareholders’ Equity ÷ Total Assets
The equity ratio complements the debt ratio, indicating how much of a company’s assets is funded by shareholders’ funds. A higher ratio means stronger capital buffers and better risk resilience. Ideally, it should exceed 40–50%.
Growing companies may have lower equity ratios as they borrow more for expansion. Mature, stable firms tend to have higher equity. Compare peers in the same industry to judge whether a company’s capital structure is healthy.
Asset Turnover Ratio
Asset Turnover Ratio = Revenue ÷ Average Total Assets
Asset turnover gauges how efficiently a company uses its assets to generate revenue. The higher, the more efficiently assets generate sales. Industry standards vary—turnover is high for retail, much lower for heavy industry. Compare within the same sector and monitor shifts over time.
Declining turnover may mean falling operational efficiency, idle assets, or surplus capacity. Rising turnover signals improved asset utilization—a positive sign.
Identifying Red Flags in the Balance Sheet
Besides calculating ratios, investors should watch for abnormal patterns in the balance sheet—these can be early warning signals of financial trouble.
Abnormal Growth in Accounts Receivable
When accounts receivable grow far faster than revenue, potential issues include:
- Declining customer credit quality and rising bad-debt risk
- Looser credit policies to inflate sales figures
- Some revenues may be fake or questionable
Track changes in days sales outstanding—a persistent rise suggests declining collection efficiency and potential cash flow issues.
Large Inventory Build-Up
A sudden surge in inventory may stem from:
- Unsold products accumulating
- Anticipation of raw material price hikes prompting early purchasing
- Inventory stockpiled for future sales during expansion
Review the income statement’s gross margin and revenue to judge if inventory growth is normal or a sign of sales weakness. Falling inventory turnover is generally a red flag—it may require writedowns or scrapping, hurting future profits.
Goodwill Impairment Risk
Goodwill arises when a company pays more to acquire another business than the fair value of its net identifiable assets. Excessive goodwill itself is not an issue, but if the acquired unit underperforms, goodwill impairment can deal a significant blow to reported profits.
Monitor what proportion of total assets is goodwill. High goodwill means that if impairment occurs, the profit hit will be sizable. Regularly review management discussion on goodwill to assess potential risk.
Short-Term Funding Used for Long-Term Assets
If a company funds long-term investments or fixed asset purchases mainly with short-term borrowings, this “mismatch” creates liquidity risks. If short-term loans can't be rolled over, funding shortfalls may arise.
Ideally, long-term assets should be financed with long-term debt, and short-term assets with short-term debt—matching funding source to use. Monitor the ratio of current liabilities to non-current assets to check for risk of maturity mismatch.
How to Find Public Companies’ Balance Sheets
Companies listed in Hong Kong and the US are required to disclose financial statements regularly. Investors have several ways to access balance sheets.
Company Official Websites
Most listed companies post annual, interim, and quarterly reports in the investor relations section of their websites—all of which feature complete balance sheets. Annual reports generally offer the deepest disclosure and management insights, making them a key resource.
Stock Exchange Websites
Hong Kong Exchanges and Clearing’s “HKEXnews” platform provides financial reports for all HK-listed firms, while the US SEC’s EDGAR system covers all public filings for US-listed companies. These official platforms ensure accuracy and timeliness.
Financial Data Platforms
Many financial websites and investment platforms aggregate financial data, making it easy to search and compare. Longbridge, for example, compiles both Hong Kong and US stock information, so you can view company statements and key indicators without visiting each company or exchange website individually.
Investment Research Reports
Brokerage and research firms also issue investment reports that include expert analysis of company balance sheets, often with industry comparisons. These can help you quickly pinpoint the key financial strengths and competitive positioning.
Practical Applications of Balance Sheet Analysis
Once you master reading and analyzing the balance sheet, you can use these skills in practical investment scenarios.
Value Investing Screening
Value investors care deeply about intrinsic value, and the balance sheet is essential for measuring it. Analyzing shareholders’ equity and asset quality allows investors to calculate book value and compare it to market value, identifying potentially undervalued stocks. Higher equity ratios and lower price-to-book ratios may indicate attractive candidates for closer analysis.
Financial Risk Assessment
Assessing a company’s financial risk before investing helps you avoid those with weak fundamentals. High debt ratios, low current ratios, and mismatched funding all raise red flags. Especially in economic downturns or rising interest rate environments, highly leveraged companies face more pressure and volatile stock prices.
Industry Peer Comparison
Balance sheets look very different across industries. Banks’ assets are mostly loans and liabilities mostly deposits; real estate firms hold large inventories of land and property, with generally higher debt ratios; tech firms have more cash and intangibles and less debt. By comparing peer companies’ balance sheets, you can spot the strongest players in a sector.
Monitoring Changes in Financial Health
Regularly reviewing the balance sheets of stocks in your portfolio lets you spot early signs of deterioration. If you see current ratios dropping, debt ratios rising, or abnormally high accounts receivable or inventory, take a closer look and consider adjusting your holdings.
Frequently Asked Questions
What’s the difference between a balance sheet and an income statement?
The balance sheet reflects a company’s financial position at a specific point in time (a static snapshot), while the income statement records performance over a period (a dynamic picture)—showing revenue, expenses, and profit. They complement each other: the balance sheet shows what the company owns and owes, while the income statement shows how it earns or loses money. Analyzing both gives a full view of financial health.
What does negative shareholders’ equity mean?
Negative shareholders’ equity means total liabilities exceed total assets, so the company is insolvent. This usually results from years of losses wiping out capital and reserves, turning retained earnings deeply negative. Negative equity is a serious warning of financial crisis and presents a bankruptcy risk.
What is goodwill, and why does it appear on the balance sheet?
Goodwill arises when a company acquires another and pays more than the fair value of its net identifiable assets, reflecting intangible value such as brand, customer relationships, and team expertise. Goodwill appears on the acquirer’s balance sheet as an intangible asset. If the acquired business underperforms, a goodwill impairment must be recognized, reducing profits. Investors should monitor the proportion of goodwill to total assets as an indicator of potential impairment risk.
How can you judge if a company’s debt ratio is reasonable?
The “reasonable” debt ratio varies by industry. Typically, a ratio below 50–60% is acceptable, but capital-intensive sectors like utilities or telecom may run up to 70%, while tech and service industries may be just 20–30%. Compare with industry peers, and watch trends; if a company’s debt ratio keeps rising above its sector average, that’s a sign of increased financial risk.
Is a higher current ratio always better?
While a current ratio above 1 signals short-term solvency, higher isn’t always better. An excessively high ratio may mean too much idle cash or inventory and inefficient capital use. Ideally, aim for a ratio between 1.5 and 2—enough to cover short-term debts without wasting resources. Industry norms differ, so assess in context with industry and company business cycle.
Where should beginner investors start with financial analysis?
Start by understanding the basic structure of financial statements—the balance sheet, income statement, and cash flow statement—and master their core concepts. Select a few companies from familiar industries, read their reports regularly, and practice calculating key ratios. With hands-on practice, you’ll develop financial analysis intuition. Additionally, read classic investment books or join online courses for structured learning.
Conclusion
The balance sheet is a core tool for evaluating a company’s financial status. By analyzing its three fundamental elements—assets, liabilities, and shareholders’ equity—investors can fully understand a company’s financial strength, capital structure, and potential risks. Mastering how to calculate and interpret key indicators like the current ratio and debt ratio helps you identify financially sound companies and avoid high-risk traps.
Financial analysis is not a one-off task, but a process of continuous tracking and comparison. Review the balance sheets of your holdings regularly, and watch for red flags like spike in receivables or ballooning debt ratios—this helps you detect issues early and adjust your strategy. By combining income statement and balance sheet analysis, you’ll build a more complete framework for evaluating financial health.
Before making investment decisions, be sure to fully understand how each investment tool works, their risk characteristics, and trading rules, and develop a robust risk management plan. For more investment education, you can visit Longbridge Academy or download the Longbridge App.