Technical Indicators for Options Entries & Exits
Master essential technical indicators like RSI, MACD, and Bollinger Bands to identify precise entry and exit points for options trading with improved timing and accuracy.
TL;DR: Technical indicators help options traders identify optimal entry and exit points by analyzing price momentum, volatility, and market trends. Key indicators include Relative Strength Index (RSI) for timing reversals, Moving Average Convergence Divergence (MACD) for trend confirmation, and Bollinger Bands for volatility assessment. Combining multiple indicators improves accuracy and reduces false signals.
Options trading requires careful timing and careful analysis of market conditions. While fundamental analysis helps evaluate long-term potential, technical indicators for options provide the real-time insights traders need to make informed entry and exit decisions. Whether you are trading US options through platforms offering market access, understanding these analytical tools can significantly improve your trading outcomes.
Technical indicators transform raw price data into actionable signals, helping traders identify trends, measure momentum, and assess volatility. For options traders specifically, these tools become even more valuable because options contracts have expiration dates, making timing highly important.
Understanding Technical Indicators for Options Trading
Technical indicators are mathematical calculations based on historical price, volume, or open interest data. Unlike stock trading where you can hold positions indefinitely, options trading demands precise timing because contracts lose value as expiration approaches through time decay (theta).
Technical indicators fall into four main categories: momentum indicators measure the speed of price movements, trend indicators reveal market direction, volatility indicators assess price fluctuation rates (directly impacting option premiums), and volume indicators confirm the strength behind price movements.
Essential Technical Indicators for Options Entries
Knowing when to enter an options trade separates successful traders from those who struggle. These indicators provide technical signals for identifying optimal entry points.
Relative Strength Index (RSI)
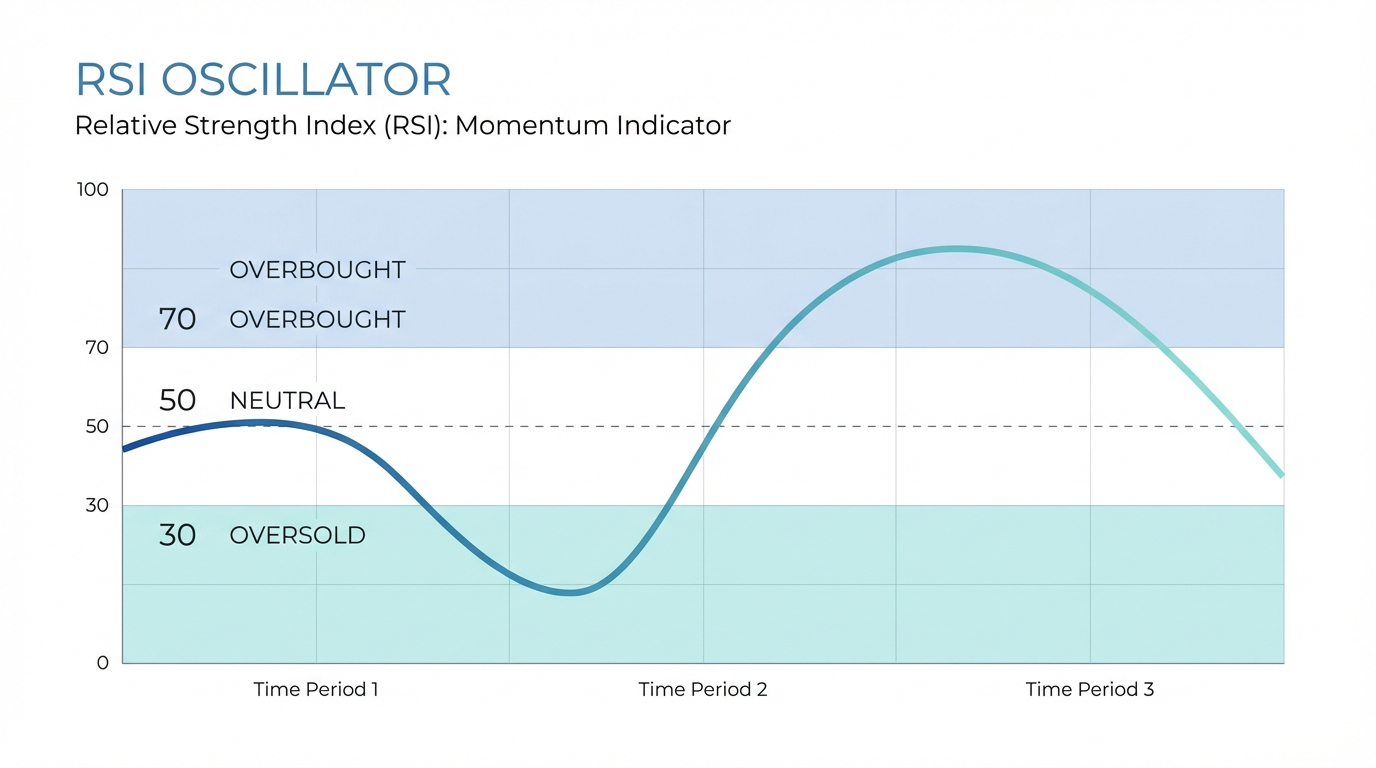
The Relative Strength Index is a popular momentum oscillator among options traders. RSI measures the magnitude of recent price changes on a scale from 0 to 100, helping identify overbought and oversold conditions.
RSI readings above 70 typically indicate overbought conditions, suggesting the asset may be due for a pullback. Traders often view this environment as a potential setup for selling call options or buying put options.Conversely, RSI below 30 signals oversold conditions, which some traders interpret as a signal to consider selling put options or buying call options.
For options traders, RSI divergences provide even more valuable signals. When price makes new highs but RSI fails to confirm (bearish divergence), or when price makes new lows while RSI trends higher (bullish divergence), potential reversals become more likely.
Moving Average Convergence Divergence (MACD)
MACD combines trend-following and momentum characteristics into one versatile indicator. It consists of two moving averages and a histogram that displays the difference between them.
When the MACD line crosses above the signal line, it generates a bullish signal which may signal positive momentum. When the MACD line crosses below the signal line, bearish signals suggest put option opportunities.
The histogram provides additional context. Growing histogram bars indicate strengthening momentum, while shrinking bars suggest momentum is fading. Options traders often wait for histogram confirmation before entering trades.
Bollinger Bands
Bollinger Bands consist of a middle band (simple moving average) with upper and lower bands set two standard deviations away. These bands expand during volatile periods and contract during quiet markets.
Price action near the bands provides valuable entry signals. When price touches or breaks below the lower band in an uptrend, it is often monitored by traders for potential reversals.Similarly, price reaching the upper band in a downtrend may signal put option entries.
The "Bollinger Squeeze" occurs when bands contract to historically narrow levels, indicating low volatility. This pattern often precedes significant price moves, creating opportunities for straddle or strangle strategies where traders aim to capitalize on increased volatility regardless of direction.
Critical Indicators for Options Exit Timing
Knowing when to exit an options trade preserves gains and limits losses. These indicators help identify optimal exit points.
Moving Averages
Exponential Moving Averages (EMA) react faster to price changes than Simple Moving Averages by weighting recent prices more heavily, making them ideal for options traders needing timely signals. Common periods include 20-day, 50-day, and 200-day averages.
For exit timing, watch how price interacts with key moving averages. If you hold call options and price breaks below a significant moving average like the 50-day, this is often viewed as a signal to exit. Put option holders often monitor if the price breaks above key averages.
Average True Range (ATR)
Average True Range measures volatility by calculating the average range between high and low prices. Higher ATR indicates increased volatility and inflated premiums, while lower ATR suggests quieter markets. Declining ATR after a strong move signals fading momentum, making it an appropriate exit time. Traders also use ATR to set stop-loss levels at one or two times the ATR from entry.
Volume-Weighted Average Price (VWAP)
Volume-Weighted Average Price calculates the average price weighted by volume, especially valuable for intraday options traders. Price above VWAP indicates buyer control, while price below VWAP shows seller dominance. If call options consistently trade below VWAP or put options above VWAP, this is often viewed as a signal to exit.
Combining Technical Indicators for Better Accuracy

No single technical indicator provides perfect signals. Professional options traders combine multiple indicators to filter false signals and increase confidence in their decisions.
Complementary Indicator Combinations
Pairing a momentum indicator like RSI with a trend indicator like MACD creates a powerful combination. RSI identifies overbought or oversold conditions while MACD confirms whether the trend supports the potential reversal. Traders typically wait for both indicators to align before entering a trade.
Adding Bollinger Bands to this combination provides volatility context. If RSI shows oversold conditions and MACD generates a bullish crossover while price touches the lower Bollinger Band, all three indicators confirm the same signal, increasing the probability of a favourable outcome.
Timeframe Alignment
Match indicator timeframes with options expiration dates. Weekly options require 5-minute or 15-minute charts with shorter periods, while monthly options work better with daily charts and standard settings (14-day RSI, 12-26-9 MACD). Check larger timeframes for primary trends, then use shorter timeframes to fine-tune entries and exits.
Avoiding Common Mistakes
Technical indicators lag price action, so avoid waiting for perfect alignment. Use indicators to confirm price action, not replace it. Stick to three or four complementary indicators rather than cluttering charts with too many tools that create conflicting signals.
Options-Specific Considerations
While standard technical indicators provide valuable insights, options traders must also consider factors unique to derivatives trading.
Implied Volatility Considerations
Implied Volatility (IV) represents expected future price volatility and directly impacts premiums. High IV inflates premiums (better for selling), while low IV compresses them (better for buying). Combine technical indicators with IV analysis—if RSI shows oversold but IV is high, selling put options may offer better risk-reward than buying calls.
IV Rank compares current IV to its yearly historical range. Generally, an IV Rank above 50 suggests higher premiums, while below 50 suggests lower premiums, influencing strategy selection.
Time Decay Awareness
Options lose value as expiration approaches, with accelerating decay in final weeks. If indicators suggest holding but expiration nears, time decay may erode profits despite directional accuracy. One strategy traders use is rolling positions when analysis remains favorable but time runs short.
Matching Strategy to Market Conditions
Strong trending markets suit directional trades (long calls or puts), while range-bound markets favour neutral strategies (iron condors or butterfly spreads). Bollinger Band squeezes indicating low volatility often precede breakouts, ideal for straddles or strangles. Extended bands suggesting high volatility favour strategies profiting from mean reversion.
Practical Implementation Tips
Start with Core Indicators
Begin with three widely used indicators: RSI for momentum, MACD for trend confirmation, and Bollinger Bands for volatility. Master these thoroughly before adding complexity. Track trades in a journal, noting which signals preceded successful outcomes.
Set Clear Rules and Backtest
Define specific entry and exit criteria: "Enter call options when RSI crosses above 30, MACD shows bullish crossover, and price exceeds the 20-day EMA." Before risking capital, backtest combinations on historical data to build confidence and understand when signals work best.
Monitor Positions Effectively
Use indicators to monitor multiple positions simultaneously. Set alerts when indicators reach critical levels. Platforms offering advanced data visualization and market tracking tools make monitoring more manageable, especially when trading across Singapore, US, and Hong Kong markets.
Frequently Asked Questions
Which technical indicator is commonly used for options trading?
No single indicator works best for all situations. The Relative Strength Index (RSI) excels at identifying overbought and oversold conditions for timing reversals, while Moving Average Convergence Divergence (MACD) confirms trend strength. Successful options traders combine three to four complementary indicators rather than relying on any single tool. The best approach matches indicators to your trading timeframe and strategy.
How do I use RSI for options entries?
RSI identifies extreme conditions preceding reversals. Below 30 signals oversold (call opportunities), above 70 indicates overbought (put opportunities). Divergences—where price makes new extremes but RSI does not—signal weakening momentum and strengthen reversal confirmation.
Should I use different indicators for weekly versus monthly options?
Yes, match timeframes to expiration dates. Weekly options need 5-15 minute charts with faster settings (7-period RSI), while monthly options work better with daily charts and standard periods (14-period RSI). This alignment ensures analysis matches your trade horizon.
Can technical indicators predict implied volatility changes?
ATR and Bollinger Bands measure historical volatility, which correlates with but does not directly predict implied volatility. Bollinger Band squeezes often precede volatility expansions, providing early warning of potential IV increases. Combine these with IV Rank for comprehensive assessment.
How many technical indicators should I use simultaneously?
Three to four complementary indicators provide optimal balance—one from each category (momentum, trend, volatility). More indicators do not improve results and may cause analysis paralysis. Focus on mastering a core set rather than constantly adding new tools.
The choice of financial instruments depends on your investment objectives, risk tolerance, market outlook, and experience level. Regardless of the method selected, it is essential to fully understand its mechanics, risk characteristics, and execution rules, while maintaining a robust risk management plan. You can learn more about investment strategies through the Longbridge Academy or by downloading the Longbridge App.