Unusual Options Activity: How to Interpret It
Discover how to interpret unusual options activity signals, from volume-to-open interest ratios to block and sweep trades, and learn what these institutional moves may indicate about market sentiment.
TL;DR: Unusual options activity (UOA) refers to a significant spike in trading volume for options contracts compared to their historical averages. These anomalies can signal that institutional investors are taking positions ahead of potential price movements, making UOA a valuable tool for identifying market sentiment shifts.
When trading volume in an options contract suddenly surges far beyond its typical daily average, traders take notice. This phenomenon, known as unusual options activity, often signals that large institutional investors or well-informed traders are making strategic moves. For retail investors looking to understand market dynamics, learning to interpret these signals can provide valuable insights into potential price movements.
Unusual options activity occurs when specific contracts trade at volumes that deviate sharply from normal patterns. For example, if a stock's call option typically trades 1,000 contracts daily but suddenly sees 10,000 or more contracts in a single session, this flags potential UOA. Understanding what drives this activity, and how to analyze it properly, can be reviewed alongside other market information which may help you make more informed trading decisions.
What Is Unusual Options Activity?
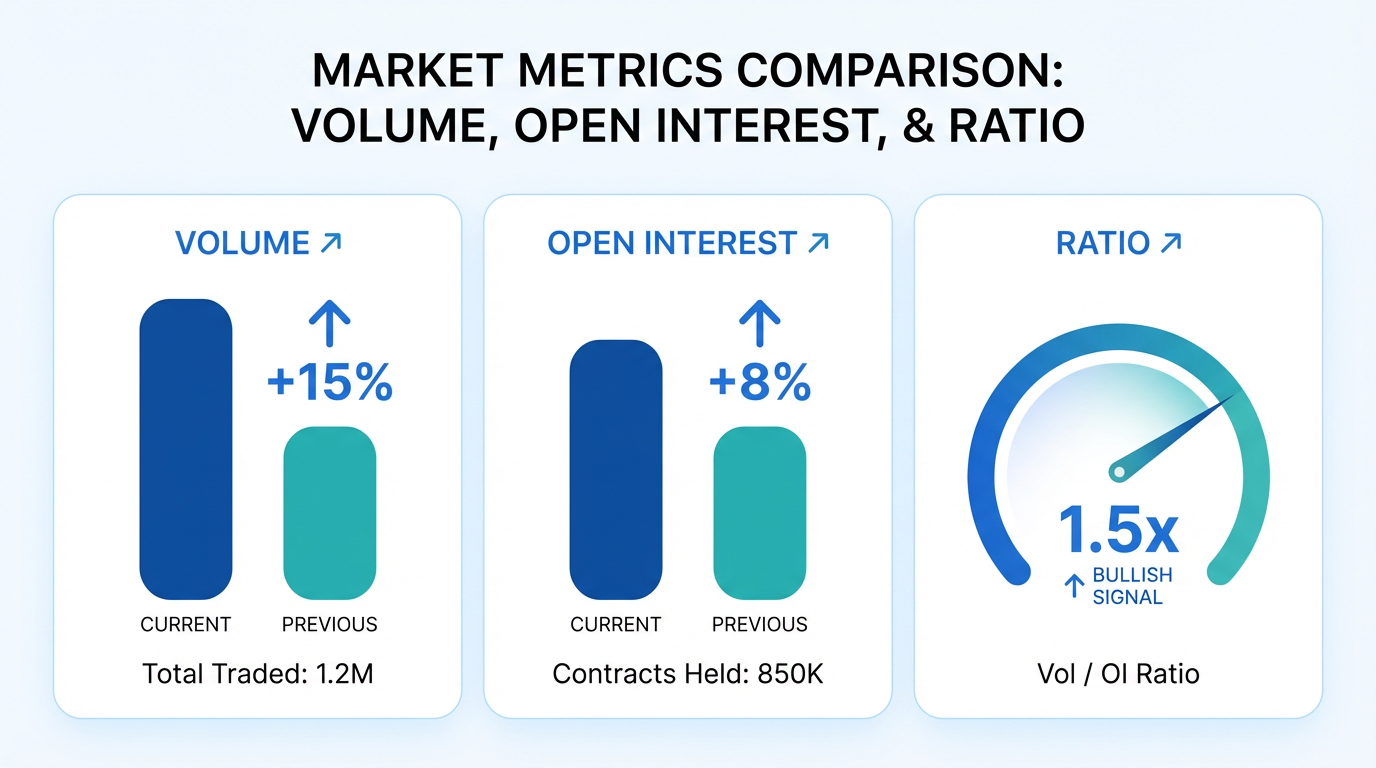
Unusual options activity identifies options contracts trading at significantly higher volumes relative to their open interest or historical averages. According to Barchart, for activity to qualify as "unusual" in US markets, the volume-to-open interest ratio typically needs to be 1.25 or above, with options volume exceeding 500 contracts and open interest above 100.
The underlying premise is straightforward: options markets often move before stock prices. Because options provide leveraged exposure, a trader expecting a substantial stock move can buy call options and potentially generate significant returns. This asymmetric payoff structure attracts traders who have high-conviction views about upcoming price movements.
Why Large Traders Use Options
Institutional investors and hedge funds frequently use options for several strategic reasons:
-
Leverage: Options require less capital than purchasing shares outright while providing exposure to price movements
-
Risk management: Options can hedge existing positions against potential losses
-
Strategic positioning: Large traders can establish positions ahead of anticipated catalysts like earnings announcements or corporate actions
Key Metrics for Analyzing Unusual Activity
Understanding which metrics to monitor is essential for interpreting unusual options activity effectively. Here are the primary indicators that professional traders may typically watch.
Volume-to-Open Interest Ratio
The volume-to-open interest ratio measures how many contracts are trading compared to the total outstanding contracts. A high ratio indicates new positions are being opened rather than existing positions being closed. When daily volume exceeds open interest, it may suggest significant new money is entering that particular contract.
Implied Volatility Changes
When options prices rise without a corresponding stock price movement, implied volatility (IV) is increasing. This suggests traders are willing to pay a premium for options, often in anticipation of upcoming price swings. A sudden IV spike can indicate that informed traders expect significant news or events.
Put-Call Ratio Shifts
The put-call ratio compares bearish bets (puts) to bullish bets (calls). While absolute levels matter, sudden shifts in the ratio often provide stronger signals. If a stock typically has a 0.6 put-call ratio and it spikes to 1.4, this meaningful change could indicate shifting sentiment among large traders.
Types of Unusual Options Trades
Not all unusual activity looks the same. Understanding the different trade types can help you interpret what institutional traders might be doing.
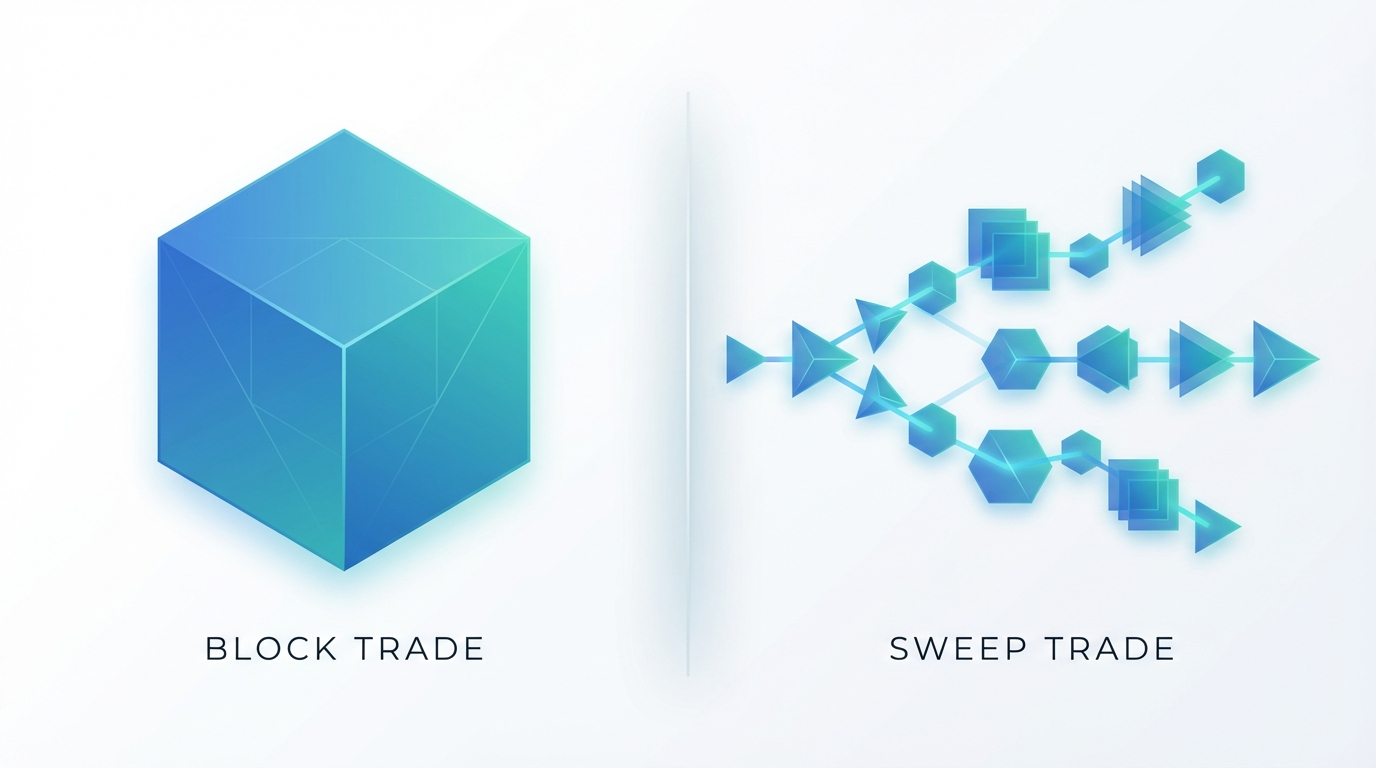
Block Trades
Block trades involve large orders, typically more than 10,000 contracts, executed as a single transaction. These trades often indicate that a major institutional investor is establishing or exiting a significant position. Block trades are easier to identify because of their size, but they also reveal the trader's hand more clearly.
Sweep Trades
Sweep trades are a series of smaller orders executed nearly simultaneously across multiple exchanges. Traders use sweeps when they want to fill a large order quickly without moving the market significantly. Sweep trades can indicate urgency, as the trader is willing to pay varying prices across exchanges to complete their position rapidly.
Common Triggers for Unusual Activity
Unusual options activity rarely occurs randomly. Certain events and catalysts typically drive these volume spikes.
Earnings Announcements
Quarterly earnings reports are perhaps the most common catalyst for unusual activity. Traders positioning ahead of earnings results often create noticeable spikes in options volume. This activity can occur days or even weeks before the announcement date.
Corporate Actions
Mergers and acquisitions, stock buybacks, and other corporate actions frequently trigger unusual options activity. In some cases, informed traders may position themselves before public announcements, though trading on material non-public information is illegal.
Regulatory and Economic Events
Major economic data releases, regulatory decisions, and industry-wide developments can spark unusual activity across multiple stocks or sectors. Keeping track of the economic calendar can help you anticipate potential catalysts.
How to Interpret Unusual Options Activity
Identifying unusual activity is one thing; interpreting it correctly requires additional analysis. Here is a practical framework for evaluating UOA signals.
Analyze Strike Prices and Expiration Dates
Pay attention to which strike prices are attracting volume. Out-of-the-money options suggest traders are betting on significant price moves, while at-the-money or in-the-money options may indicate more conservative positioning. Short-dated options suggest traders expect imminent movement, while longer-dated contracts may signal longer-term views.
Consider the Direction
Determine whether the activity is concentrated in calls (bullish) or puts (bearish). However, remember that a large put purchase could be a hedge on an existing long stock position rather than a bearish bet. Without knowing the trader's full portfolio, interpreting direction can be challenging.
Cross-Reference with Fundamentals
Unusual options activity provides insight into sentiment, but it should not be your sole decision-making factor. Combine UOA signals with fundamental analysis. Review the company's earnings, debt levels, and growth prospects. Check recent news flow for insider trading disclosures or Securities and Exchange Commission (SEC) filings that might explain the activity.
Tip: Use comprehensive market data tools to track unusual options activity alongside fundamental research. Platforms with integrated stock screeners can help you filter and analyze potential opportunities efficiently.
Limitations and Cautions
While unusual options activity can provide valuable signals, it comes with significant limitations that every trader should understand.
Not All Activity Signals Direction
A massive put purchase might appear bearish, but it could actually be a hedge protecting an even larger long stock position. Similarly, heavy call buying might be part of a complex multi-leg strategy rather than a straightforward bullish bet. Without visibility into the trader's complete portfolio, definitive conclusions are difficult.
Timing Challenges
Even when unusual activity correctly signals direction, the timing can be unpredictable. Options have expiration dates, and being right about direction but wrong about timing can still result in losses. A trader might correctly anticipate a stock's movement but see their options expire worthless because the move happened later than expected.
Institutional Hedging
Large institutions frequently use options to hedge existing positions rather than to speculate on direction. A fund holding millions of shares ahead of a volatile event might buy put options as insurance against short-term downside. This protective activity creates unusual volume but does not necessarily indicate a bearish outlook.
Building a Research Process
To use unusual options activity effectively, develop a systematic approach that combines multiple data points. Here is a suggested workflow:
-
Identify unusual activity using screening tools that filter for high volume-to-open interest ratios and significant volume spikes
-
Analyze the contract details including strike price, expiration date, and whether the trades appear to be block or sweep orders
-
Research the underlying company by reviewing recent news, upcoming catalysts, and fundamental metrics
-
Check broader market sentiment to understand if the activity is stock-specific or part of a sector-wide trend
-
Determine your risk tolerance before making any trading decisions based on UOA signals
Learning to navigate options markets and interpret institutional activity takes time. Resources like the Longbridge Academy can help you build foundational knowledge about options trading strategies and market analysis techniques.
Frequently Asked Questions
What does unusual options activity mean for a stock?
Unusual options activity indicates that trading volume in specific options contracts significantly exceeds normal levels. This can suggest that large traders or institutions are positioning for an anticipated price move. However, the activity alone does not guarantee price movement, as it may represent hedging or other non-directional strategies.
How can I find unusual options activity?
Several online tools and platforms track unusual options activity in real-time. Look for scanners that filter based on volume-to-open interest ratios, minimum volume thresholds, and price criteria. Many platforms highlight large individual trades that may represent institutional positioning.
Is unusual options activity a reliable trading signal?
Unusual options activity can provide useful context about market sentiment, but it should not be used as a standalone trading signal. The activity's meaning is not always clear, as large trades may represent hedging rather than directional bets. Combining UOA analysis with fundamental research and broader market context produces more reliable insights.
Conclusion
Unusual options activity offers a window into how institutional traders and large investors are positioning in the market. By monitoring volume spikes, analyzing trade types, and cross-referencing with fundamental data, retail investors may gain valuable insights into potential market movements.
However, interpreting UOA requires caution and context. Not all unusual activity signals a directional move, and timing remains challenging even when the signal is correct. The most effective approach treats unusual options activity as one component of a broader research process rather than a standalone trading strategy.
The choice of financial instruments depends on your investment objectives, risk tolerance, market outlook, and experience level. Regardless of the method selected, it is essential to fully understand its mechanics, risk characteristics, and execution rules, while maintaining a robust risk management plan. You can learn more about investment strategies through the Longbridge Academy or by downloading the Longbridge App.