Key Options Metrics: Open Interest, Volume & Put/Call Ratio
Understand how open interest, volume, and the put/call ratio interact toreveal market sentiment and support better-informed options trading decisions.
TL;DR: Open Interest (OI), volume, and the Put/Call Ratio (PCR) are three core options metrics that reveal market sentiment and trader positioning. Understanding how they work together helps you read market conditions more clearly and make better-informed trading decisions.
Options trading involves much more than choosing which contracts to buy or sell. Before placing a trade, experienced traders examine key metrics that reveal how the broader market is positioned. Among these, open interest, volume, and the put/call ratio are some of the most widely referenced. Together, they offer a layered view of market sentiment — not just what is happening, but why. This guide breaks down each metric clearly and shows how they complement one another as part of a balanced analytical approach.
What Is Open Interest in Options?
Open interest (OI) refers to the total number of options contracts that are currently outstanding — meaning they have not yet been exercised, closed, or expired. Unlike volume, which counts every contract traded during a single session, open interest only tracks the contracts that remain active.
Think of it this way: if two traders enter a new contract, open interest rises by one. If one of those traders later closes their position, open interest falls by one. This makes open interest a useful measure of the market's cumulative commitment to a particular strike price or expiry.
Why Open Interest Matters
A rise in open interest alongside a price move suggests that new money is entering the market and supporting that move. Conversely, declining open interest during a price rally may indicate that the move is driven by short covering rather than fresh conviction — a subtle but important distinction.
Open interest also highlights which strike prices attract the most activity. High concentrations at specific levels may act as informal support or resistance. Tracking these concentrations over time can reveal where large players are positioning themselves.
Tip: Monitor open interest alongside price movements. Rising OI with rising prices confirms bullish conviction; rising OI with falling prices confirms bearish positioning.
What Is Options Volume?
Volume measures the number of contracts traded during a specific session. It resets to zero at the start of each trading day, making it a real-time pulse of market activity rather than a cumulative measure.
High volume on a particular contract signals strong interest for that session. Combined with price direction, it can confirm momentum or reveal unusual activity — for example, a sudden surge in call volume before an earnings announcement may suggest informed positioning.
Open Interest vs. Volume: Key Differences
While the two metrics are related, they serve different purposes:
| Metric | What It Measures | Time Horizon |
|---|---|---|
| Volume | Contracts traded in a single session | Short-term (daily) |
| Open Interest | Total outstanding contracts | Longer-term (cumulative) |
Volume tells you the current pace of activity. Open interest tells you the weight of existing commitments. Together, they paint a more complete picture than either metric alone.

Understanding the Put/Call Ratio
The put/call ratio (PCR) compares the number of put options to call options, using either volume or open interest as the base. The formula is straightforward:
Put/Call Ratio = Total Puts ÷ Total Calls
For example, if a stock has 200,000 outstanding put contracts and 150,000 call contracts, the PCR based on open interest is approximately 1.33.
Traders use this ratio as a sentiment gauge. A high PCR suggests that more traders are buying puts — typically used to hedge against or profit from price declines. A low PCR suggests that calls dominate, indicating more bullish positioning.
Volume-Based vs. Open Interest-Based PCR
The PCR can be calculated in two ways, and each version has a different purpose:
Volume-based PCR captures the current day's trading activity. It is more sensitive to short-term shifts in sentiment, making it useful for day traders and those monitoring intraday conditions.
Open interest-based PCR reflects cumulative positioning across all outstanding contracts. It is slower to change and better suited for identifying longer-term sentiment trends.
Professional traders often track both simultaneously: the volume-based PCR for timing signals, and the open interest-based PCR for broader context. Divergences between the two can signal that short-term activity is diverging from the longer-term picture — a potentially significant development.
How to Interpret the Put/Call Ratio
The PCR is primarily used as a contrarian indicator. This means that extreme readings in either direction can signal that market sentiment has become stretched, potentially preceding a reversal.
Here is a general reference framework for broad market indices:
| PCR Value | Sentiment Interpretation |
|---|---|
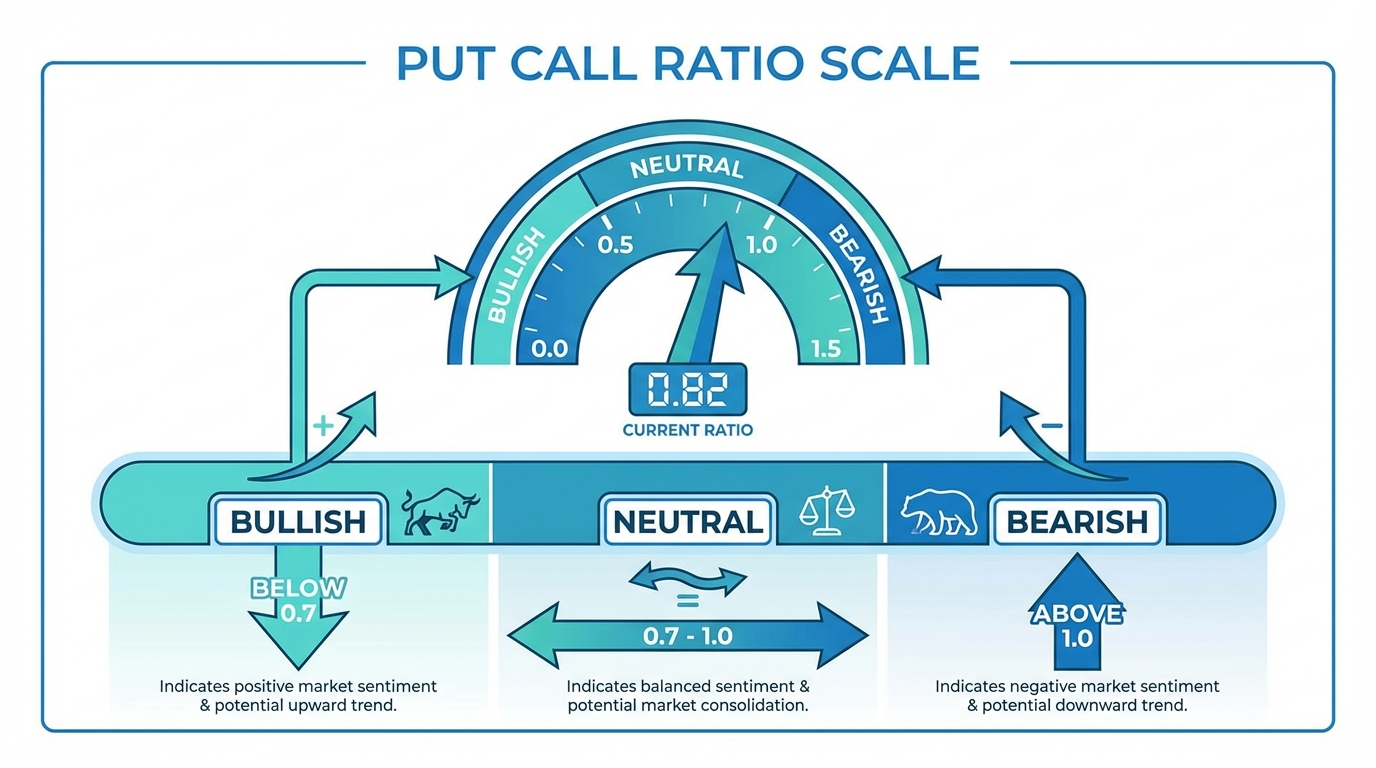
| Below 0.50 | Extreme bullishness, potential correction risk |
| 0.50 to 0.70 | Bullish positioning |
| 0.70 to 1.0 | Neutral to slightly cautious |
| Above 1.0 | Bearish sentiment |
| Above 1.15 | Elevated fear, potential oversold conditions |
It is worth noting that these thresholds are not universal. Context matters significantly: individual stocks tend to have higher typical PCR readings than broad indices, and defensive sectors often show different baselines compared to high-growth areas.
Using PCR as a Contrarian Signal
When the PCR reaches an extreme high, it often means a large number of market participants are already positioned defensively. In contrarian terms, this can sometimes signal that fear has become overdone and that prices may be approaching a turning point. The reverse applies at extreme lows, where excessive optimism may indicate overbought conditions.
That said, applying contrarian logic requires care. A rising PCR during a genuine bear market may simply reflect rational caution rather than irrational fear. This is why the PCR works best when used alongside other indicators rather than in isolation.
Tip: Always compare the current PCR against its own historical range for that specific index or stock. What counts as "extreme" varies by instrument.
Combining These Metrics for Better Analysis
The real analytical power comes from reading open interest, volume, and the PCR together. Each metric answers a different question:
Open interest answers: How much is the market committed to existing positions?
Volume answers: How active is today's trading?
PCR answers: Where is the balance of sentiment sitting right now?
When the PCR rises while volume surges and open interest builds in put options, this creates a convergent signal that bears are actively adding to their positions. If volume spikes but open interest stays flat, it may reflect rolling of existing positions rather than genuinely new bearish sentiment.
Supporting Tools
These metrics complement a broader analytical toolkit. Pairing PCR and OI data with volatility indicators such as the VIX (Cboe Volatility index) and technical tools like moving averages helps filter noise and improve signal reliability.
For traders who use platforms with comprehensive market data and quote tracking, having access to real-time OI and volume data across multiple strikes and expiries is particularly valuable.
Practical Considerations and Limitations
While these metrics provide useful context, several factors can skew their readings:
Expiration cycles: Open interest typically spikes before major expiration dates, which can distort the PCR temporarily.
Institutional hedging: Large institutional players often buy puts purely for portfolio protection rather than to express a bearish market view. This can inflate the PCR without reflecting genuine pessimism.
Earnings and events: Corporate announcements, economic data releases, and central bank decisions can cause rapid, event-driven shifts in options activity that distort normal patterns.
Individual stock variation: PCR levels considered normal for one stock may be extreme for another, so always evaluate readings in context.
These limitations underscore the importance of treating OI, volume, and the PCR as inputs to a broader analytical process rather than definitive signals on their own.
Frequently Asked Questions
What is a good put/call ratio?
There is no single "good" level — the right interpretation depends on context. For broad market indices, a PCR between 0.70 and 1.0 is generally considered neutral. Readings significantly above 1.15 may suggest elevated fear, while readings below 0.50 may indicate excessive optimism. Always compare the current reading against the historical range for the specific instrument you are tracking.
Is a high put/call ratio bullish or bearish?
A high PCR is technically bearish in that it reflects more puts than calls outstanding. However, when used as a contrarian indicator, a very high PCR can actually be read as a potential signal that sentiment has become overly negative — which, counterintuitively, may precede a market rebound. Context and trend direction matter when applying this interpretation.
What is the difference between open interest and volume in options?
Volume measures how many contracts are traded during a single session and resets each day. Open interest measures the total number of outstanding contracts that have not yet been closed or expired, accumulating over time. Volume is a real-time activity indicator; open interest reflects the depth of existing positioning.
Can the put/call ratio be used for individual stocks?
Yes, but individual stocks often have different typical PCR ranges compared to broad market indices. Stocks with active options markets can provide useful signals, but the thresholds for "extreme" readings tend to differ. Analysing the historical PCR range for a specific stock helps establish meaningful reference points.
How often should I check the put/call ratio?
This depends on your investment horizon. Day traders may monitor it every 30 to 60 minutes during market hours. Swing traders typically review it at the close of each session. Investors with longer time horizons may find weekly or monthly PCR trends more relevant than daily fluctuations.
Conclusion
Open interest, volume, and the put/call ratio are foundational metrics for anyone participating in options markets. Each tells a distinct part of the story: OI reveals accumulated positioning, volume captures live activity, and the PCR distills overall sentiment into a single readable number. Used together, they help you move beyond surface-level price data and understand the forces shaping market movements.
As with any analytical tool, these metrics work best within a broader framework. They are indicators of sentiment and positioning — not predictions. Interpreting them accurately requires consistency, historical context, and integration with other forms of analysis.
The choice of financial instruments depends on your investment objectives, risk tolerance, market outlook, and experience level. Regardless of the method selected, it is essential to fully understand its mechanics, risk characteristics, and execution rules, while maintaining a robust risk management plan. You can learn more about investment strategies through the Longbridge Academy or by downloading the Longbridge App.