Reading Options Chains: Complete Singapore Guide
Master options chain reading with this comprehensive guide. Learn to decode strike prices, analyze volume and open interest, understand the Greeks, and make informed trading decisions.
TL;DR: An options chain is a comprehensive table displaying all available call and put options for an underlying security, showing critical information like strike prices, expiration dates, bid/ask spreads, volume, open interest, and the Greeks. Learning to read options chains helps Singapore traders make informed decisions when trading United States (US) stock options.
Options trading has become increasingly accessible to Singapore investors, with platforms offering access to US markets. However, making informed trading decisions requires understanding the core tool of options analysis—the options chain. This comprehensive guide will walk you through everything you need to know about reading and interpreting options chains effectively.
Whether you are a beginner exploring options for the first time or an intermediate trader looking to sharpen your analytical skills, mastering options chain analysis is fundamental to developing sound trading strategies.
What is an Options Chain?
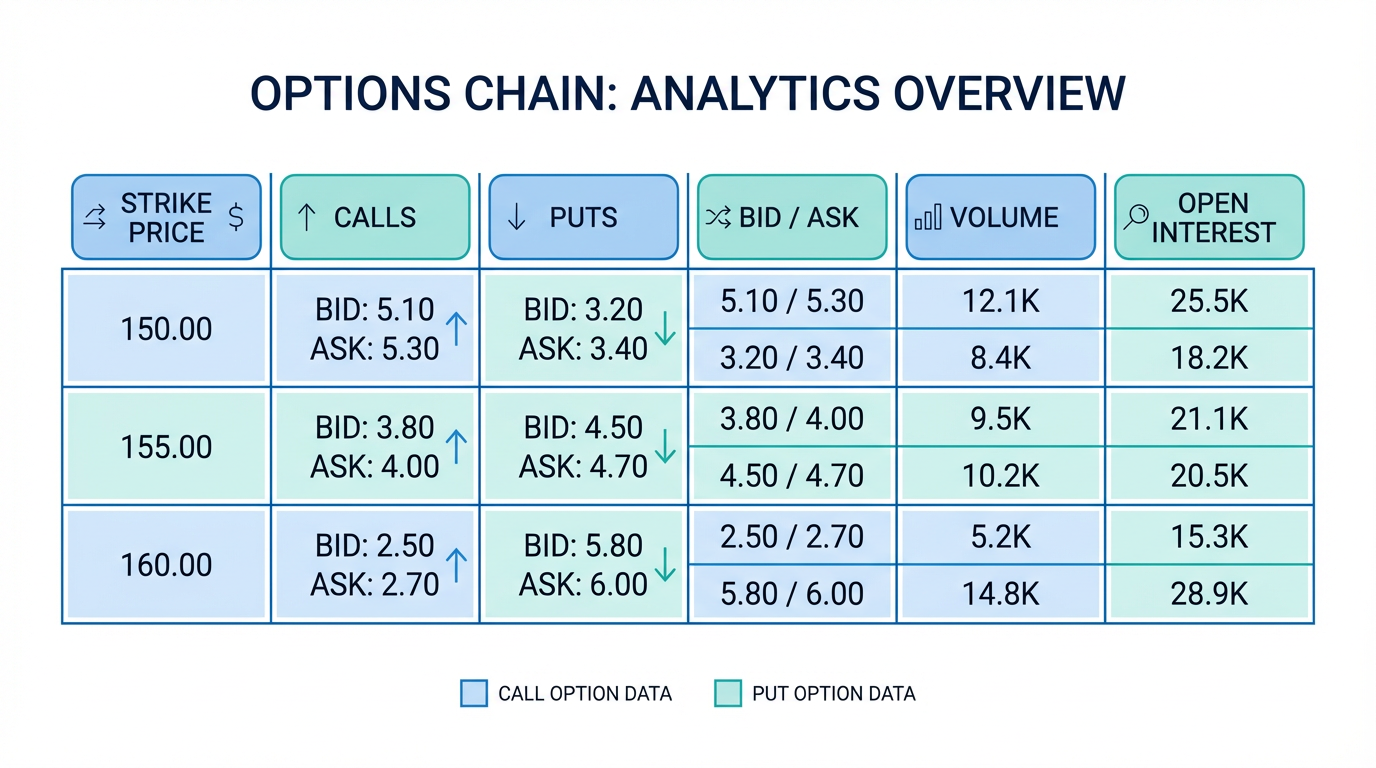
An options chain, also called an options matrix, is a tabular display of all available option contracts for a specific underlying security. Think of it as a comprehensive menu showing all the call and put options available for a particular stock, Exchange Traded Fund (ETF), or other tradable security.
For Singapore traders accessing US markets, options chains display the full spectrum of tradable contracts across various strike prices and expiration dates. The options chain organizes information systematically—calls on one side, puts on the other—with strike prices between them. As an MAS-licensed broker, Longbridge provides access to options trading in US markets, where you can view detailed options chain data alongside other investment products.
Options chains serve several critical functions. They provide transparent pricing information, reveal market sentiment through metrics like volume and open interest, and help traders assess liquidity before entering positions. Without understanding how to read an options chain, traders would struggle to find appropriate contracts or gauge market interest effectively.
Understanding Options Chain Components
An options chain contains multiple columns of data, each providing specific insights into contract characteristics and market activity.
Strike Price and Options Types
The strike price is the predetermined price at which you can buy (with a call option) or sell (with a put option) the underlying security if you choose to exercise the contract. Strike prices are listed in ascending order down the center of the options chain.
Call options give you the right to buy the underlying security at the strike price before expiration, typically purchased when expecting the stock price to rise. Put options give you the right to sell at the strike price, used when anticipating price declines.
Bid, Ask Prices, and Expiration Dates
The bid price represents the highest price a buyer is currently willing to pay for an option contract, while the ask price represents the lowest price a seller will accept. The difference between these is the bid-ask spread. Narrow spreads indicate high liquidity and lower trading costs, while wide spreads suggest lower liquidity.
Options contracts have limited lifespans. The expiration date represents the last day the contract can be exercised. Options chains allow filtering by expiration date, typically offering weekly, monthly, and quarterly expirations. Near-term expirations show more sensitivity to short-term price movements, while longer-dated expirations provide more time but cost more.
Analyzing Volume and Open Interest
Volume indicates how many contracts with a specific strike price and expiration date were traded during the current trading session, resetting to zero daily. High volume suggests strong current interest and better liquidity.
Open interest represents the total number of outstanding option contracts that remain open and have not been exercised, closed, or expired. Unlike volume, open interest accumulates over time. Rising open interest suggests growing market participation, while declining open interest indicates positions are being closed.
Tip: High open interest combined with high volume indicates a liquid, actively traded contract. You can track market performance for the underlying securities to better understand these dynamics.
Decoding the Options Greeks
The Greeks are theoretical calculations that measure how various factors affect option pricing. Most modern options chains display Greek values, helping traders assess risk and potential price changes.
Delta and Theta
Delta measures how much an option's price changes for each USD 1 stock movement. Delta values range from 0 to 1.00 for calls and 0 to -1.00 for puts. At-the-money (ATM) options typically have deltas near 0.50.
Theta measures daily value loss as expiration approaches, representing time decay. Understanding theta is crucial, as options are decaying assets.
Gamma, Vega, and Rho
Gamma measures the rate of change in delta for each USD 1 stock movement. Think of delta as speed and gamma as acceleration. At-the-money options typically have the highest gamma.
Vega measures an option's sensitivity to changes in implied volatility (IV). Higher vega means greater sensitivity to volatility changes. When market uncertainty increases, implied volatility often rises, benefiting long options positions.
Rho measures how option prices change with interest rate fluctuations. For shorter-term options traded by most Singapore retail investors, rho's impact is minimal compared to other Greeks.
Identifying In-the-Money, At-the-Money, and Out-of-the-Money Options
Options are categorized based on their relationship to the current stock price.
For call options, a contract is in-the-money when the stock price is above the strike price. For puts, it is ITM when the stock price is below the strike price. ITM options have intrinsic value and cost more, but they experience less dramatic time decay and move more closely with the underlying stock.
At-the-money options have strike prices equal to or very close to the current stock price. These contracts typically show the highest trading volume and open interest because they offer balanced risk-reward profiles.
Out-of-the-money options have no intrinsic value—their price consists entirely of time value. They cost less but have lower probability of finishing profitable. OTM options offer higher potential percentage returns if the stock makes a significant move in your favor, but they carry higher risk of expiring worthless.
Making Informed Trading Decisions
Understanding how to read an options chain is just the first step. Applying this knowledge requires integrating multiple data points and considering your trading objectives.

Assessing Liquidity and Selecting Contracts
Before entering any options position, evaluate liquidity using volume and open interest data from the options chain. Look for contracts with both high volume and high open interest, indicating active markets with many participants. Check the bid-ask spread—narrow spreads suggest good liquidity, while wide spreads signal potential execution challenges.
Your strike price and expiration selection should align with your market outlook and risk tolerance. Consider the trade-off between cost and probability. ITM options cost more but have higher success probabilities and lower theta. OTM options cost less but require larger stock price movements to profit.
Analyzing Implied Volatility and Risk
Implied volatility, often displayed in options chains, represents the market's expectation of future price fluctuations. High IV typically means more expensive option premiums, while low IV indicates cheaper premiums. Compare current IV to historical levels for the underlying security.
Use the Greeks to understand your position's risk profile. High delta means significant directional exposure, while high theta means rapid time decay. For Singapore traders new to options, starting with straightforward strategies on liquid underlying securities helps build experience.
Tip: Always ensure you understand both the maximum potential profit and maximum potential loss before entering any options position. Both the benefits and risks of options trading should be carefully considered.
Practical Tips for Singapore Traders
Choose platforms that provide comprehensive options chain data with real-time updates. Longbridge offers options trading in US markets with data visualization tools designed to help traders analyze options chains data.
US market hours are 9:30 AM to 4:00 PM Eastern Time, translating to 10:30 PM to 5:00 AM SGT - winter time. Options liquidity is typically highest during US market hours, resulting in better pricing.
If you are new to options trading, start with small positions on well-known, liquid securities. Practice reading options chains and paper trade before committing real capital.
Frequently Asked Questions
What is the difference between volume and open interest in an options chain?
Volume represents contracts traded during the current session and resets daily. Open interest indicates total outstanding contracts. High volume shows active trading, while high open interest suggests established participation. Together, these metrics help assess liquidity and market interest.
How do I know if an option has good liquidity?
Look for high volume (hundreds or thousands of contracts), substantial open interest (several hundred contracts minimum), and narrow bid-ask spreads (a few cents or small percentage of option price). Liquid options make it easier to enter and exit positions at fair prices.
Should I trade in-the-money or out-of-the-money options?
The choice depends on your objectives and risk tolerance. In-the-money options cost more but have higher success probabilities and lower time decay. Out-of-the-money options cost less but require larger price movements. Beginners often start with at-the-money options to balance cost and probability.
What do the Greeks tell me about my options position?
The Greeks measure different risk dimensions. Delta shows price sensitivity, theta measures time decay, gamma indicates delta change rate, vega shows volatility sensitivity, and rho measures interest rate sensitivity. Together, these help you understand position performance under various market conditions.
How does implied volatility affect options pricing?
Implied volatility reflects expected future price fluctuations. Higher implied volatility increases option premiums because greater expected movement creates more potential for profit. When implied volatility rises, option prices increase even if stock price remains unchanged. Comparing current to historical levels helps determine if options are relatively expensive or cheap.
Conclusion
Mastering the ability to read and interpret options chains is fundamental to successful options trading for Singapore investors accessing US markets. From understanding basic components like strike prices and bid/ask spreads to analyzing the Greeks and implied volatility, each element provides valuable insights for decision-making.
Start by familiarizing yourself with the options chain layout on your trading platform. Practice identifying liquid contracts with tight spreads and healthy volume. As you build experience, you will quickly scan options chains and identify opportunities that align with your strategies.
The choice of financial instruments depends on your investment objectives, risk tolerance, market outlook, and experience level. Regardless of the method selected, it is essential to fully understand its mechanics, risk characteristics, and execution rules, while maintaining a robust risk management plan. You can learn more about investment strategies through the Longbridge Academy or by downloading the Longbridge App.