
 I'm LongbridgeAI, I can summarize articles.
This article explores the framework of new consumption investment, analyzing three major driving force models: macro driving force (consumption growth model), industrial driving force (people-goods-market model), and investment driving force (Garp strategy model). It also summarizes five major overseas experiences and nine key metrics, highlighting the growth potential and investment opportunities in the new consumption sector, and emphasizes the long-term performance of consumer stocks and market trends
Introduction: Looking at the growth trajectory of consumer stocks over the past thirty years, consumer scenarios are intertwined with the "beta of the era," corresponding to Miura Noboru's "Fourth Consumption Era." The new consumption wave in China has arrived. This article constructs a "New Consumption Investment Framework Guide" from three dimensions: driving force model, overseas experience, and investment indicator methods.
Three Major Driving Force Models of New Consumption Investment:
(1) Macroeconomic Driving Force [Consumption Growth Model]: Household consumption rate = consumption propensity * consumption capacity, boosting the marginal consumption propensity of the "lipstick economy" in the new era;
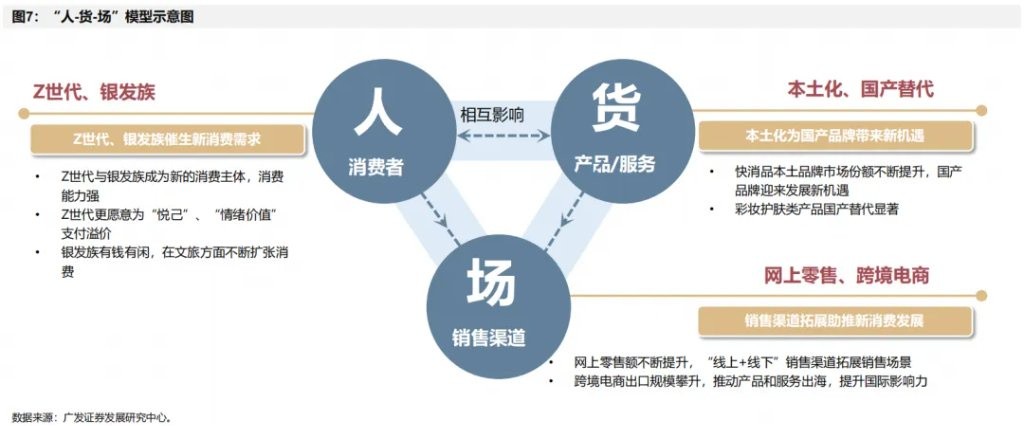
(2) Industrial Driving Force ["People-Goods-Scene" Model]: Systematic changes in consumption patterns, including Generation Z, national trends, and new cross-border opportunities;
(3) Investment Driving Force [Garp Strategy Model]: Consumption style aligns with the "reasonable valuation + stable growth" Garp stock selection logic, with many consumer sub-industries performing well year-to-date with PEG < 1.
Five Major Overseas Experiences in New Consumption Investment:
(1) Overseas Experience One: Consumer stocks have long bull attributes. According to "The Investor's Future," from 1957 to 2003, the top 20 "survivor" companies in the S&P 500 were highly concentrated in consumer goods, retail, and pharmaceuticals;
(2) Overseas Experience Two: Taking Hermès as an example, the "moat" of consumer stocks lies in pricing power, i.e., continuous improvement in gross profit margins;
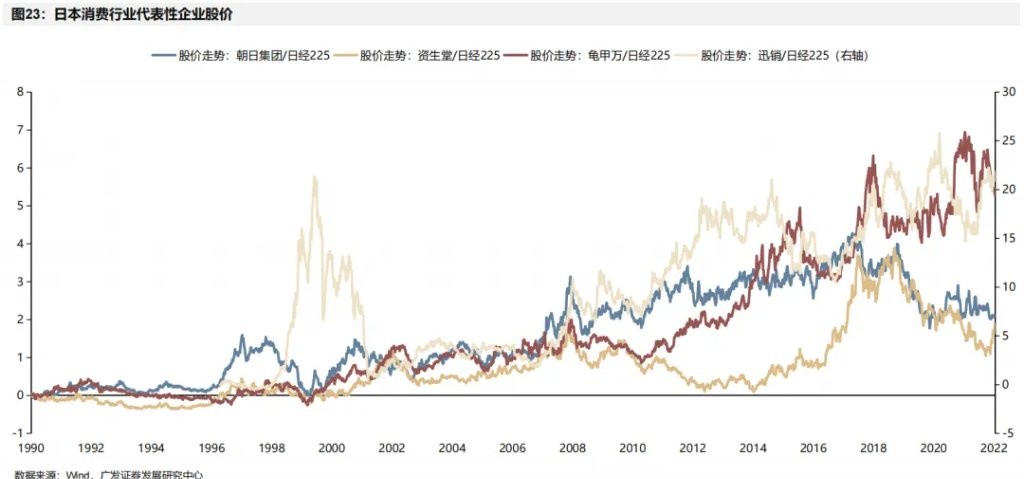
(3) Overseas Experience Three: Since the 1990s, Japan's consumption structure has evolved into "differentiation in downgrading," focusing on functional, convenient, and self-indulgent categories;
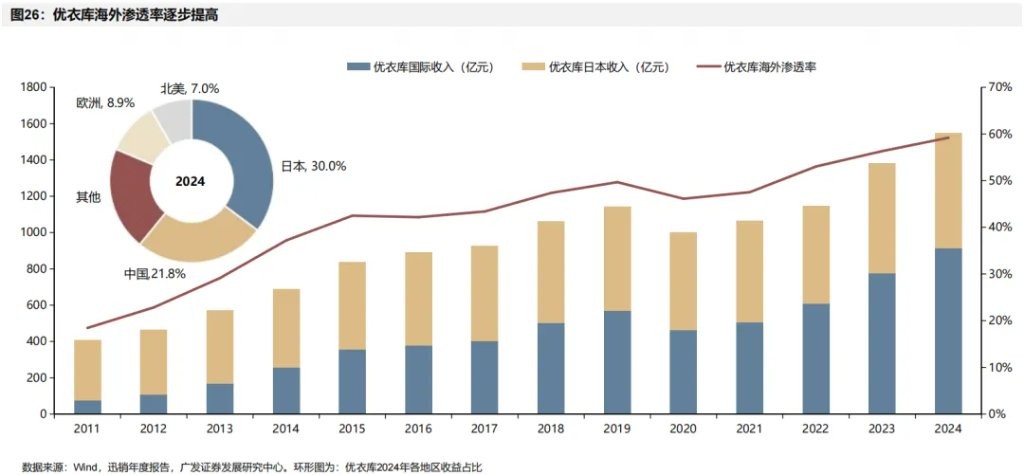
(4) Overseas Experience Four: Taking Japanese cosmetics and Uniqlo as examples, brand expansion overseas opens up profit margin boundaries;
(5) Overseas Experience Five: The penetration rates of medical beauty and pet care in China have vast room for growth compared to developed countries like the U.S. and Japan.
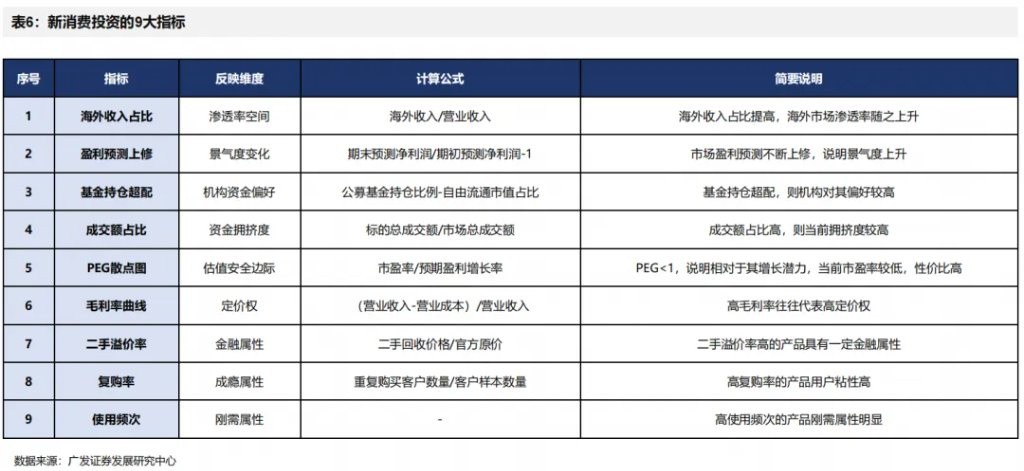
Nine Major Indicator Comparisons for New Consumption Investment:
(1) [Overseas Revenue Proportion] looks at penetration rate space. Leading new consumption enterprises are still at the intersection of "early growth + accelerated expansion."
(2) [Earnings Forecast Upgrade] Observing changes in economic conditions. The average annual compound growth rate in the new consumption sub-sector is expected to be over 20% from 2025 to 2027.
(3) [Fund Positioning Overweight] Observing institutional capital preferences. Since 2024, the overweight ratio of public funds has significantly increased, but the overall holding level remains low.
(4) [Transaction Amount Proportion] Observing crowding sentiment. By the end of June, the crowding degree in new consumption reached a peak.
(5) [PEG Scatter Plot] Observing valuation safety margins.
(6) [Gross Margin Curve] Observing pricing power, with gross margins in the new consumption sector generally maintained at around 30%-60%.
(7) [Second-Hand Premium Rate] Observing financial attributes. Old Puhuang Gold (second-hand discount rate <20%) and POP MART, among other Chinese products, demonstrate a value retention capability that surpasses overseas luxury goods.
(8) [Repurchase Rate] Observing addictive attributes. POP MART's 2024 annual report shows a repurchase rate of 50.7%, with members contributing 93.1% of sales.
(9) [Usage Frequency] Observing essential demand attributes. The consumption frequency of new-style tea drinks and cosmetics in China is increasing, forming a positive cycle from high-frequency consumption to improved penetration and scale effects.
Finally, based on the nine major indicators, we have conducted a "top-down" comprehensive evaluation to select a pool of new consumption stocks, focusing on areas such as [blind box trendy toys, low-end tea drinks, beauty products, and pet food].
Introduction: Accompanying the "Beta of the Era" — The Growth Trajectory of Consumption Stocks Over Thirty Years
Consumption labels change with shifts in demand, and the new consumption sector exhibits structural beta. Since the 1990s, the "beta" effect of the era has amplified the yield space of leading consumption stocks, with consumption labels evolving alongside demand. Driven by the rise of Generation Z, instant consumption, and other new demands of the era, the growth narrative of new consumption has quietly begun—
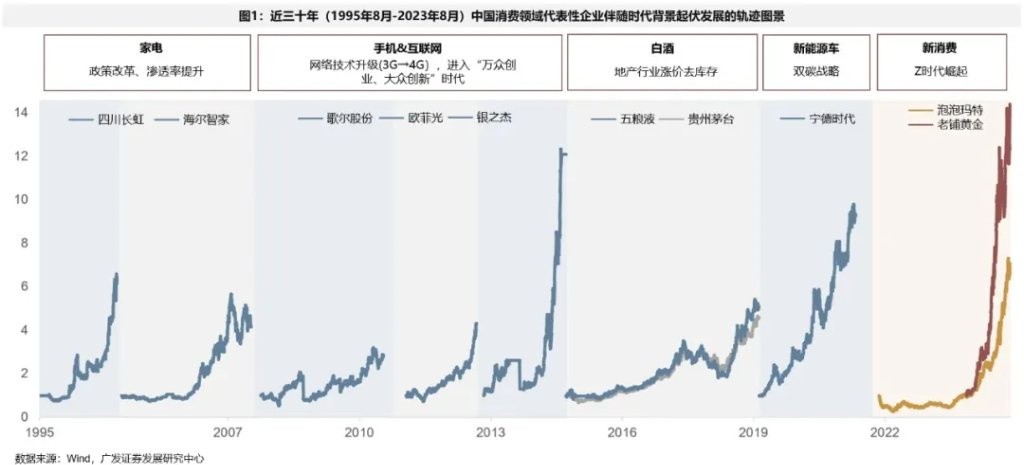
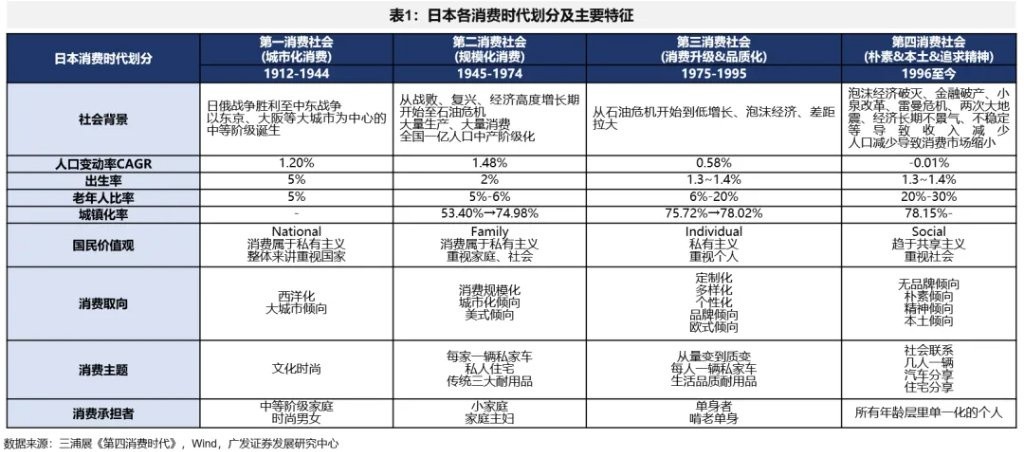
Miura Noboru's "The Fourth Consumption Era" provides certain characteristic insights for China's new consumption era:
(1) With changes in population structure, consumption trends are shifting towards "emotional value + cost-performance orientation." Generation Z, influenced by their living environment, ideological concepts, and economic uncertainties, values emotional consumption and often uses cost-performance as the core of their decision-making. For example, Old Puhuang Gold has opened up the "high-end gold" market, providing consumers with emotional value, as the gold sold has both value retention attributes and aligns with young people's aesthetics. According to Wind data, Old Puhuang Gold's market value increased 15 times within a year of its listing, with long queues forming outside stores before opening each day.
(2) Consumption is trending towards national trends and cultural exports, while also placing greater emphasis on spiritual and entertainment needs. For instance, POP MART, as a leading trendy toy IP company in China, started with the single hit Molly and has incubated multiple phenomenon-level IPs. This year, with the explosive popularity of Labubu, it has leaped to become a global phenomenon From Southeast Asia to Europe and America, fans are queuing up to buy Labubu, sparking a global buying frenzy.
Based on this, standing in the context of the new consumption era, this article focuses on three major perspectives to build a "New Consumption Investment Framework":
First, the "3 major" driving force model analyzes the excess return momentum of the new consumption main line, from the macro-level consumption growth model, to the industry-level "people-goods-market" model, and then to the investment-level Garp strategy model;
Second, the "5 major" overseas experience summarizes the investment characteristics of consumer stocks, such as the long bull property of U.S. consumer stocks, the consumption downgrade differentiation in Japan in the 1990s, the pricing power of Hermès, Uniqlo's overseas expansion, and the penetration rate comparison of the U.S. and Japanese consumer industries;
Third, the "9 major" indicators guide new consumption investment, including ① looking at penetration rate space from the overseas revenue proportion, ② looking at changes in prosperity from upward revisions of profit forecasts, ③ looking at institutional fund preferences from fund holdings overweight, ④ looking at crowding sentiment from transaction amount proportion, ⑤ looking at valuation safety margin from PEG scatter plots, ⑥ looking at pricing power from gross profit margin curves, ⑦ looking at financial attributes from second-hand premium rates, ⑧ looking at addiction attributes from repurchase rates, ⑨ looking at rigid demand attributes from usage frequency.
1. The 3 Major Driving Force Models of New Consumption Investment
(1) Macro Driving Force [Consumption Growth Model]: Boosting the Marginal Propensity to Consume (MPC) in the New Era
Consumption is the core factor driving GDP growth. From the traditional economic "three driving forces" model, on one hand, affected by international circumstances, the driving force of exports on GDP growth is limited under de-globalization; on the other hand, constrained by the current low capacity utilization rate, the total capital formation's contribution to GDP has shown a downward trend in recent years. Therefore, consumption will be the core contributing force to GDP growth in the future, which is also an important reason for the government to frequently introduce policies to boost consumption (such as "trade-in" policies, financial support for consumption policies, etc.) since last year.
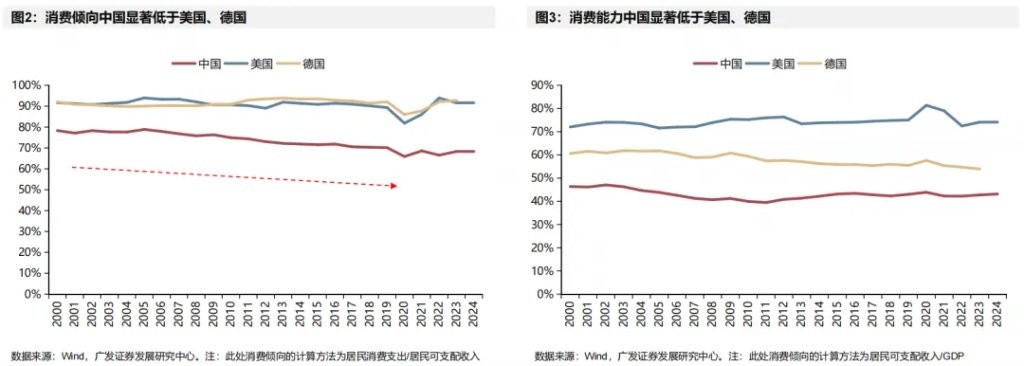
Compared to overseas, there is significant room for improvement in the proportion of consumption to GDP in China. According to iFind data, compared with other developed countries, China's consumption accounts for a significantly lower proportion of GDP, with consumption only accounting for about 50% of GDP, while the U.S. consumption ratio is as high as about 80%.
From the perspective of the household consumption rate model, the increase in the marginal propensity to consume (MPC) is the core variable for the future. According to Wind statistics, household consumption accounts for about 70% of China's consumption structure, making it a core component of consumption. The household consumption rate = household consumption expenditure/GDP = (household consumption expenditure/household disposable income) * (household disposable income/GDP) = consumption tendency * consumption capacity. Currently, household consumption faces dual constraints: first, the consumption capacity of Chinese households is significantly lower than that of developed countries like the U.S. and Germany, but income constraints make it difficult for consumption capacity to improve rapidly in the short term; second, influenced by macroeconomic expectations and other factors, the consumption tendency continues to decline, inhibiting the conversion of stock savings into consumption and reducing total demand. Based on Keynesian effective demand theory, short-term policies are expected to activate the "multiplier leverage" of the economic cycle by enhancing the marginal propensity to consume (MPC), revitalizing economic vitality
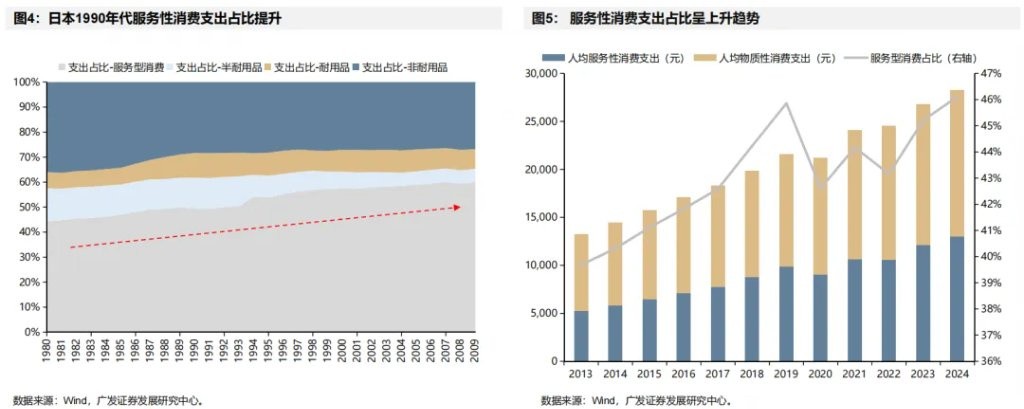
Using Japan's macroeconomic situation in the 1990s as a reference, although the wealth level and consumption capacity of Japanese households in the 1990s declined, they had already reached the level of developed countries. Consumers transitioned from pursuing material abundance to seeking spiritual satisfaction. This shift in consumption concept made "experiential consumption" activities more popular. According to Wind statistics, the proportion of service consumption expenditure has been rising year by year, increasing from 44.29% in 1980 to 60.07% in 2009. Meanwhile, expenditures on durable goods such as housing and vehicles decreased. From 1980 to 2009, the expenditure share of semi-durable and non-durable goods also showed a certain degree of decline, dropping from 13.25% and 36.00% in 1980 to 5.29% and 26.80% in 2009, respectively.
Service consumption may be a necessary direction for China's future macroeconomy. Similar to Japan in the 1990s, as Generation Z grows, the social consumption structure is undergoing adjustments, with the expenditure share of service consumption continuously increasing. At the same time, new consumption trends closely related to service consumption, such as emotional consumption and self-satisfying consumption, are emerging.
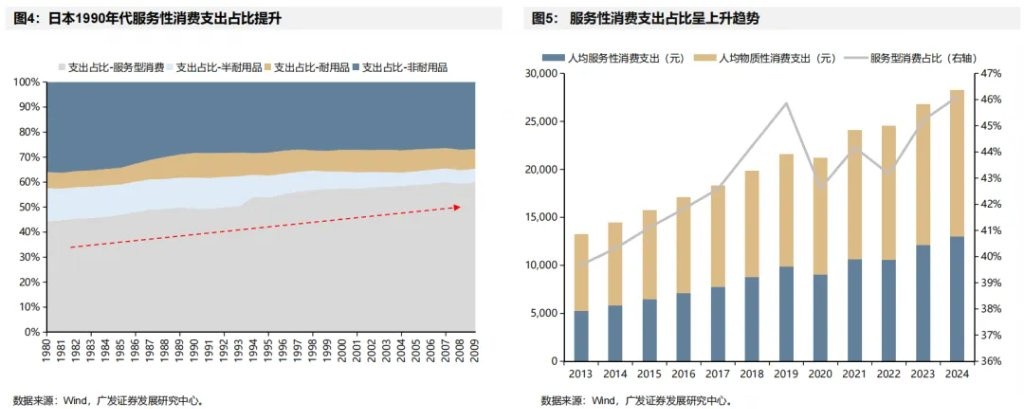
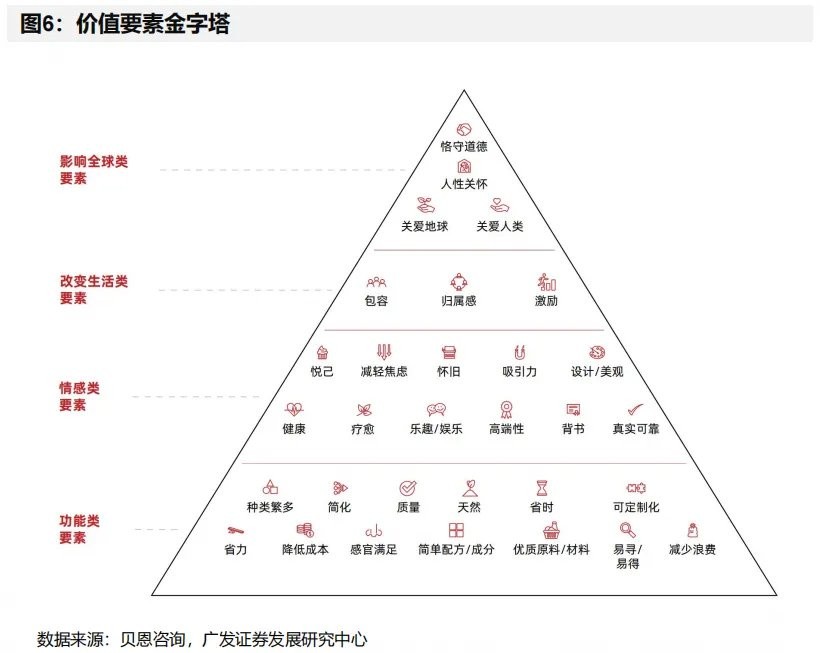
The changing curve of consumer preferences may provide characteristic clues for service consumption. China's consumption structure is shifting towards emotional value-driven consumption, with consumers leaning towards emotional value consumption and "quality-price ratio" consumption.
Therefore, the "lipstick economy" of the new era may be the optimal solution to boost consumption. The "lipstick" of the new era refers to consumer goods characterized by high emotional added value and high quality-price ratio (such as trendy blind boxes, jewelry, cosmetics, etc.): on one hand, its relatively low price attribute can break through the constraints of residents' income, matching their consumption capacity; on the other hand, it aligns with the current situation where consumers are willing to pay a premium for emotional satisfaction, effectively enhancing marginal consumption propensity.
(2) Industrial Driving Force [“People-Goods-Scene” Model]: Systematic Changes in Consumption Patterns
Currently, the consumption industry model in China has changed across the three fundamental dimensions of "people," "goods," and "scene," injecting core driving forces into the development of new consumption.
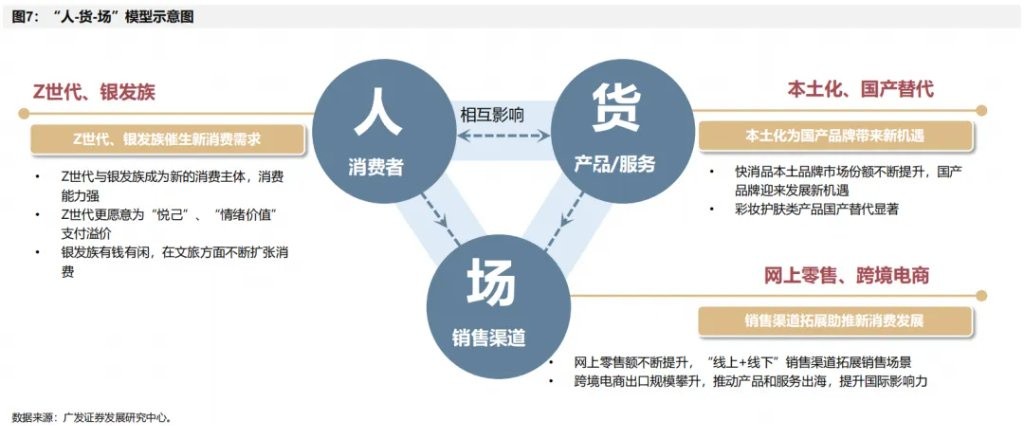
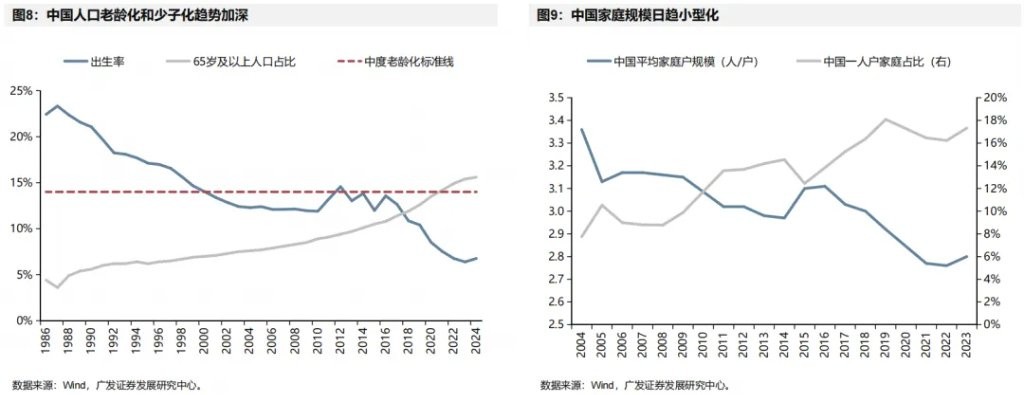
First, the change in the "people" factor: Generation Z and the silver-haired population create new demands China's population structure has shown a "U-shaped" differentiation. On one hand, according to Wind statistics, the proportion of the population aged 65 and above in China is expected to reach 15.6% in 2024, exceeding the international moderate aging standard (14%). The silver-haired group has a solid economic foundation and ample leisure time, expanding consumption in cultural and tourism expenditures, with "active aging" becoming a new paradigm. On the other hand, China's birth rate has been on a long-term downward trend, with the social phenomenon of "low birth rate" continuously intensifying, and the average household size continuing to decline. Generation Z is more willing to pay a premium for "self-pleasure" and "emotional value," and has gradually grown into a new consumer 主体.
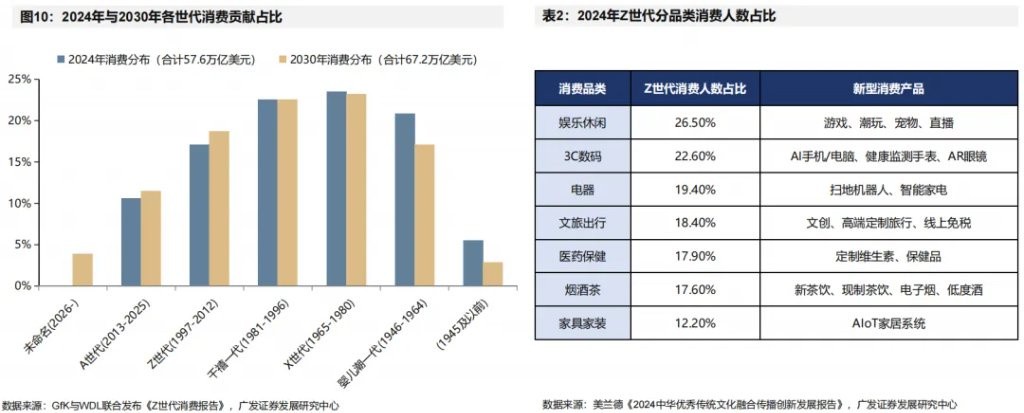
The two ends of the "U" shaped society (the silver-haired group and Generation Z) have the highest consumption capacity. According to the "Generation Z Consumption Report" jointly released by GfK and WDL, Generation Z (approximately 15-30 years old) is expected to have the fastest per capita expenditure growth from 2024 to 2030, with their purchasing power reaching USD 12.57 trillion by 2030, representing a compound annual growth rate of 4.14%. Additionally, the total consumption contribution of individuals aged 60 and above (baby boomers and those born earlier) will rank first in 2024, with a purchasing power of USD 15.15 trillion.
Among them, Generation Z's main consumption categories focus on emotional consumption and emerging products. According to the "2024 Report on the Innovative Development of the Integration and Dissemination of Excellent Traditional Chinese Culture" by Meilan, the proportion of Generation Z consumers in categories such as entertainment and leisure, 3C digital products, and appliances is 26.5%, 22.6%, and 19.4%, respectively.
Second, the change in the elements of "goods": New opportunities for local brands
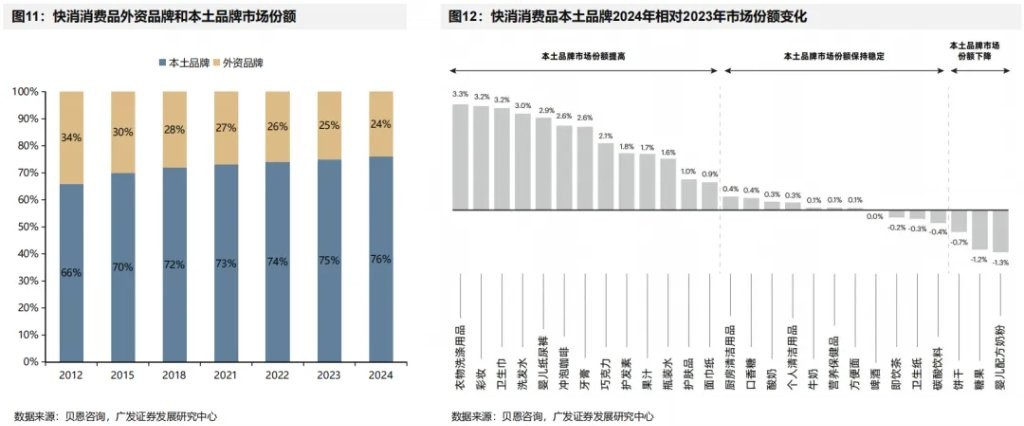
According to Bain & Company data, local brands continue to capture market share from foreign brands in the fast-moving consumer goods sector, with the market share of local brands increasing from 66% in 2012 to 76%, showing a trend towards localization of products.
In specific categories, local brands have significantly increased their market share in cosmetics and skincare products. According to Bain & Company statistics, among 27 fast-moving consumer goods categories, those with significantly increased market shares include cosmetics, conditioners, and skincare products, which are categorized as "self-pleasure" products.
Third, the change in the elements of "space": Expansion of sales channels in online and cross-border dimensions
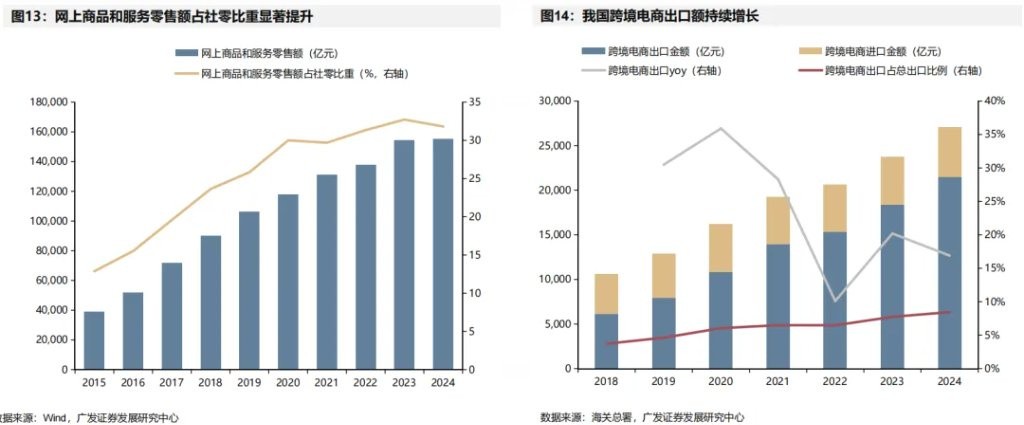
On one hand, in recent years, online shopping (mainly in the form of live streaming) has rapidly developed as a new sales channel, with the proportion of online goods and services retail sales continuously increasing.
On the other hand, the proportion of cross-border e-commerce export value in total exports has significantly increased. According to data from the General Administration of Customs, the proportion of cross-border e-commerce exports has risen from 3.73% in 2018 to 8.45% in 2024 Among the export destinations, the United States (37.4%), the United Kingdom (8.7%), Germany (4.7%), Russia (4.6%), and France (3.7%) together account for nearly 60% of the total cross-border e-commerce export value. Emerging markets such as Thailand (2.5%), Vietnam (2.4%), Malaysia (2.4%), and Australia (2.1%) are active and represent potential directions for future growth in cross-border e-commerce exports.
(3) Investment Driving Force [GARP Strategy Model]: A Cost-Effective Option Between Value and Growth
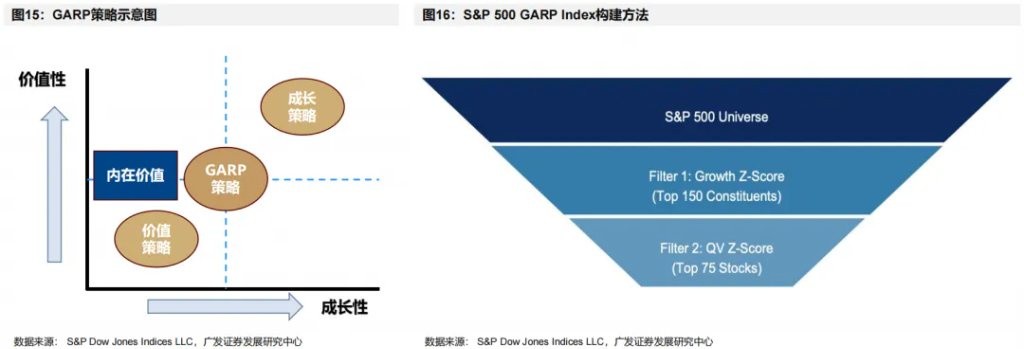
The GARP (Growth At a Reasonable Price) strategy lies between value investing and growth investing, identifying stocks that are "reasonably valued + have growth potential" through indicators such as PEG, balancing safety margins and long-term returns. According to behavioral finance theory, investor sentiment (overly optimistic or overly pessimistic), herd behavior, and excessive focus on short-term performance can lead to a divergence of high-quality growth stocks from their intrinsic value, providing opportunity windows for the GARP strategy.
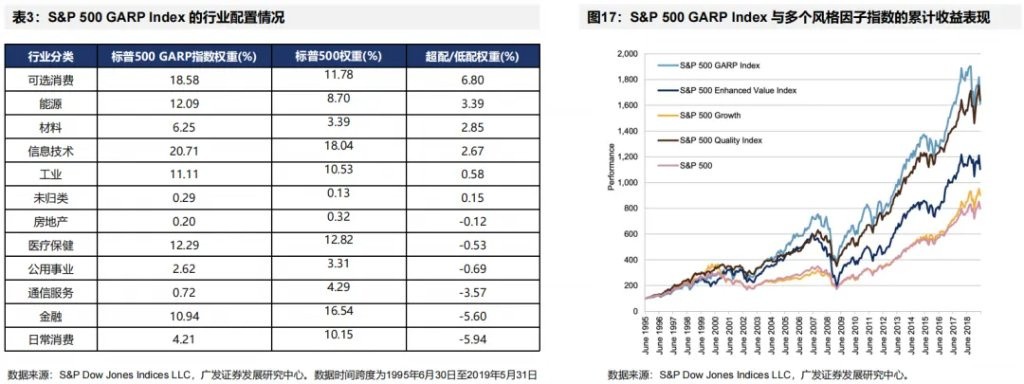
Taking the S&P 500 GARP Index in the United States as an example, it employs a multi-factor sequential screening method. First, it selects the top 150 companies based on the Z-score of three-year earnings per share (EPS) and sales growth rate (Growth Z-Score) from the S&P 500 index constituents. Then, it further screens the top 75 companies based on a comprehensive "quality + valuation" factor scoring (such as ROE, leverage, PE, etc.) to form the final components of the GARP strategy index.
According to S&P Dow Jones Indices LLC, the S&P 500 GARP Index is significantly tilted towards the consumer sector in its industry allocation, with a combined weight of over 20% in discretionary and staple consumer goods, covering globally competitive brand companies such as Procter & Gamble, Coca-Cola, and Costco, which generally exhibit typical GARP characteristics such as stable profitability, strong cash flow, reasonable valuation, and steady growth.
In the context of low economic growth, market volatility, and rising uncertainty, GARP portfolios centered on consumer stocks have shown the ability to consistently outperform the market. According to data from S&P Dow Jones Indices LLC, from 1995 to 2019, the S&P 500 GARP Index, despite experiencing market adjustments such as the financial crisis, has demonstrated a faster recovery speed and smoother return curve compared to growth or value styles, showcasing stronger α acquisition ability in volatile markets. This experience in the U.S. market holds significant reference value for the current structurally adjusting A-share consumer sector—under an environment of macro pressure and differentiated risk preferences, leading consumer companies that combine growth potential with reasonable valuation are expected to become the core direction for capital allocation, and the applicability and effectiveness of the PEG strategy are likely to be further highlighted
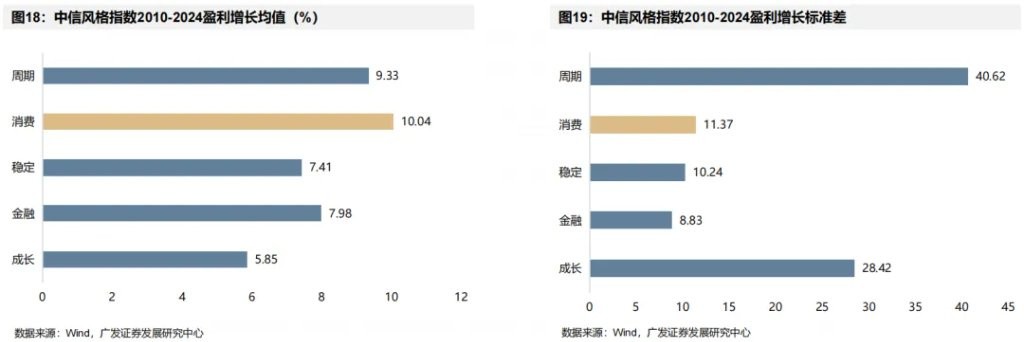
We believe that the consumption style aligns best with the GARP strategy's emphasis on "reasonable valuation + stable growth" stock selection logic, especially in sectors such as fast-moving consumer goods, beauty, and pet food, which exhibit stable growth, predictable profitability, sustained high ROE, and lower leverage risk. This makes consumer stocks more likely to pass through dual filtering in index construction and enter the final GARP investment portfolio. In contrast, the technology growth sector experiences significant profit volatility and high valuation elasticity, while cyclical industries are heavily influenced by macro factors and lack sustainable growth, making them more likely to be excluded from the GARP strategy.
From a quantitative perspective, using the CITIC style index as a sample, we can further verify the strong matching degree of the consumption style by statistically analyzing the mean and standard deviation of annual net profit growth rates from 2010 to 2024 across various styles: According to Wind statistics, the average profit growth rate of the consumption style index reaches 10.04%, ranking first among all styles, reflecting good long-term growth potential; at the same time, the standard deviation is only 11.37%, far lower than that of cyclical (40.62%) and growth styles (28.42%), indicating that the consumption sector maintains growth while exhibiting stronger stability and resistance to volatility.
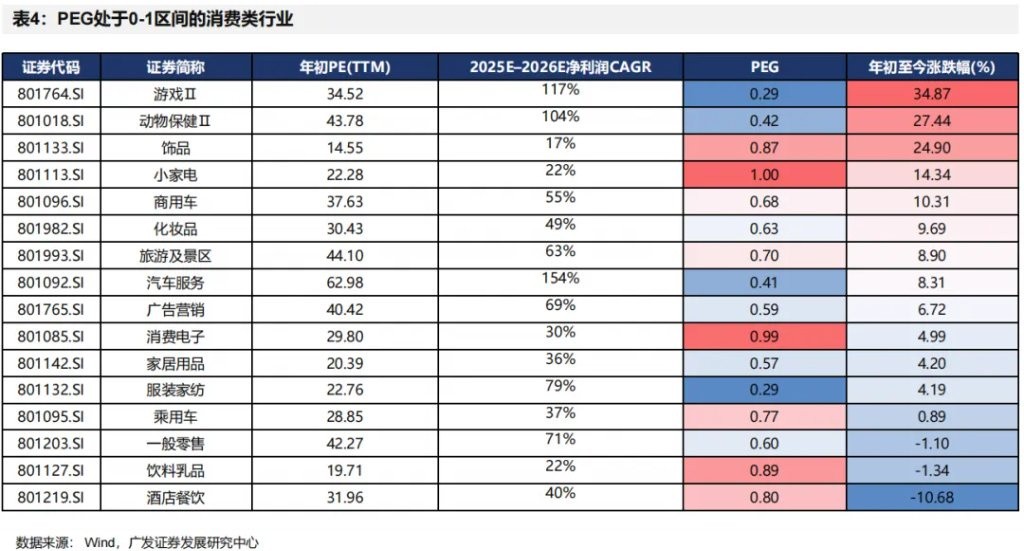
In addition, at the Shenwan secondary industry level, the GARP valuation strategy centered on PEG has shown certain screening effectiveness in index returns from the beginning of the year to date: several consumer sub-industries with PEG in the range of 0-1 have performed well since the beginning of the year, such as Gaming II (PEG=0.29, increase of 34.87%), Animal Health (PEG=0.42, increase of 27.44%), and Cosmetics (PEG=0.63, increase of 9.69%), combining reasonable valuation with growth, outperforming the market.
II. Five Major Overseas Experiences in New Consumption Investment
(1) Overseas Experience One [United States]: Consumer Stocks Have Long Bull Attributes
Outstanding companies in the consumer industry align well with Buffett's value investment logic, which includes: a strong brand moat that builds competitive barriers; a light asset model (maintenance capital expenditure less than depreciation) driving high capital return rates; rigid demand leading to stable cash flow with weak cyclicality, supporting dividends and reinvestment; leading companies achieving long-term compound growth through brand premiums and economies of scale; and possessing pricing power (ability to raise prices). According to data from Jeremy J. Siegel's "The Future for Investors," the top 20 "survivor" companies in the S&P 500 from 1957 to 2003 were highly concentrated in the consumer goods, retail, and pharmaceutical sectors, fully reflecting the long-term resilience of consumption

(2) Overseas Experience Two [France]: The Long-term "Moat" of Consumer Stocks Lies in Pricing Power
According to Bain & Company, 72% of companies fall into the death spiral of "the more they lower prices, the more they lose," highlighting the fatality of lacking pricing power. As the core of brand moat, strong pricing power directly determines the stability of long-term profitability and is the foundation for reconstructing profit patterns. The ROE of leading consumer companies highly relies on profit margins, and the continuous improvement of gross margins is empirical evidence of pricing power: taking Hermès as an example, according to Wind statistics, its products have an annual price increase of about 7%, yet consumer demand remains unchanged, the prices in the second-hand market remain high, and the sales gross margin continues to rise, driving the sales net profit margin to stabilize and rise.

(3) Overseas Experience Three [Japan]: The "Lipstick Effect" Characteristics in the Beta Downturn Cycle
Since the 1990s, Japan's consumption structure evolution has shown "differentiation in downgrading": expenditures on functional/convenient/self-indulgent categories such as healthcare, ready-to-eat food, and beauty products have steadily increased, while expenditures on discretionary durable goods such as dining out, furniture, and clothing have significantly shrunk. This "non-tightening downgrade" is essentially a restructuring of expenditure—consumers are shifting towards high-cost-performance necessities and emotional value products, giving rise to the emergence of new leading companies such as Uniqlo (affordable basics), Matsumoto Kiyoshi (drugstore chain), and Wacoal (comfortable lingerie).

According to Wind statistics, Japanese companies focusing on functional, convenient, and self-indulgent categories, such as Asahi (beer), Shiseido (beauty), Kikkoman (soy sauce), and Fast Retailing (Uniqlo), have all traversed economic cycles with high-cost-performance product strategies, showing a steady upward trend in stock prices, confirming structural resilience in weak cycles.

In addition, according to the results of the Kleiner Perkins consumer products survey, during economic hardships, the sales of Japan's "lipstick" industry tend to increase. Despite the slowdown in GDP and CPI growth, the alcohol and beauty sectors are counter-cyclical growth industries: between 1990 and 2000, the demand and output value of low-cost consumer goods represented by these two sectors grew, confirming consumer behavior characteristics of turning to high-cost-performance small expenditures during economic downturns.
 (4) Overseas Experience Four [Japan]: Brand Expansion Opens Profit Margin Boundaries
The acceleration of cosmetics going overseas has created a new growth engine for Japan. According to the Ministry of Finance's trade statistics, export value increased from 28 billion yen in the 1990s to 56 billion yen, with a CAGR of over 8%. From 2014 to 2021, the growth rate surged to over 20%. This "expansion in crisis" confirms that the overseas strategy effectively hedges against weak domestic demand, becoming a new engine for medium to long-term growth for enterprises, highlighting the strategic value of consumer brand globalization in countering local economic downturns.

Among them, Uniqlo, marked by an increase in overseas penetration, is a classic example of brand expansion. In 1998, Uniqlo became popular with its high-cost performance "fleece jacket" and began its globalization in 2001. According to data from Wind and Fast Retailing's annual report, as of 2024, there are over 2,500 stores worldwide. In the fiscal year 2024, Fast Retailing Group's total revenue reached 3.1 trillion yen, with overseas revenue accounting for more than half and growing at more than five times the rate of the domestic market, becoming the main profit engine for the group, demonstrating the effectiveness of its globalization strategy.

(5) Overseas Experience Five [US and Japan]: Penetration Rate Space Under the Time Machine
With the development of the times, people's consumption concepts and capabilities are constantly changing. The emerging product demands that arise may not be well-received by the market at their inception, but as their characteristics align with the prevailing consumption concepts and capabilities, market penetration rates will gradually rise over a long period. Taking the penetration rate of Japanese home appliances as an example, many new home appliances emerged in the 1970s, such as air conditioners and microwaves, which met consumer needs at the time, and the penetration rate continued to increase ten years after the products appeared.
The time mismatch of consumer varieties and demands can be found in forward-looking explanations in developed countries like the US and Japan. For instance, the penetration rates of medical beauty and pet care in China are significantly lower than those in developed countries. According to Hejun Consulting, China's medical beauty penetration rate is only 4.5% (Japan 11.3% / USA 17.2% / South Korea 22%).

3. Comparison of 9 Major Indicators for New Consumption Investment
The practical operation of new consumption investment needs to comprehensively consider dimensions such as penetration rate, prosperity, valuation, and consumption attributes. We have roughly summarized the following 9 major indicators to guide new consumption investment—
 (1) Indicator 1: [Overseas Revenue Proportion] Looking at Penetration Rate Space
The overseas revenue proportion reflects the company's overseas penetration rate. If a company's overseas revenue proportion continues to rise, it indicates that the company is continuously expanding abroad and increasing its penetration in the global market.
Leading new consumption enterprises are still at the intersection of "early growth + accelerated expansion," with the overseas revenue proportion continuously increasing. According to Wind statistics, the steps taken by the 潮玩 (trendy toys) and discount retail sectors to go overseas are leading, with POP MART's overseas revenue proportion rising from 23% in 2021 to 39% in 2024, and Miniso increasing from 4% to 39%, reflecting a strong alignment between its brand tone and global channel layout, demonstrating strong external replication capability. Although categories like accessories and food and beverages started later, some leading enterprises are gradually achieving breakthroughs overseas, releasing a new round of growth potential.

(2) Indicator 2: [Earnings Forecast Upgrade] Looking at Changes in Prosperity
The degree of earnings forecast upgrades indicates expectations of prosperity. During non-financial report disclosure periods, the market makes slight adjustments to earnings forecasts based on significant company events; however, after the release of quarterly and annual reports, the market systematically adjusts earnings forecasts based on the financial data disclosed in the reports and management guidance to reflect the latest fundamental expectation information. Focusing on these key financial report release points, observing the direction of earnings forecast adjustments at the individual stock or index level, if earnings forecasts continue to be upgraded, it indicates that the prosperity expectations for that target/field are rising.
The current market generally expects good profitability in the new consumption sector in the future. According to Wind statistics, on one hand, earnings forecasts in the new consumption sub-sectors have been continuously upgraded this year; on the other hand, the forecast compound annual growth rate for new consumption sub-sectors from 2025 to 2027 is basically over 20%, indicating that the market generally expects stable growth potential in the new consumption sector.

(3) Indicator 3: [Fund Positioning Overweight] Looking at Institutional Fund Preferences
The overweight areas of public funds indicate the main line of market institutions. If a certain area is increased by public funds and the overweight ratio continues to be positive, it indicates that institutional funds are flowing into that area, and institutions generally have a positive outlook on that area.
Most new consumption sub-sectors have shown a significant upward trend in the overweight ratio of public funds from 2024 to the present, with the pet food, beauty and personal care, and gold sectors reversing from negative to positive overweight ratios. In addition, in absolute terms, the current overweight ratio of public funds in most new consumption sectors is relatively low, indicating significant room for growth.
 (4) Indicator 4: [Transaction Amount Proportion] Observing Crowding Sentiment
Crowding shows the current market capital sentiment's intensity. The proportion of transaction amounts in a certain field to the total market transaction amount can reflect the current market sentiment towards that field. If the current transaction amount proportion percentile is at a historical high, it indicates that the crowding in that field is high, and the market sentiment is overheated, signaling trading risks.
Since March this year, the market sentiment for new consumption has been on the rise, peaking in late June. According to Wind data, as of July 31, 2025, the transaction amount proportion percentile for the new consumption stock pool over the past year is 76.7%, still at a historical high.

(5) Indicator 5: [PEG Scatter Plot] Observing Valuation Margin of Safety
The PEG indicator links a stock's valuation with its earnings growth potential for a comprehensive assessment, helping investors determine whether the stock price is reasonable relative to its growth. By depicting the PEG scatter plot, one can comprehensively assess the matching of valuation and growth among different companies. If a company's PEG < 1, it is generally considered more attractive, indicating that the current price-to-earnings ratio is low relative to its growth potential, providing high investment value.
Using the PEG indicator, a horizontal observation of the valuation and growth status of some mainstream new consumption targets as of the end of July reveals a certain differentiation in PEG status among companies in the new consumption sector. According to Wind statistics, the current PEG of companies like XGIMI Technology, Cha Baidao, Chao Hongji, and Laopu Gold is below 1, indicating strong profit growth expectations based on moderate valuations, exhibiting typical "reasonable valuation + stable growth" GARP characteristics; in contrast, companies like Yuchen and Guai Bao Pet have PEG significantly above 1, mainly due to low profit bases or currently high valuations, with growth logic not yet fully validated. Overall, PEG helps identify quality targets in the new consumption sector that have relatively matched valuation and growth, providing effective decision-making basis for long-term allocation in the new consumption sector.

(6) Indicator 6: [Gross Margin Curve] Observing Pricing Power
Gross margin is one of the most intuitive and important financial indicators for measuring a company's pricing power. A high and stable or continuously increasing gross margin usually indicates that the company has the ability to pass cost pressures onto customers, charge premiums for products, maintain price stability in competition, and achieve price increases through product upgrades.
**In most sub-sectors of new consumption, gross margins are maintained at over 30%, indicating that corresponding targets have certain pricing power. According to Wind statistics, the gross margins in the fields of medical beauty, blind boxes, and yellow wine show an upward trend, with companies' profitability rising while pricing power is also steadily increasing, with the median gross margin in the medical beauty sector reaching 92% in 2024. Additionally, in recent years, fields such as AI glasses, smart home, and low-end tea drinks have maintained stable gross margins, although there has not been a significant increase, they are generally around 30%-60% **

(7) Indicator 7: [Second-hand Premium Rate] Looks at Financial Attributes
The second-hand premium rate reflects the product's value retention and embodies its financial attributes. If the product's value retention rate is high, its collectible value will exceed its functionality, possessing certain financial attributes, from which investors may benefit.
According to statistics from the POP MART mini program, Qiandao, Taobao's old gold specialty cabinet, and Xianyu data on July 4, old gold (second-hand discount rate <20%) and POP MART (inverted premium) show a value retention capability that surpasses overseas luxury goods. Comparing with Rebag data: Goyard value retention rate 104%, Hermès 100%, Chanel 92%, LV 88%, highlighting its strong anti-inflationary nature and high liquidity. Such products already possess significant financial attributes, becoming high-quality targets for counter-cyclical investment.

(8) Indicator 8: [Repurchase Rate] Looks at Addictive Attributes
The repurchase rate represents the long-term prosperity of the industry. If the industry/company has a high repurchase rate, it indicates a certain level of addictiveness and high user stickiness; a high repurchase rate often suggests that the sector can maintain a high level of prosperity in the future.
POP MART and old gold achieve high repurchase through differentiated membership operations. POP MART relies on the blind box mechanism (hidden item scarcity + social currency attributes) to stimulate consumers' "gambling psychology." According to Wind and POP MART annual report data, the repurchase rate reaches 50.7%, with members contributing 93.1% of sales; according to old gold's annual report data, its luxury pricing, price increase expectations, and high-net-worth member services (350,000 members contribute 60% repurchase) create strong customer stickiness. Both have become high-quality investment targets in a weak cycle due to their high repurchase rates.

(9) Indicator 9: [Usage Frequency] Looks at Necessity Attributes
Consumption frequency reflects the necessity of the product. If the usage frequency and purchase frequency of the product are high, it indicates that it is relatively essential in life and has the ability to transcend economic cycles.
**The consumption frequency of new-style tea drinks and cosmetics in China has already shown high necessity attributes. According to iiMedia Consulting data, 65.3% of consumers purchase tea drinks 2-3 times a month, and 41.1% of users use cosmetics 3-5 times a week, with this frequency showing an upward trend. The deep entrenchment of consumption habits will drive the penetration rate to continue rising, indicating a dual growth leverage of expanding incremental customer groups and increasing single customer value. When the penetration rate breaks through the critical point, the industry will usher in explosive growth in performance, forming a positive cycle of "high-frequency consumption → penetration rate leap → scale effect strengthening," highlighting its long-term investment value **

IV. Investment Strategy: "Top-Down" New Consumption Selected Stock Pool
Based on the comprehensive comparison of nine major indicators including penetration rate space, prosperity, valuation, chip, pricing power, and new consumption attributes mentioned above, we have selected a new consumption stock pool with α investment value, focusing on areas such as blind box trendy toys, low-end tea drinks, beauty products, and pet food.
Authors of this article: Liu Chenming, Zheng Kai, Ni Gen, Source: Chenming's Strategic Deep Thinking, Original Title: "[Guangfa Strategy] Future Necessities: New Consumption Guidance - Large Consumption Research Framework Series (2)"
Risk Warning and Disclaimer
The market has risks, and investment should be cautious. This article does not constitute personal investment advice and does not take into account the specific investment goals, financial situation, or needs of individual users. Users should consider whether any opinions, views, or conclusions in this article are suitable for their specific circumstances. Investment based on this is at one's own risk