
 I'm LongbridgeAI, I can summarize articles.
JP Morgan analysis warns that if the S&P 500 index breaks through the three support levels of 6700, 6631, and 6525 points in succession, it will confirm a downward trend. Meanwhile, the Russell 2000 index, which represents small-cap stocks, has shown a "most concerning" breakdown pattern. If key support levels are fully breached, the market adjustment may continue until early 2026. At the same time, the leading sector led by AI is experiencing pullback pressure, with signs of funds rotating into sectors such as healthcare
The U.S. stock market is at a critical technical crossroads, with bullish determination facing severe tests.
According to news from the Wind Trading Desk, the latest technical strategy report released by JP Morgan on November 14 shows that the support levels of several key indices in the U.S. stock market are under continuous pressure. If these "defensive lines" are broken, it will confirm that the market has entered a downward trend, with adjustments potentially lasting until early 2026.
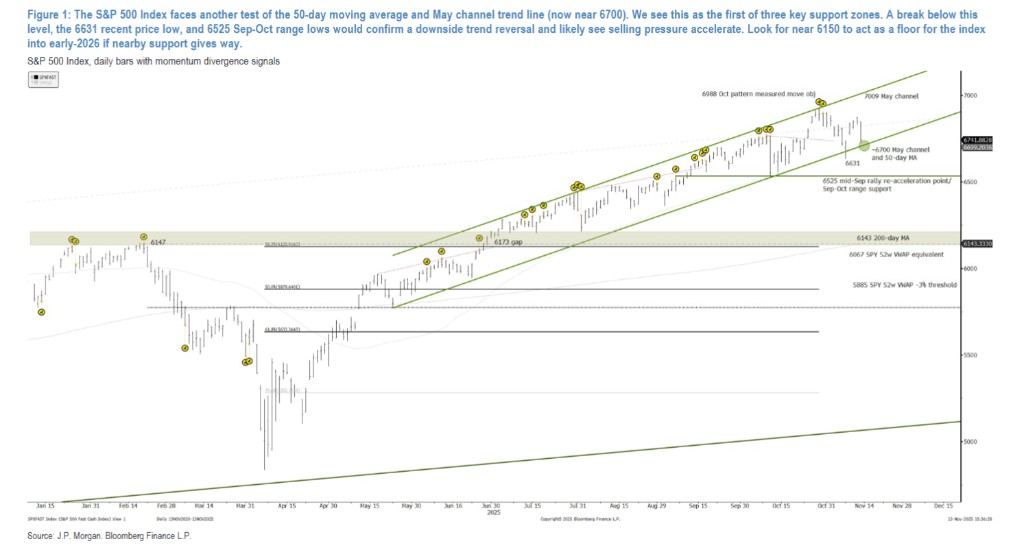
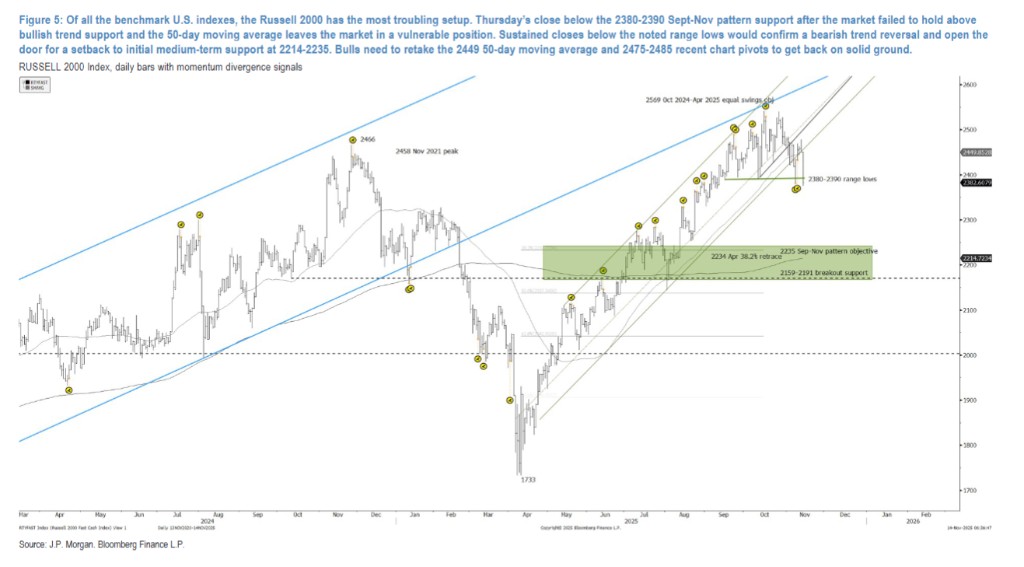
Among them, the S&P 500 index is testing the first support level around 6700 points. If this level, the recent low of 6631 points, and the range low of 6525 points are consecutively breached, it will confirm a bearish trend reversal, with a downward target near 6150 points. Among all benchmark indices, the technical pattern of the Russell 2000 index is "the most concerning," having broken through key pattern support, confirming the reversal of the bearish trend and opening up space for further adjustments.
S&P 500 Index: Three Key Defensive Lines Under Test
The report points out that the S&P 500 index, as a market barometer, is facing a test of three layers of key support zones.
The first defensive line is the 50-day moving average and the channel trend line since May, currently located around 6700 points. If this level is breached, the market will continue to test the second defensive line—the recently established price low of 6631 points. The final key defensive line is the range low of 6525 points from September to October.
Analyst Jason Hunter believes that only when all three defensive lines are broken can it be confirmed that the market has entered a downward trend reversal. At that time, selling pressure may accelerate, and the potential bottom for the index may be around 6150 points, which could become the market's bottom before early 2026.
Russell 2000 Index: The Most Concerning Technical Pattern
Among all U.S. benchmark indices, the Russell 2000 index, representing small-cap stocks, exhibits the "most concerning" technical pattern. The report emphasizes that this index closed below the 2380-2390 point support level from September to November last Thursday, having previously failed to hold the bullish trend support and the 50-day moving average.
This series of breakdowns puts the market in a very fragile position. The report suggests that if it continues to close below the aforementioned range low, it will confirm the reversal of the bearish trend and open the door for the market to adjust to the mid-term support level of 2214-2235 points. For the bulls, it is essential to reclaim the 50-day moving average at 2449 points and the recent chart pivot point at 2475-2485 points to regain a foothold.
AI Leadership Sector Under Pressure, But Not Fully Broken
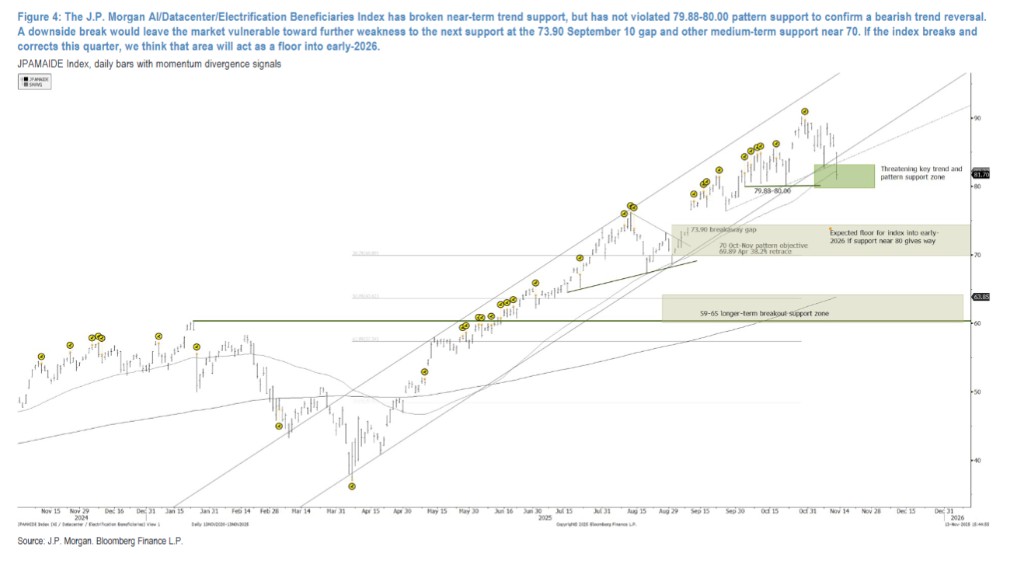
The market leader this year—the AI concept stocks—are also under pressure. The "JP Morgan AI/Data Center/Electrification Beneficiaries Index" in the report has already broken through the short-term trend support but has not yet breached the key pattern support level of 79.88-80.00 points, so the bearish trend reversal has not been confirmed However, once this key support level is broken down, the market will become vulnerable and may further weaken to the next support level, which is the gap of 73.90 points left on September 10 and the mid-term support around 70 points. The report predicts that if the index breaks and corrects this quarter, the 70-73.90 area may become its bottom before early 2026.
Signs of Market Rotation: Funds Flow into Healthcare, but Materials Sector Faces Resistance
As leading sectors like AI come under pressure, signs of fund rotation have emerged in the market. The recent strong performance of equal-weight indices like the S&P 500 is an example. However, the index also shows signs of weak upward momentum, with its key structural support level in the 7500-point area.
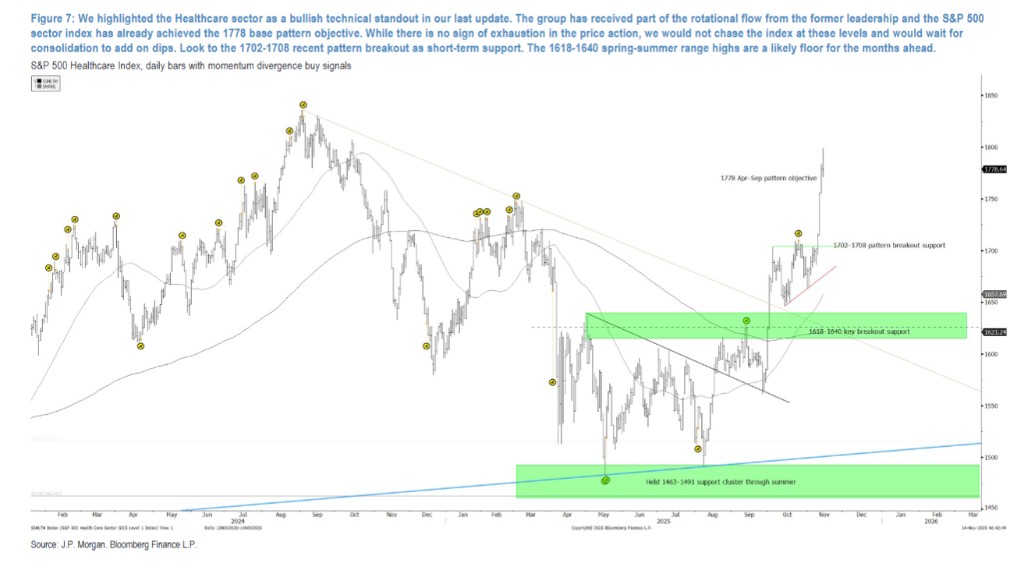
The report points out that the healthcare sector is a highlight in the rotation, attracting some funds flowing out from previous leading sectors, with its industry index reaching the target of 1778 points. However, analysts suggest not to chase high at current levels but to wait for consolidation to buy on dips.
Meanwhile, the materials sector has also attracted some rotating funds, but its industry index's rebound has brought it into the key resistance zone of 555-563 points. If it cannot break through this area, the sector's weak technical structure will remain unchanged, and if it falls below 540 points, it may further drop to the mid-term support of 511-518 points.
The above exciting content comes from [ZhuiFeng Trading Platform](https://mp.weixin.qq.com/s/uua05g5qk-N2J7h91pyqxQ).
For more detailed interpretations, including real-time analysis and frontline research, please join the【 [ZhuiFeng Trading Platform ▪ Annual Membership](https://wallstreetcn.com/shop/item/1000309)】
[](https://wallstreetcn.com/shop/item/1000309)