Company Encyclopedia
View More

MSCI
MSCI.US
MSCI Inc., together with its subsidiaries, provides critical decision support tools and solutions for the investment community to manage investment processes worldwide. The Index segment provides indexes for use in various areas of the investment process, including indexed financial product, such as ETFs, mutual funds, annuities, futures, options, structured products, and over-the-counter derivatives; performance benchmarking; portfolio construction and rebalancing; and asset allocation, as well as licenses GICS and GICS Direct. The Analytics segment offers risk management, performance attribution and portfolio management content, application, an integrated view of risk and return service, and an analysis of market, credit, liquidity, counterparty, and climate risk across asset classes; managed services, including consolidation of client portfolio data, review and reconciliation of input data and results, and customized reporting; and HedgePlatform to measure, evaluate, and monitor the risk of hedge fund investments. The ESG and Climate segment provides products and services that help institutional investors understand how ESG impacts the long-term risk and return of their portfolio and individual security-level investments; and data, ratings, research, and tools to help investors navigate increasing regulation.
856.08 B
MSCI.USMarket value -Rank by Market Cap -/-
Valuation analysis

P/E
1Y
3Y
5Y
10Y
P/E
-
Industry Ranking
-/-
- P/E
- Price
- High
- Median
- Low
P/B
1Y
3Y
5Y
10Y
P/B
-
Industry Ranking
-/-
- P/B
- Price
- High
- Median
- Low
P/S
1Y
3Y
5Y
10Y
P/S
-
Industry Ranking
-/-
- P/S
- Price
- High
- Median
- Low
Dividend Yield
1Y
3Y
5Y
10Y
Dividend Yield
-
Industry Ranking
-/-
- Dividend Yield
- Price
- High
- Median
- Low
Institutional View & Shareholder
Analyst Ratings
- Price--
- Highest--
- Lowest--
News
View More
Posts
View More
MSCI will decide in mid-January whether to remove DAT represented by MSTR from the index. Now it has entered a critical game period. Last week, Strive, the asset management company owned by Vivik Rama...

$XTALPI(02228.HK) MSCI settlement at the end of the day today, who will deliver the goods? Trading volume continues to shrink. Interesting.
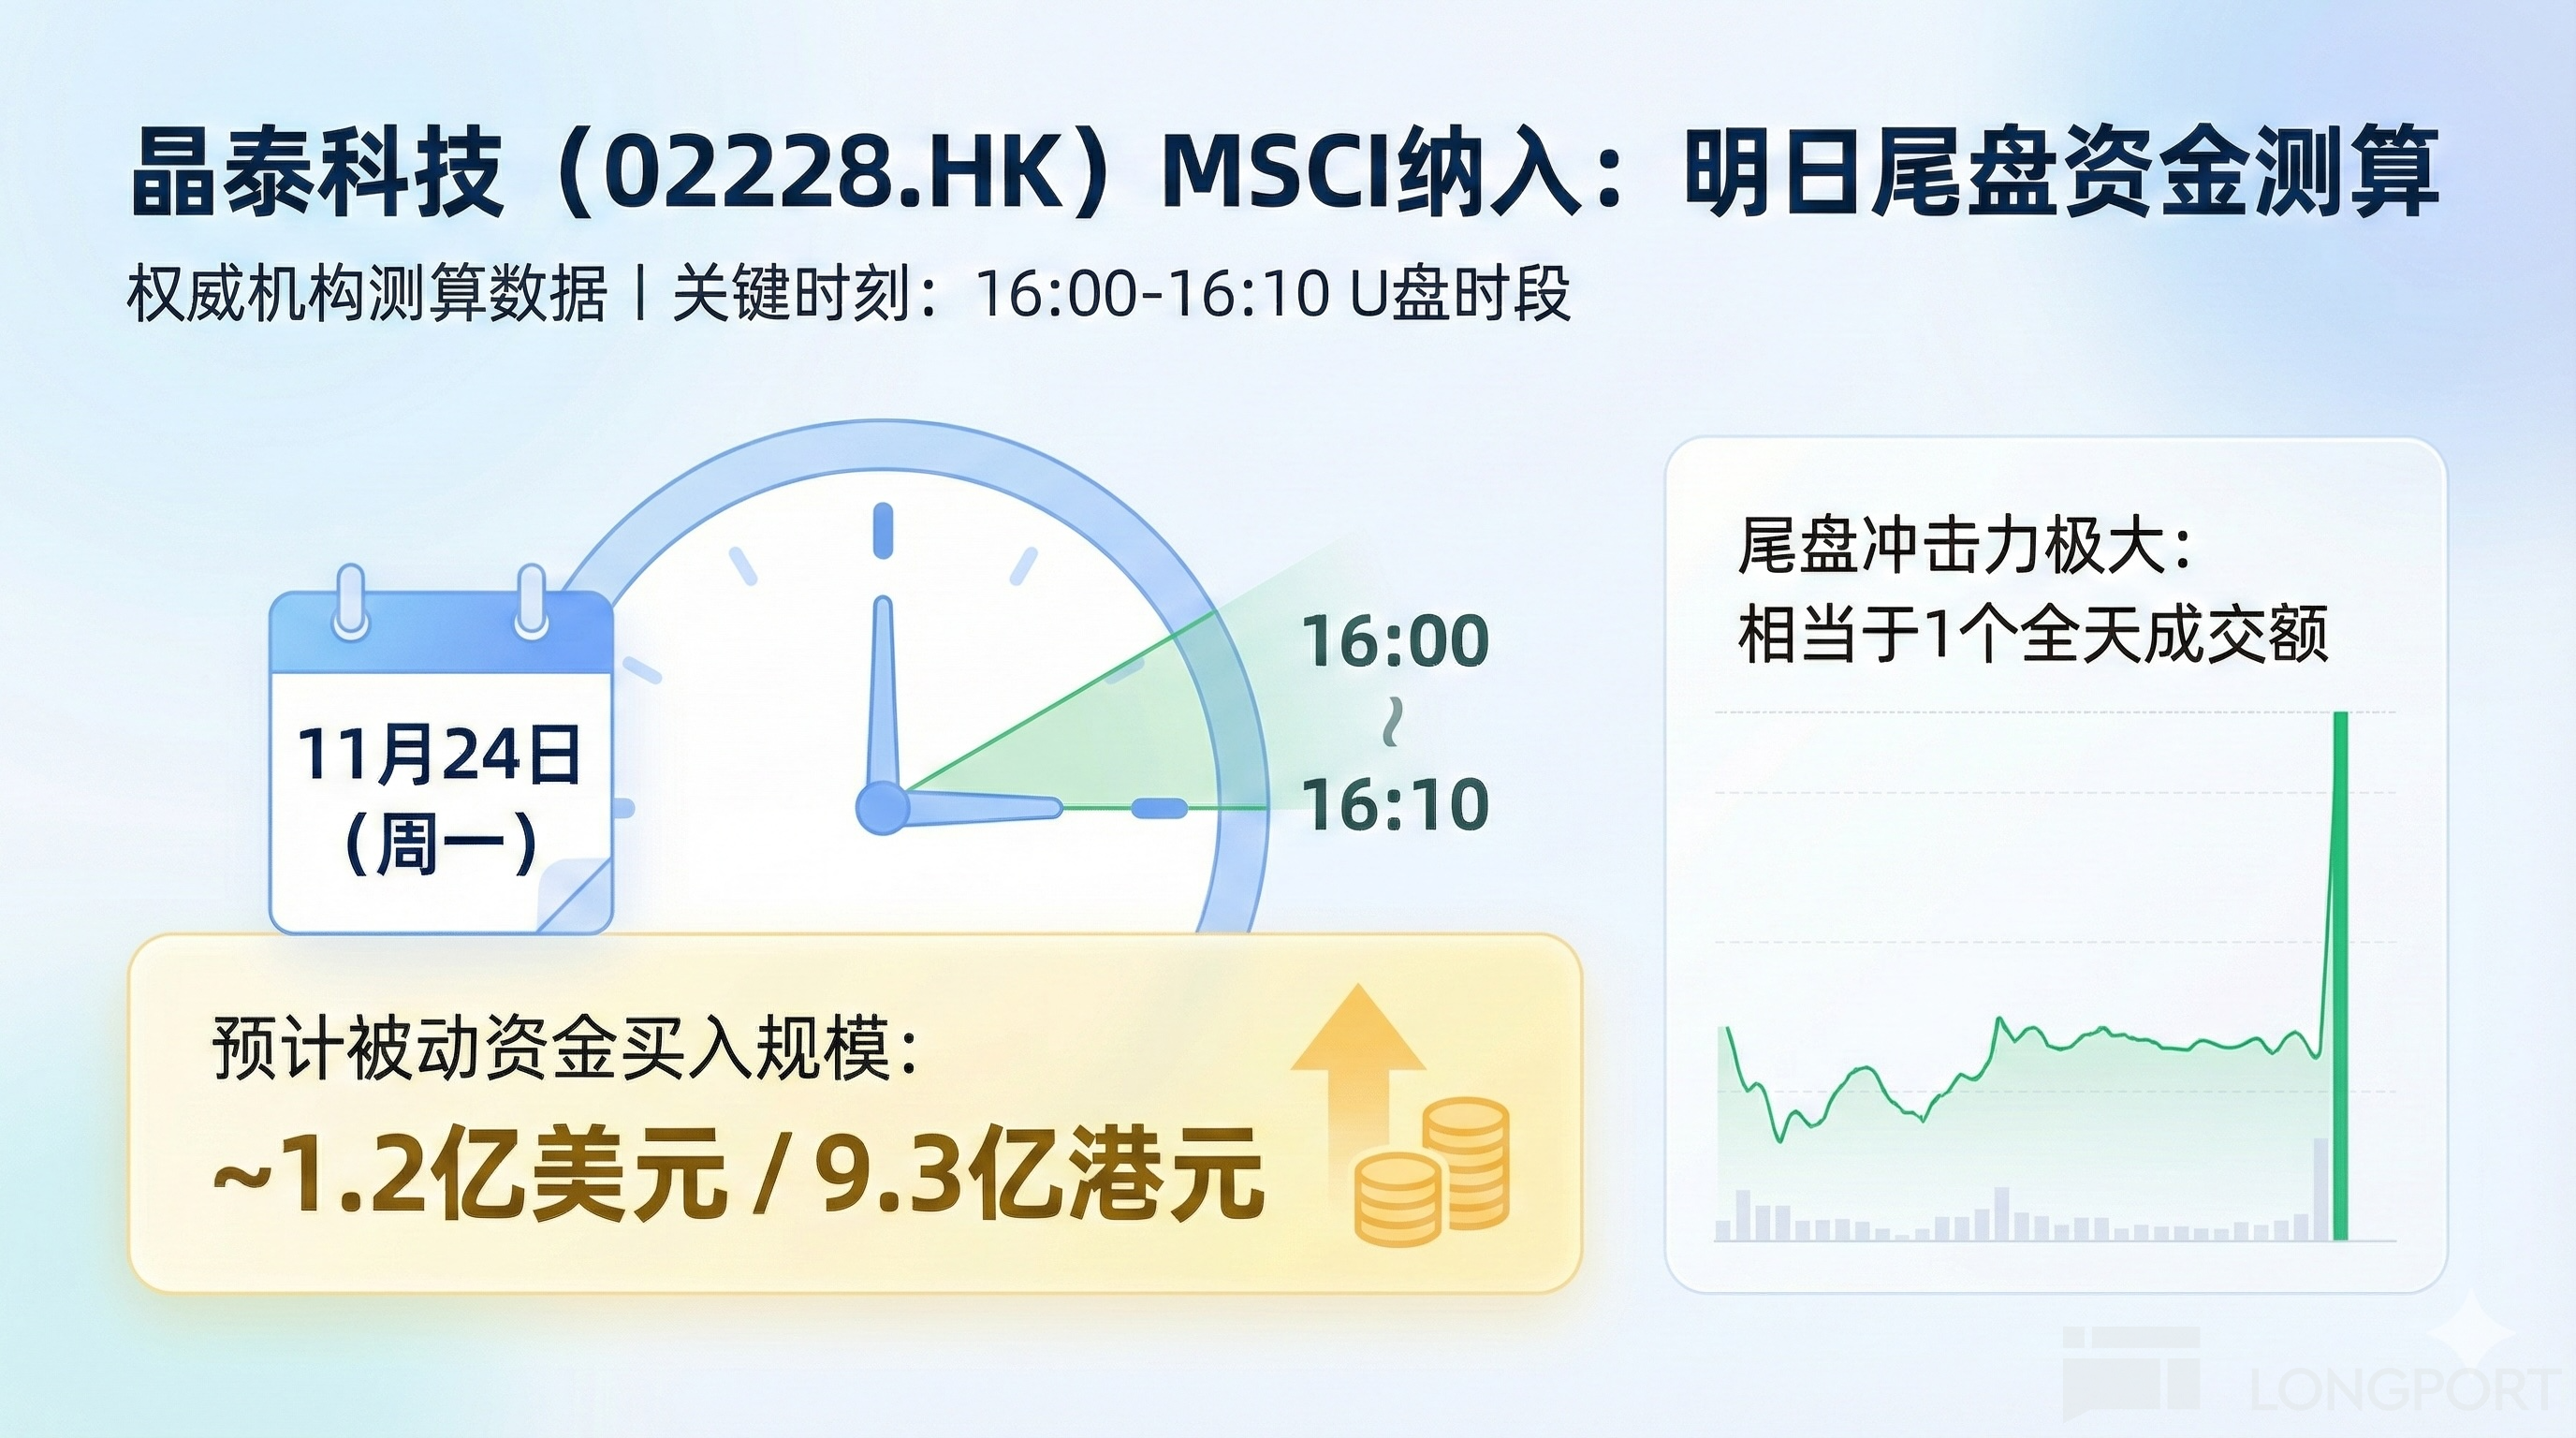
According to calculations by authoritative institutions such as CICC and historical data on MSCI index adjustments, the estimated scale of passive fund purchases for **Jingtai Technology (02228.HK)** ...
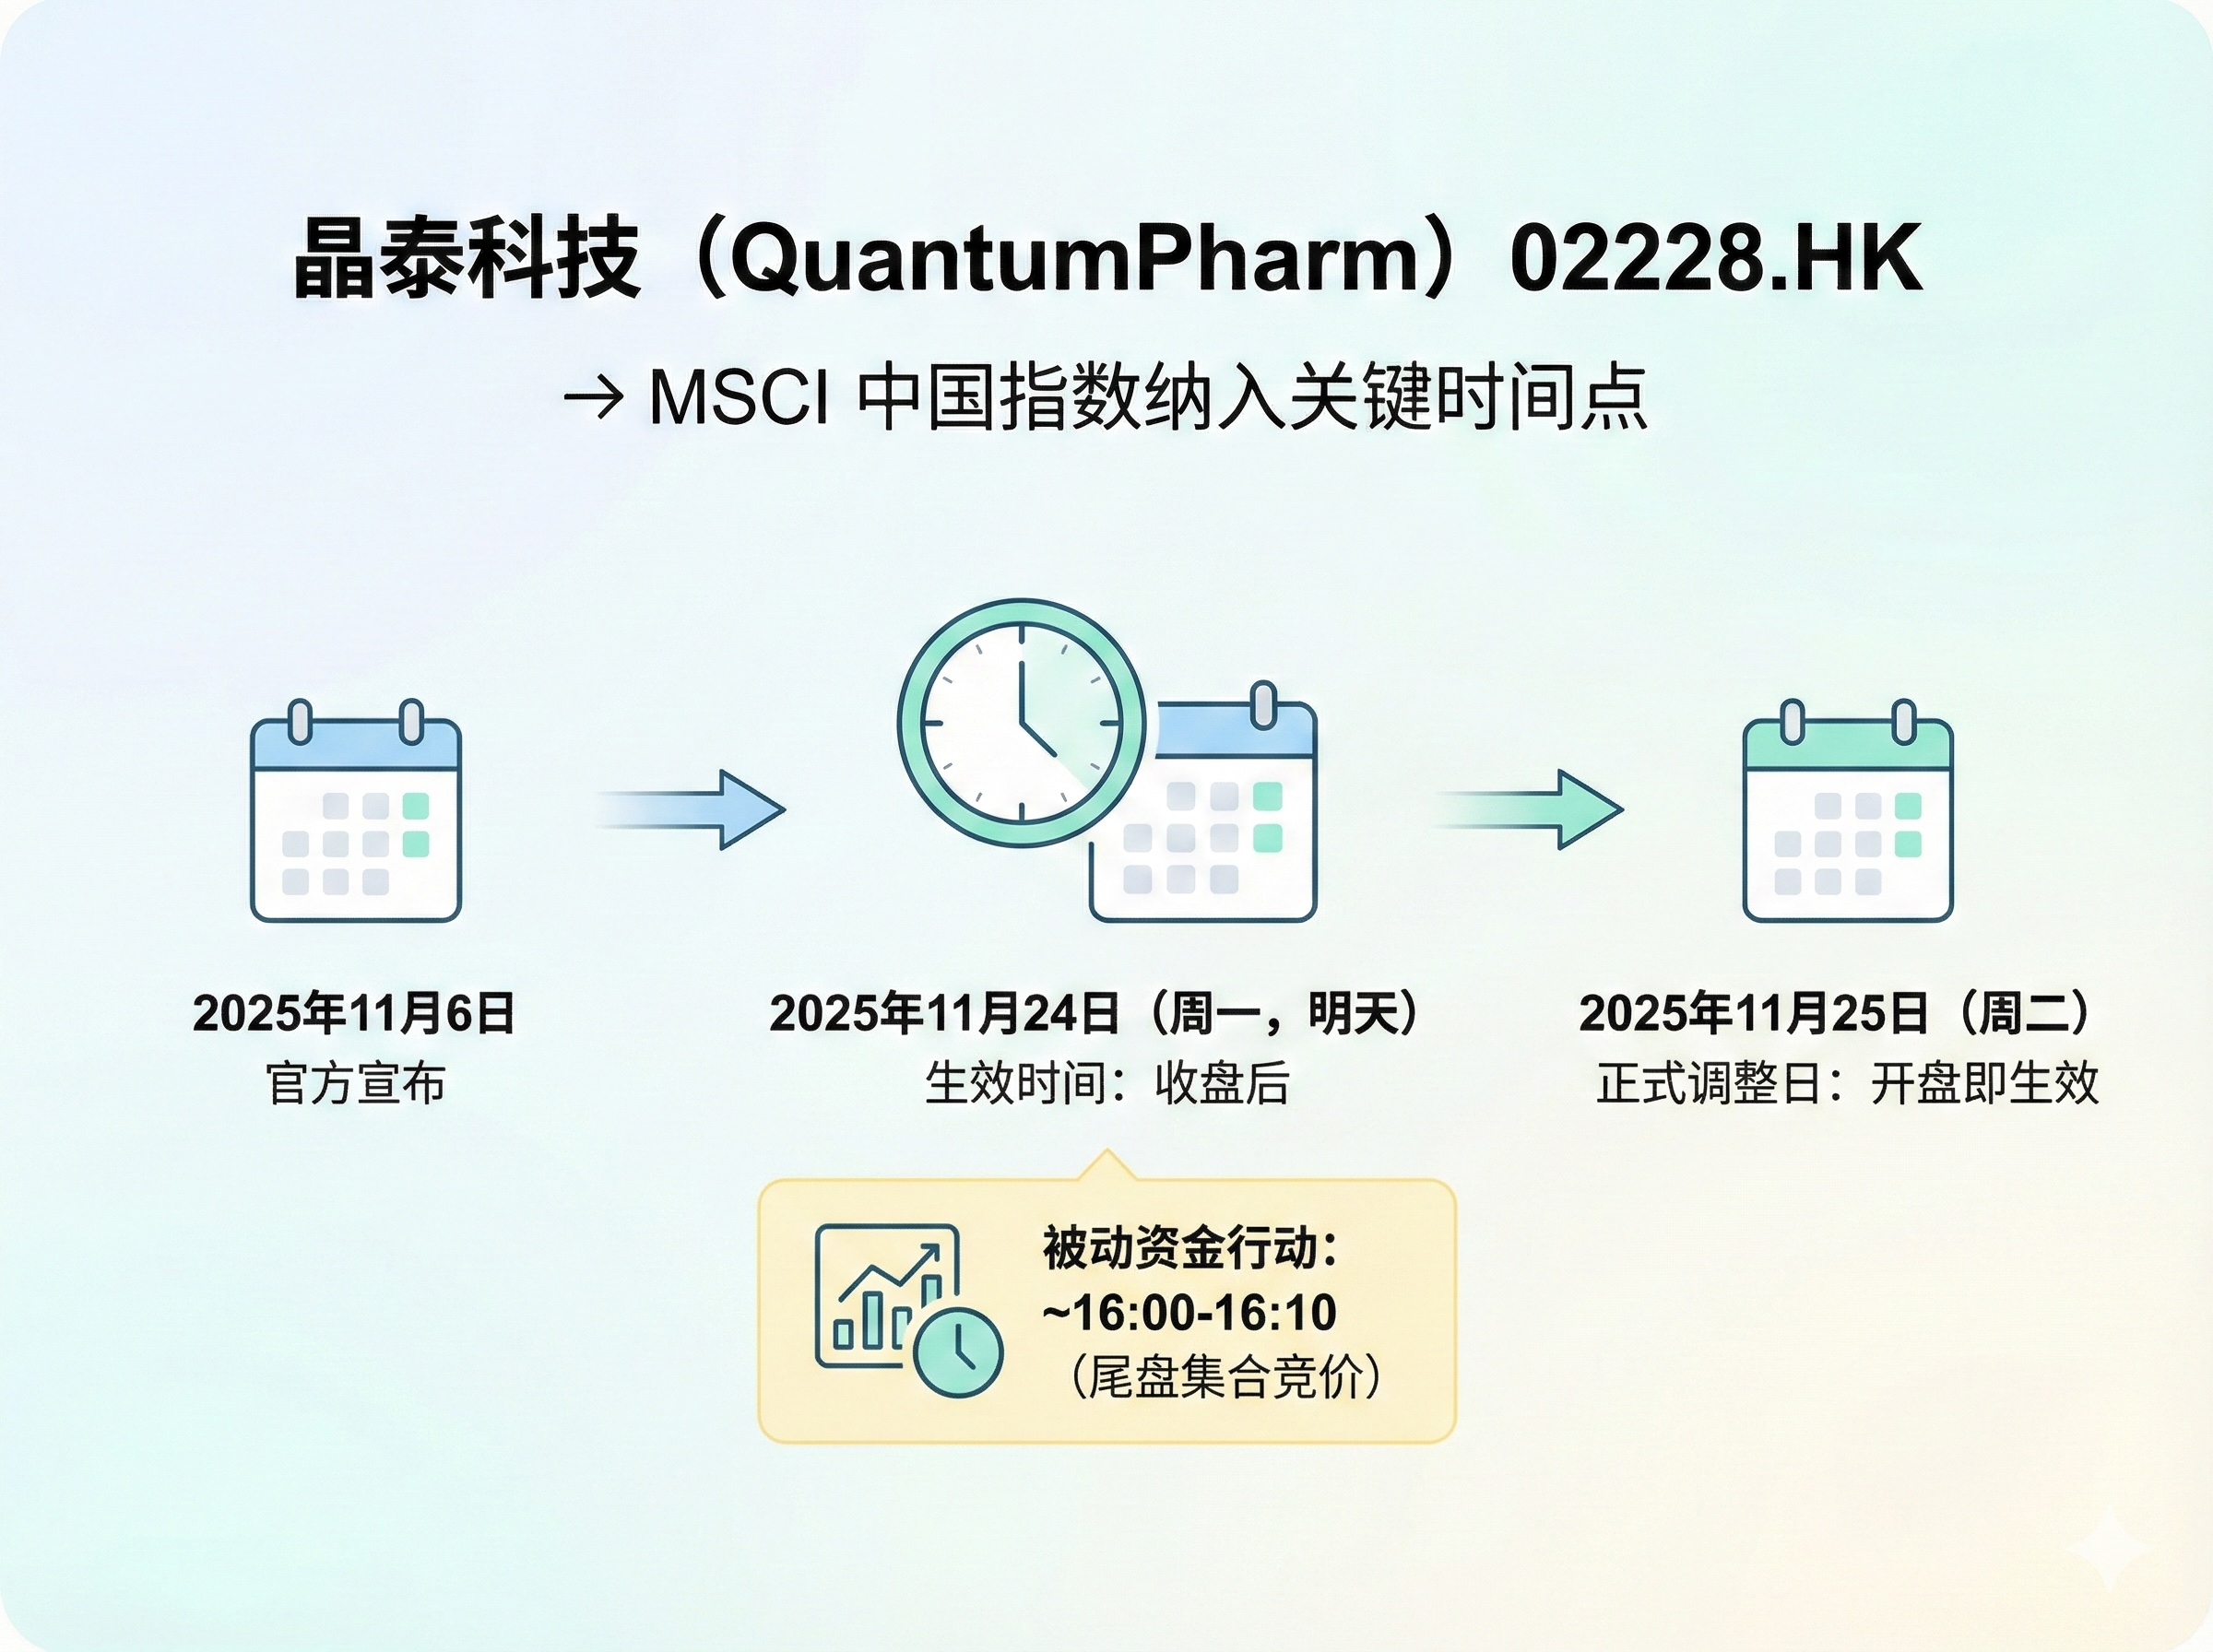
$XTALPI(02228.HK) According to the MSCI official announcement of the semi-annual index review results for November 2025, QuantumPharm (02228.HK) will be included in the MSCI China Index with the follo...