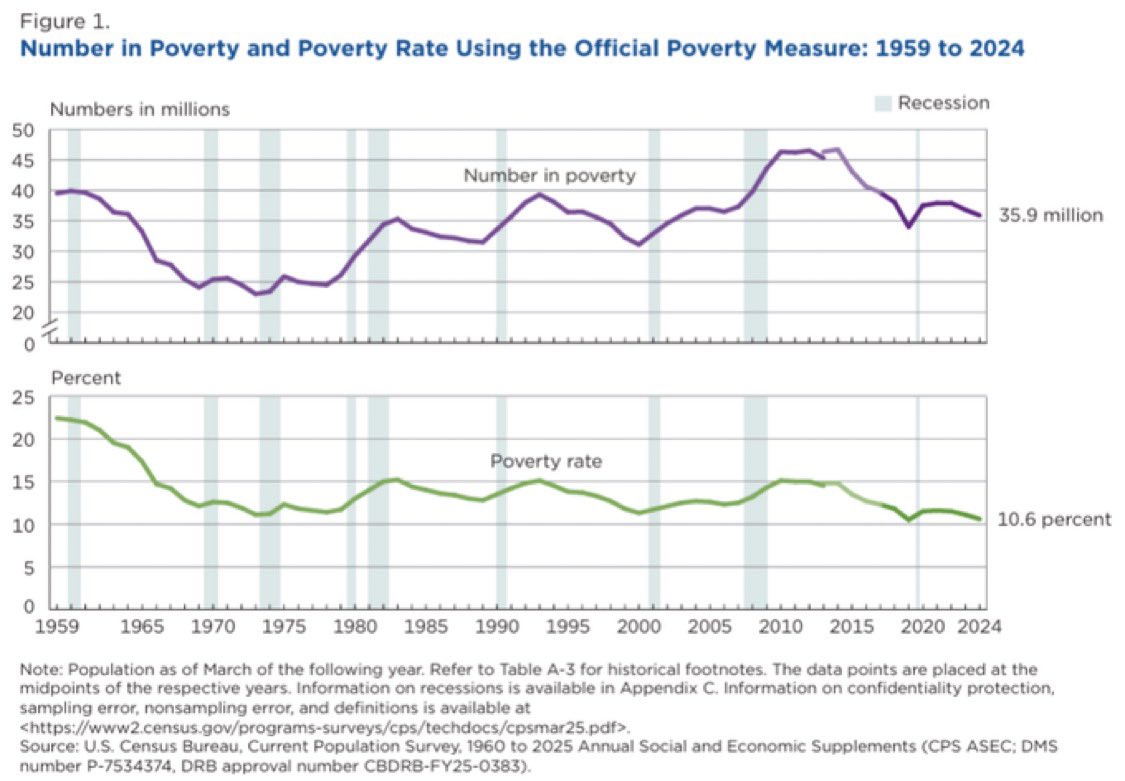
This chart tells the story of poverty in America across the last six decades. In 1959 more than 22 percent of Americans lived in poverty. By 2024 that share dropped to 10.6 percent. On paper the rate looks like real progress but look at the top half of the chart. The number of people in poverty has barely moved. Today it is still 35.9 million people .
Population growth explains the gap. The country has nearly doubled in size since the 1960s. Even if the percentage falls the raw headcount stays locked around 30 to 40 million.Recessions also stand out. Every gray bar shows a downturn. In each case the poverty line flattens or rises. The early 1980s. The Great Recession in 2008. The pandemic in 2020. The recoveries bring the rate down but never reset the baseline. Poverty stalls at a stubborn level and refuses to break lower.The Census data for 2024 show who is most affected. Children face a 14.3 percent poverty rate while working-age adults are at 9.6 percent and seniors at 9.9 percent. Under the Supplemental Poverty Measure seniors look worse off because medical expenses are subtracted from income pushing their poverty rate to 15 percent .Race and ethnicity reveal another divide. White and Asian households report the lowest rates around 7 to 9 percent. Black individuals face 18.4 percent. Hispanic individuals 15 percent. American Indian and Alaska Native groups 19.3 percent. These communities are overrepresented in the poverty population relative to their share of the overall population .Education draws an even sharper line. Adults without a high school diploma show a 23 percent poverty rate. Those with a bachelor’s degree or higher are at 4 percent. Work status matters as well. Full-time year-round workers almost never fall below the poverty line at 1.8 percent. Those who do not work are at 28.2 percent .The official poverty measure only counts pretax income. It ignores noncash benefits and taxes. The Supplemental Poverty Measure paints a different picture by including programs like SNAP, housing subsidies, and tax credits while subtracting costs like medical bills. In 2024 the official poverty rate was 10.6 percent but the SPM was higher at 12.9 percent .Programs play a huge role in shaping these numbers. Social Security kept nearly 29 million people out of poverty in 2024. Refundable tax credits like the Earned Income Tax Credit and Child Tax Credit lifted 6.8 million more. But medical expenses pushed 7.5 million into poverty under the SPM .The big picture is that the poverty rate looks far lower than it did in 1959 but the number of poor Americans remains massive. Recessions, rising costs, and population growth keep the problem locked in place. Safety net programs prevent poverty from being much worse but they also highlight how fragile progress really is.Source: StockMarket.News
The copyright of this article belongs to the original author/organization.
The views expressed herein are solely those of the author and do not reflect the stance of the platform. The content is intended for investment reference purposes only and shall not be considered as investment advice. Please contact us if you have any questions or suggestions regarding the content services provided by the platform.
