


Technical analysis for $Oiltek(HQU.SG) * Current Trend: The stock is in a medium-term downtrend after peaking at SGD 2.6…
Technical analysis for $Oiltek(HQU.SG)
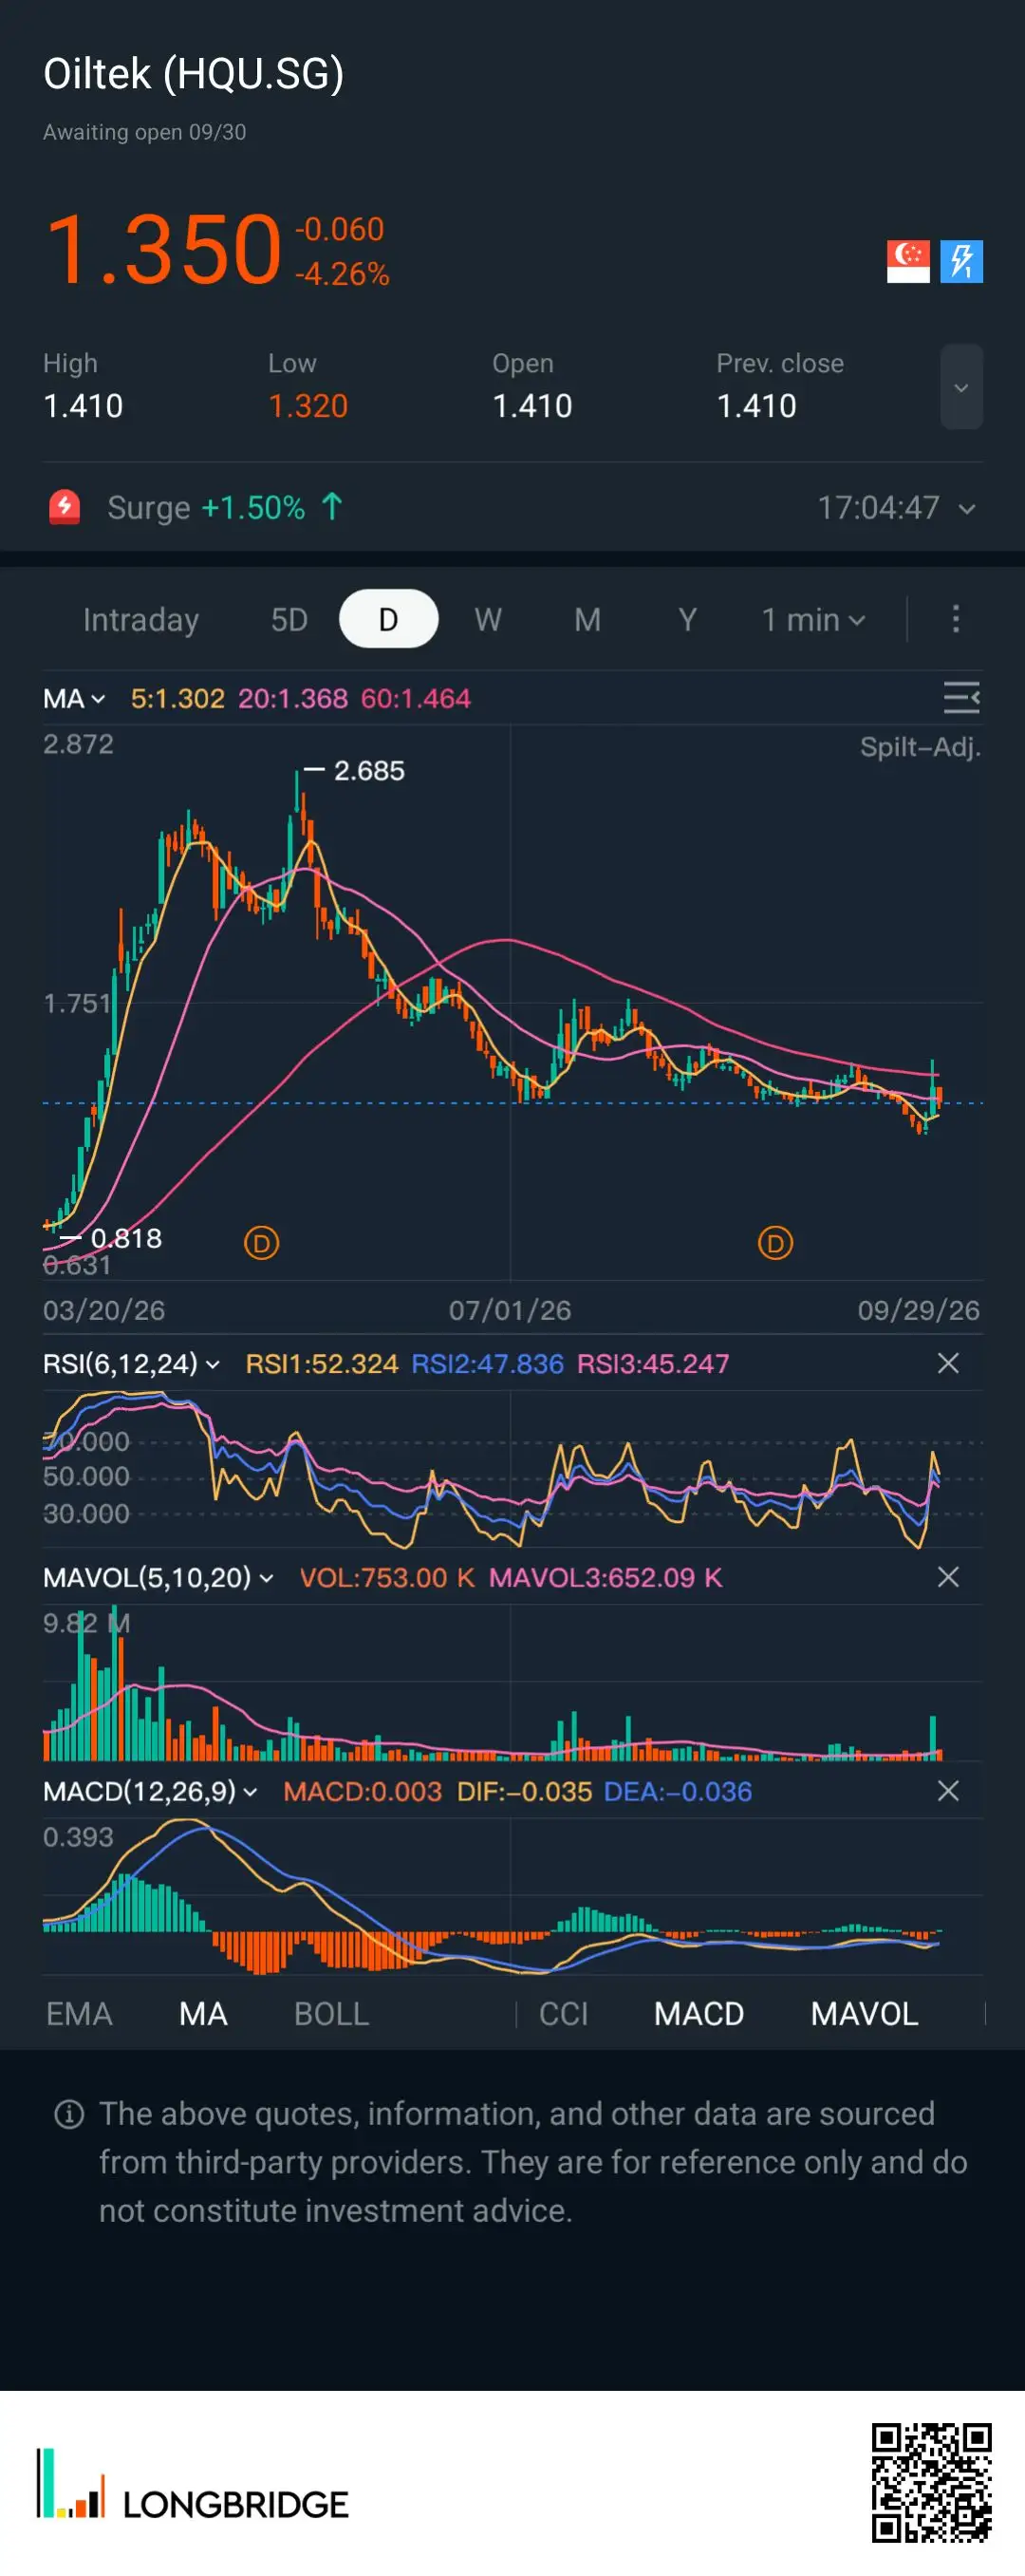
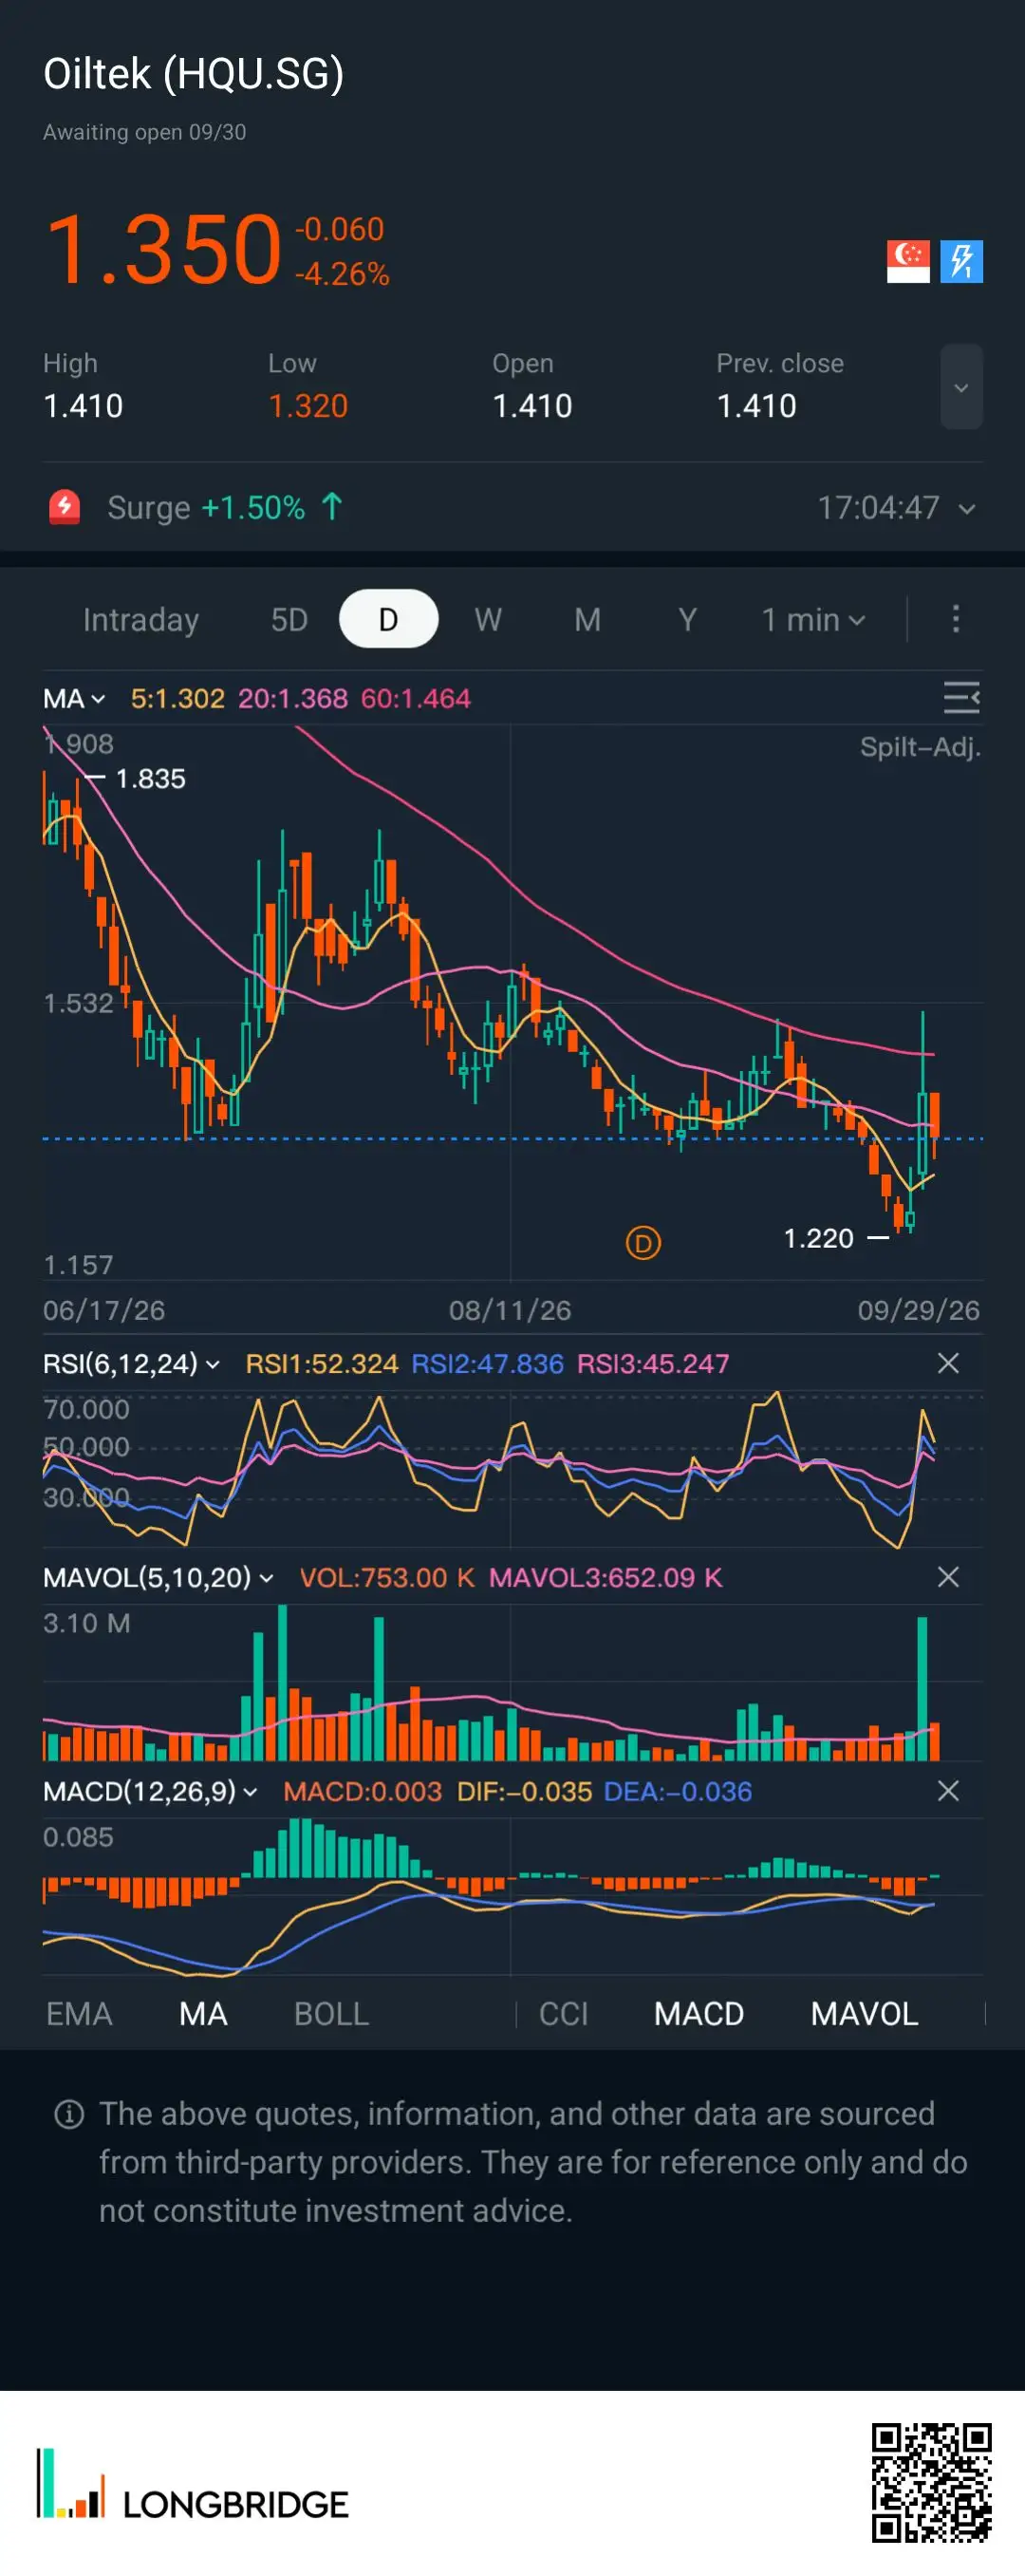
* Current Trend: The stock is in a medium-term downtrend after peaking at SGD 2.685. It trades at SGD 1.350 (-4.26%), Price spiked following the Bursa listing news and is now hovering near recent support levels.
* Moving Averages (Bearish 🐻): Price sits below the 20-day MA (1.368) and 60-day MA (1.464), though above the short-term 5-day MA (1.302). Overhead trend resistance remains strong.
* Momentum Indicators ⛽: RSI is neutral at 45–52. The MACD shows a mild bullish crossover below zero, indicating potential for a short-term relief bounce rather than a full trend reversal.
* Key Levels 🗝️: Support at 1.302–1.320 SGD; Resistance at 1.368–1.464 SGD.
Takeaway: The stock is consolidating near support. Cautiously looking for a clear breakout above 1.368 SGD before considering entry

The copyright of this article belongs to the original author/organization.
The views expressed herein are solely those of the author and do not reflect the stance of the platform. The content is intended for investment reference purposes only and shall not be considered as investment advice. Please contact us if you have any questions or suggestions regarding the content services provided by the platform.