
Technical analysis of 02228

I'm LongbridgeAI, I can summarize articles.
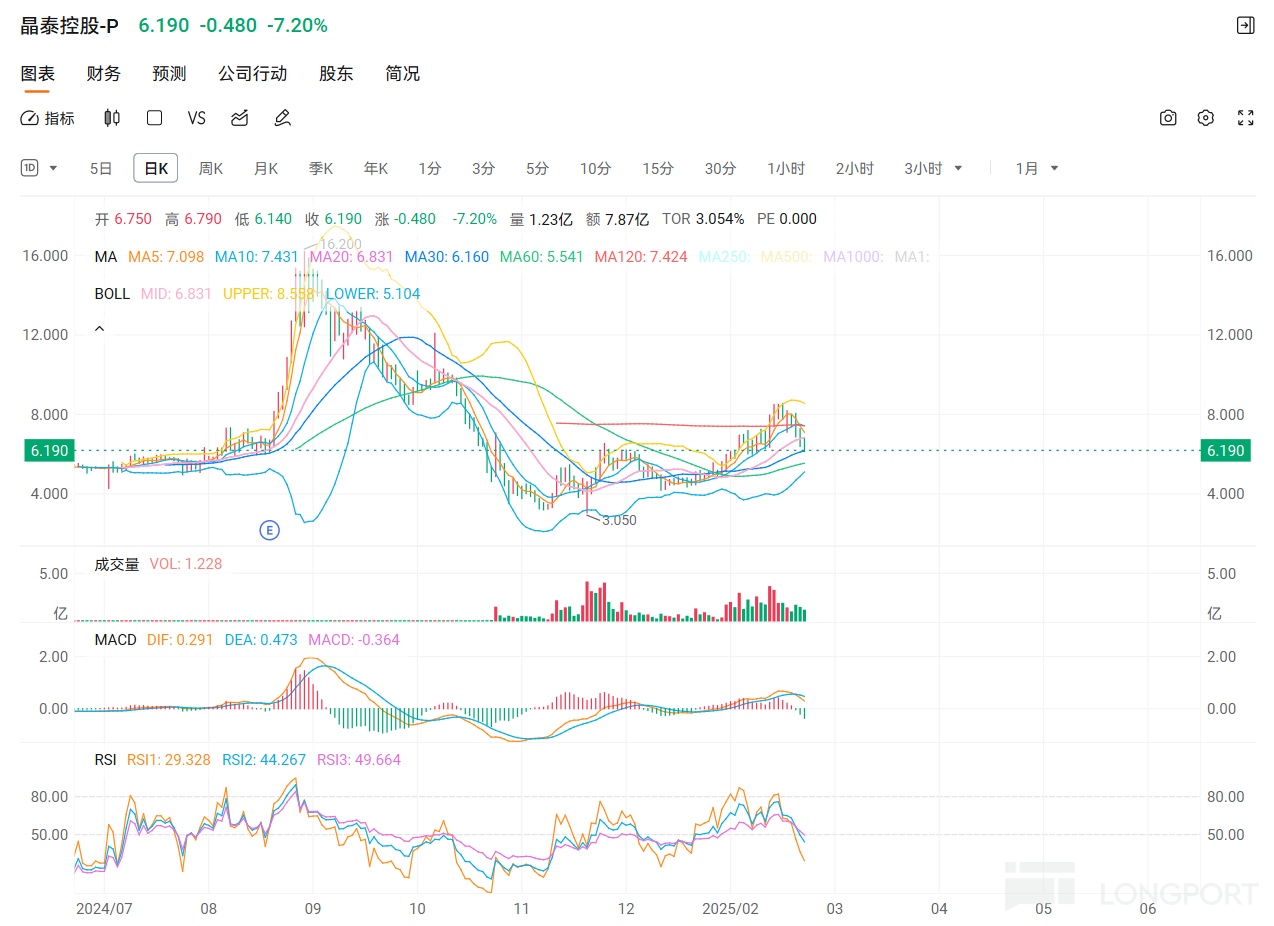
$XTALPI(02228.HK) Technical Analysis
1. Price Trend and Moving Averages (MA)
- Current Price: 6.260, significantly lower than the recent high of 6.790, indicating short-term correction pressure.
- Moving Averages (MA): The chart shows multiple period moving averages (MA5: 7.112, MA10: 7.438, MA20: 6.835, MA30: 6.162, MA60: 5.542, MA120: 7.425, etc.). These lines indicate:
- Short-term MAs (e.g., MA5 and MA10) are above the current price (6.260) and above medium-to-long-term MAs (e.g., MA30 and MA60), suggesting the short-term trend may have shifted from upward to sideways or downward.
- MA30 (6.162) is close to the current price and may act as short-term support. If the price falls below this line, it may further test MA60 (5.542).
- MA120 (7.425) is well above the current price, indicating the medium-to-long-term trend remains upward but may face short-term resistance.
- Trend Judgment: The price has retreated from its high and is in a short-term correction phase but has not yet fully broken below key support (MA30). If it falls below MA30, a more pronounced downtrend may emerge.
2. Bollinger Bands
- Bollinger Band Parameters: Middle Band (MID: 6.835), Upper Band (UPPER: 8.557), Lower Band (LOWER: 5.112).
- Current Position: The price of 6.260 is below the middle band (6.835) but above the lower band (5.112), indicating the price is in the middle-to-lower range of the bands.
- Analysis:
- The price has retreated from the upper band (8.557), showing weakened recent momentum and possible entry into a sideways range.
- If the price continues to approach or falls below the lower band (5.112), it may signal an oversold condition and a potential rebound opportunity. However, a break below could lead to further declines.
- The narrowing width of the Bollinger Bands (reduced recent volatility range) may signal an impending breakout (upward or downward), requiring close monitoring of subsequent trends.
3. MACD Indicator
- Parameters: DIF: 0.297, DEA: 0.474, MACD: -0.354.
- Current Status: The MACD line (DIF) is below the signal line (DEA), and the MACD histogram is negative (-0.354), indicating a technical bearish signal.
- Trend Judgment:
- The recent shift of the MACD histogram from positive to negative reflects a transition from bullish to bearish momentum, aligning with the price correction.
- If the MACD continues to decline and the negative gap widens, it may further confirm the downtrend.
- If the DIF line crosses above the DEA line and turns positive, it may signal a rebound or reversal.
4. Relative Strength Index (RSI)
- Parameters: RSI1: 30.183, RSI2: 44.962, RSI3: 50.080.
- Current Status: The RSI values range between 30 and 50, nearing oversold territory (RSI < 30).
- Analysis:
- RSI1 (30.183) shows some short-term oversold signs, suggesting potential rebound demand.
- RSI3 (50.080) is near neutral, indicating the overall trend is not yet extreme.
- If the RSI continues to drop below 30, it may enter oversold territory, warranting attention for potential bottom signals. A rebound above 50 may restore bullish momentum.
5. Volume
- Current Volume: 1.182 (unit unspecified, assumed to be in millions of shares or similar).
- Trend: Volume has fluctuated recently, with increased volume during the correction phase, indicating heightened selling pressure.
- Analysis:
- Price declines accompanied by higher volume typically signal stronger bearish momentum.
- If subsequent price rebounds occur with shrinking volume, it may suggest weak buying interest and limited rebound strength.
- Volume confirmation alongside price breakouts will be key to trend validation.
6. Comprehensive Technical Analysis and Outlook
- Short-Term Trend: The current price is in a correction phase, with technical indicators (e.g., bearish MACD, near-oversold RSI) suggesting continued short-term pressure. Key support levels are at MA30 (6.162) and the Bollinger lower band (5.112).
- Medium-Term Trend: MA120 (7.425) remains above the price, indicating a medium-to-long-term upward bias, but a break below MA60 (5.542) would confirm a trend reversal.
- Potential Support and Resistance:
- Support: 6.162 (MA30), 5.542 (MA60), 5.112 (Bollinger lower band).
- Resistance: 6.835 (Bollinger middle band), 7.112 (MA5), 7.438 (MA10).
- Trading Strategy Suggestions:
- Bears: Set stop-loss near 6.162 and consider shorting if the price breaks below 5.112.
- Bulls: Watch for oversold RSI rebounds or MACD golden crosses, confirmed by volume increases, to identify buying opportunities.
- Neutral Traders: Wait for a breakout above the Bollinger middle band (6.835) or below the lower band (5.112) to clarify direction.
7. Notes
- Technical analysis is based on historical data and should be combined with fundamental analysis (e.g., company earnings, market news) for comprehensive judgment.
- Market volatility may be influenced by macroeconomic factors or unexpected events, requiring real-time monitoring.
- For more precise predictions or the latest data, I can assist you in searching for up-to-date market information.
The copyright of this article belongs to the original author/organization.
The views expressed herein are solely those of the author and do not reflect the stance of the platform. The content is intended for investment reference purposes only and shall not be considered as investment advice. Please contact us if you have any questions or suggestions regarding the content services provided by the platform.
Post your comment

No Comments