$XIAOMI-W(01810.HK)
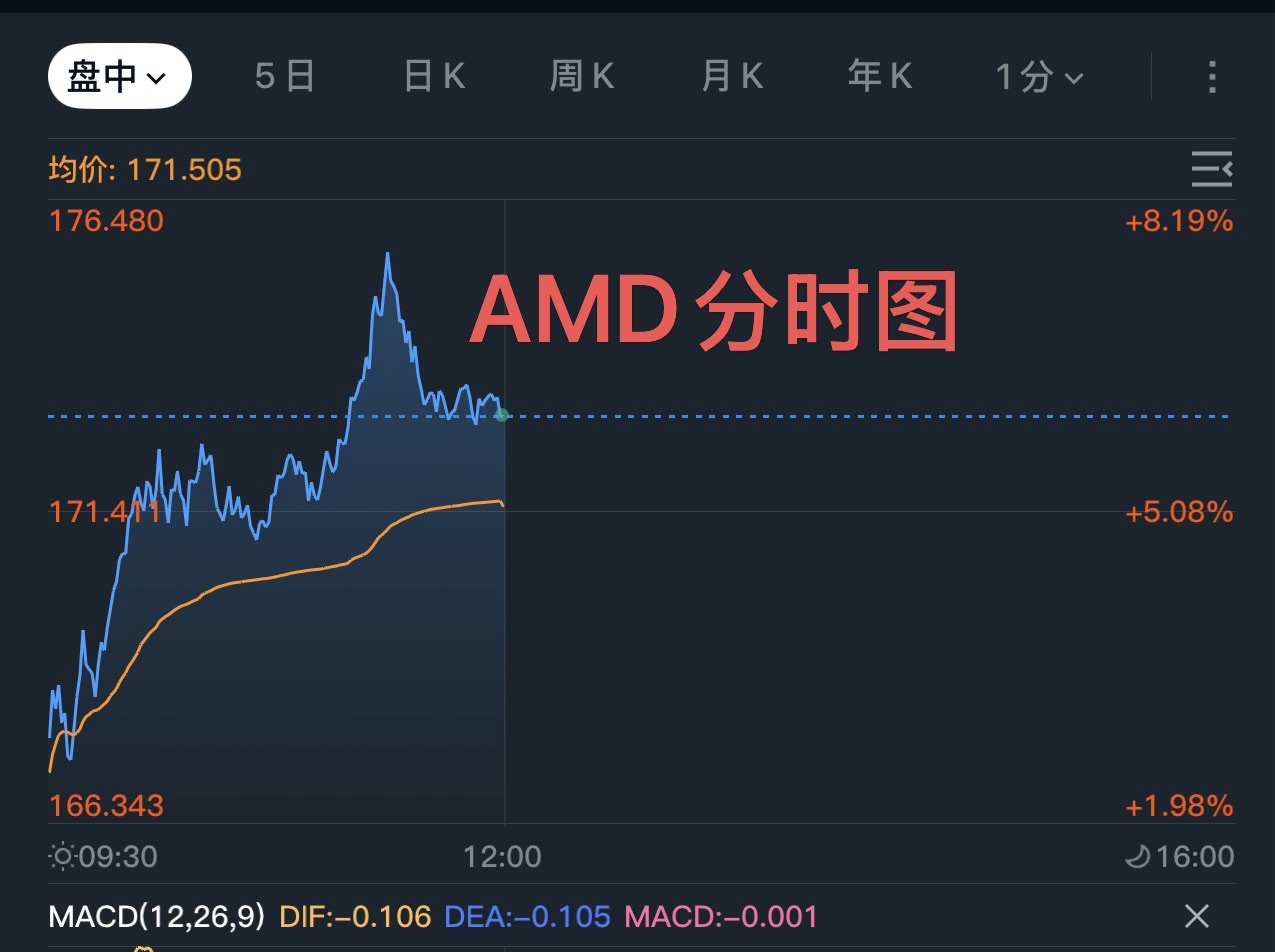
Xiaomi bros, AMD stocks are so easy to day trade! Look at today's intraday chart, it's a V-shaped reversal every day!

$XIAOMI-W(01810.HK)
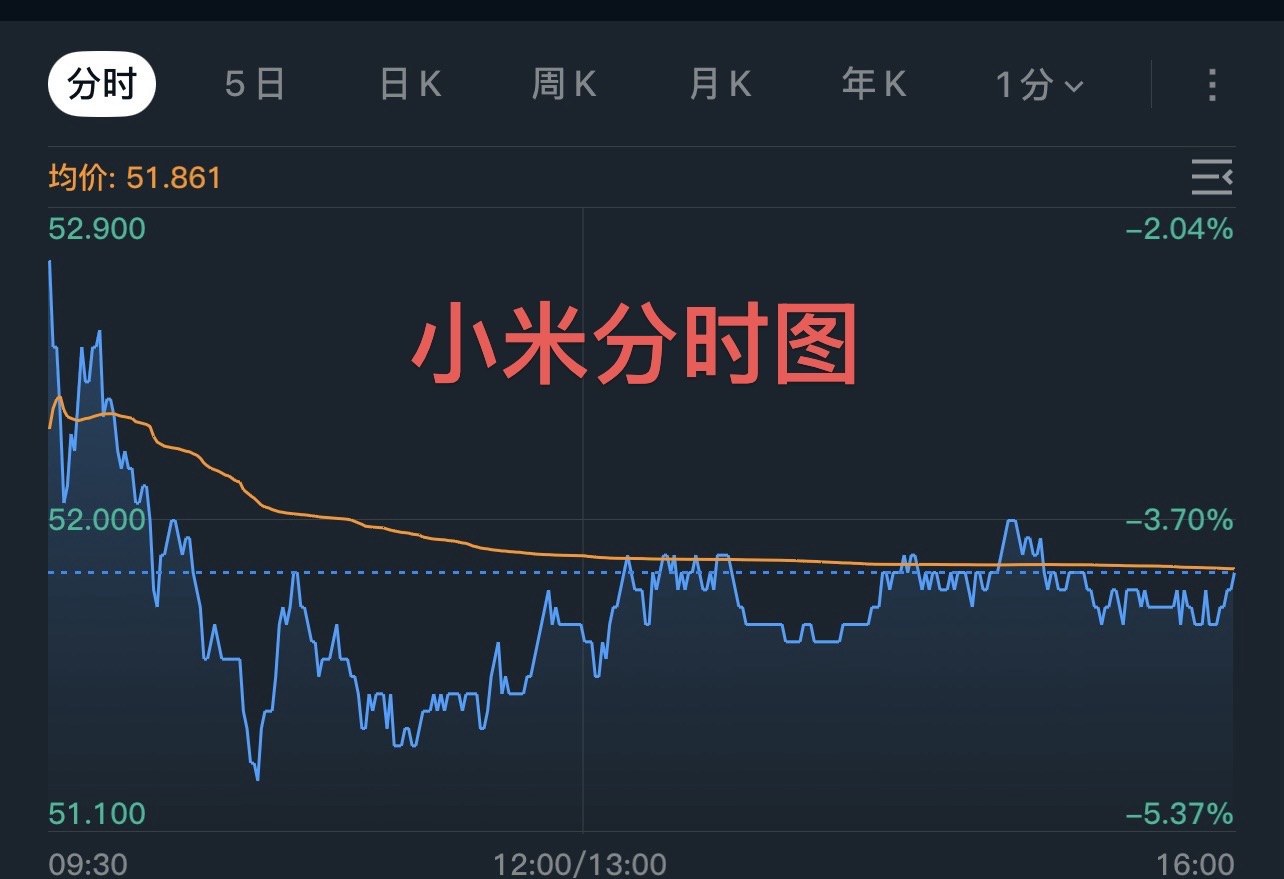
Brothers of Xiaomi, I feel like Xiaomi's intraday chart is basically a weaving machine market.
Summary: Xiaomi's intraday chart
1. Xiaomi only has fluctuations at the morning opening, and the rest of the time is basically a weaving machine market;
2. Xiaomi has no peak or valley patterns, making it hard to judge the bottom and top;
3. Xiaomi's intraday chart is hard to judge whether it's falling or rising.
Summary of AMD's intraday chart
1. The trend in the intraday chart is obvious; once it starts rising, it keeps rising;
3. Once a downtrend forms, it keeps falling.
2. There are clear V or inverted V reversal signals, with a rising angle of 60 degrees or a small falling angle of 60 degrees, making it easy to judge the trend.
3. When the intraday rise or fall exceeds 5%, oversold or overbought conditions appear, and a V-shaped reversal with a 150-degree angle is likely, making it very easy to judge the trend for day trading.
Note⚠️ AMD stock may show bamboo shoot-like patterns during rapid rises or falls, so pay attention to judging the trend!
Later, I will post some typical AMD intraday charts in the comments. Everyone, stay tuned!
The copyright of this article belongs to the original author/organization.
The views expressed herein are solely those of the author and do not reflect the stance of the platform. The content is intended for investment reference purposes only and shall not be considered as investment advice. Please contact us if you have any questions or suggestions regarding the content services provided by the platform.
