
英伟达业绩布局必看:这 3 个期权指标全面解读,从数据里挖掘聪明钱动向,教你避开常见陷阱!

$NVIDIA(NVDA.US) Earnings are coming again! This time, it also brings the Jetson Thor platform that provides computing power for robots. Many industry-leading companies have already taken the lead in using it. The era of general-purpose robots seems really not far away!
So the question is, what are everyone's plans? Continue holding, betting on a big earnings surge? Or take profits early and secure the gains?
Don't panic! As a tech giant, NVIDIA's stock price is high and volatile, which indeed makes investors nervous. But if you know how to use options and understand option data, you can play more tricks during the earnings season and better control risks!
Today, Option Master will talk to you about: How to play options around NVIDIA's earnings? How to interpret some key option data? What should you pay attention to when investing?
Click here to reserve:NVIDIA Corporation (NVDA.US) Q2 FY2026 Earnings Conference Call
I. General Option Trading Strategies Around Earnings
Last time, we mentioned that trading options during earnings season mainly focuses on two core points: how will the stock price move? How will IV change? Among them, IV is the most important point in this battle.
1) Weeks before earnings: Go long on IV
Generally, in the weeks before earnings, the market is guessing how the earnings will turn out, uncertainty is high, and implied volatility (IV) starts to rise slowly, reaching a small peak before earnings.
The core strategy at this stage is "going long on IV," buying options in advance to capture the benefits of rising IV.
Of course, you also need to judge the direction yourself, choose the right strike price and expiration date, and not blindly follow the crowd.
2) Days before or on earnings day: Go short on IV
In the days before or on the earnings day, market sentiment is very tense, and implied volatility (IV) has surged to a high point. At this time, option prices are pushed very high, so days before earnings, it’s more suitable to consider being a "seller."
Unlike the pre-earnings layout phase, the core of this stage is more about capturing the high point of IV and harvesting premiums through selling strategies.
Of course, the market always has uncertainties, such as IV not falling as expected or stock prices fluctuating violently beyond expectations. These require advance risk management.
3) After earnings: Follow the trend with directional strategies
Once earnings are announced, the suspense is revealed, IV usually drops quickly, and the stock price starts a new trend. Close positions in time or follow the trend with directional strategies.
Remember, IV has a mean-reverting characteristic—it falls after rising too high and rises after falling too low. Don’t blindly buy options at high IV, as it’s easy to lose money!
Option Master won’t go into detail here about how to operate pre-, during, and post-earnings option strategies.
Click the previous article to learn more: Earnings Season Trading Tool: New Combo Option Feature + 3-Phase Guide for Pre-, During, and Post-Earnings, Full Strategy Analysis!
II. How to Read Option Data? Master These Three Key Metrics
1)$NVIDIA(NVDA.US) IV has rebounded from lows, option buyers should beware of IV Crush risk
Strategies that don’t talk about implied volatility (IV) are nonsense, so let’s look at NVIDIA’s IV.
NVIDIA’s current IV is 43.76%, and IV Percentile is 32%, which has clearly rebounded from the lows in May and June.
Everyone knows that IV is the core factor in option pricing, reflecting the market’s expectations for future volatility of the underlying asset.
Generally, the higher the IV, the more expensive the options; the lower the IV, the cheaper the options. So IV levels directly affect traders’ strategy choices: low IV means cheap options, suitable for buyers to enter and bet on direction; high IV means expensive options, more suitable for sellers to earn time value.
So what is IV Percentile? It’s actually a percentile ratio. For example, NVIDIA’s current IV Percentile is 32%, meaning that in the past year, only 32% of trading days had IV lower than the current level, while 68% of trading days had higher IV!
However, note that although the current IV is lower than most of the past year, it has rebounded significantly from the lows in May and June. Option buyers should be wary of IV Crush risk, as option prices are no longer as cheap as before!

2) NVIDIA’s Put/Call Ratio is less than 1, indicating continued market optimism
Let’s look at the Put/Call Ratio metric. You may often see its abbreviation PCR but don’t understand what it means.
It mainly includes two types: volume PCR (Put/Call Vol Ratio) and open interest PCR (Put/Call OI Ratio). Put/Call Vol Ratio refers to the ratio of put volume to call volume, while Put/Call OI Ratio refers to the ratio of put open interest to call open interest.
Taking open interest PCR as an example, generally, the higher this ratio, the more puts the market holds, indicating bearish sentiment; the lower the ratio, the more calls are favored, reflecting market optimism.
PCR’s main reference role during earnings season is to see if there are any anomalies. For example, if PCR suddenly rises sharply after earnings, it may indicate bad news or events, and market sentiment is turning pessimistic.
However, note that PCR sometimes acts as a "contrarian indicator" and may not always accurately reflect market trends. From an investment perspective, when PCR is at extreme highs or lows, it often signals a potential market reversal or major divergence. At this time, it’s best to analyze it together with other indicators like IV and price trends. Relying solely on PCR for decisions can lead to pitfalls.
Let’s look at NVIDIA’s PCR with Option Master: Stock Details Page - Options - Option Analysis - Option Volume Statistics.

You can see that NVIDIA’s two PCR values are currently less than 1, with little recent change, indicating that call volume and open interest still dominate the market. Investors remain optimistic about the future and are more willing to buy and hold calls.
But actually, NVIDIA’s PCR has never been high, and there hasn’t been any drastic change recently, so there’s no need to overthink this metric. However, if you encounter other stocks with wildly fluctuating PCR values, you need to pay special attention, as market sentiment may be shifting.

3) Analyze volume distribution to gauge market trends and key price ranges
During earnings season, the options market often sees some "abnormal orders," such as large funds suddenly concentrating on buying options at a certain strike price or rapid increases in open interest for contracts with specific expiration dates. These are often institutions or big players positioning in advance.
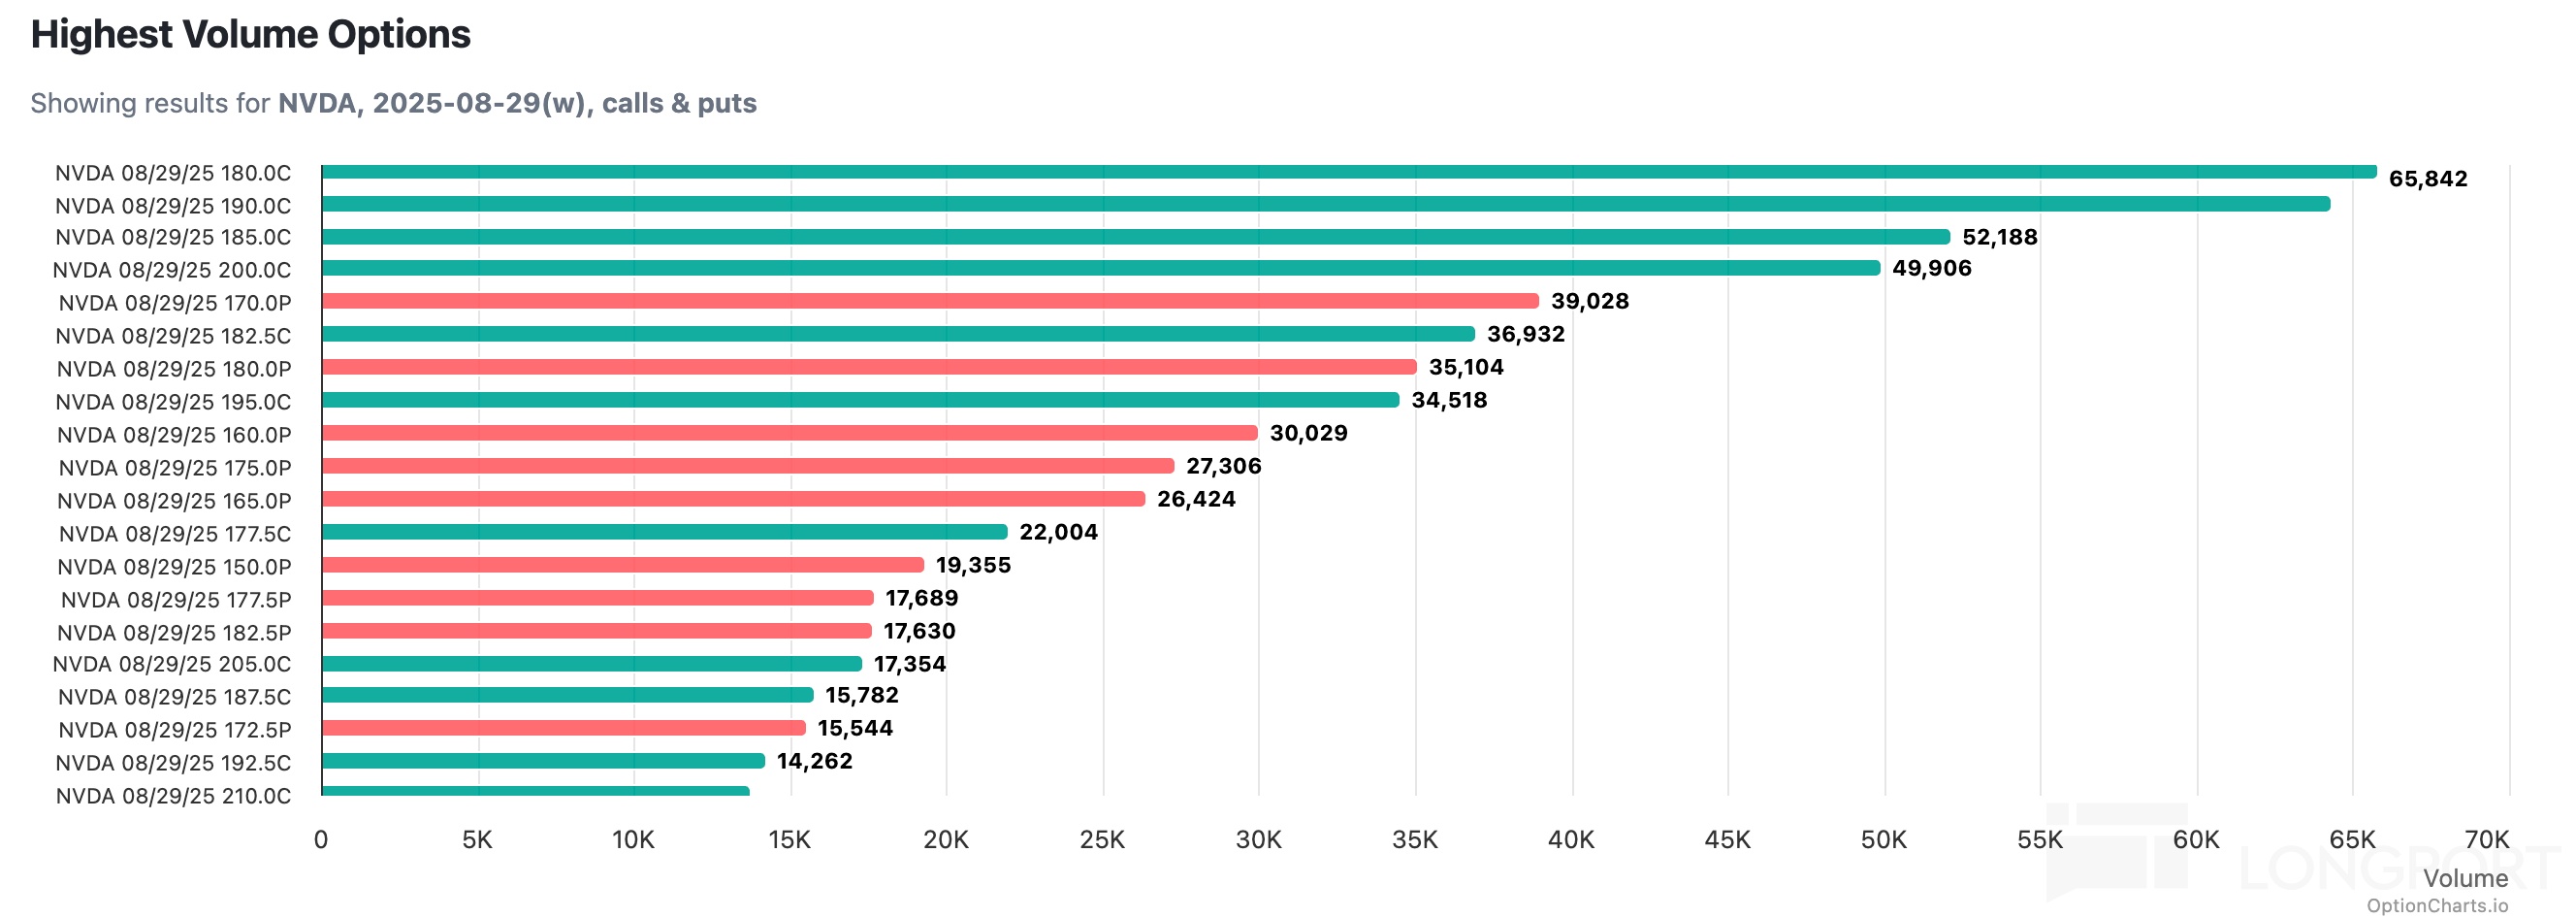
Take $NVIDIA(NVDA.US) as an example. From the volume perspective, trading is mainly concentrated in this Friday’s (August 29) expiring contracts, showing the market’s high attention and speculative sentiment toward earnings.
Specifically, the most densely traded call strikes are $180, $190, and $185, while puts are heavily concentrated around $170 and $180.
These dense strike price areas usually represent key support or resistance levels expected by the market, reflecting the psychological lines of bulls and bears. Tracking such open interest anomalies helps us capture the movements of "smart money."
Although you shouldn’t blindly follow orders, as a reference dimension for judging market sentiment and expected volatility ranges, it does have good practical value!
Option Master won’t go into more specifics here. You can also combine open interest, abnormal large orders, technical analysis, and fund flows to make a comprehensive judgment.
III. Always Remember Risk Management
Options are flexible but not a sure win, especially during earnings season, when volatility is intense and risks are higher. Option Master offers a few suggestions:
Don’t go all-in: Whether you’re a buyer or seller, control your position size—don’t bet everything.
Set stop-loss and take-profit: Earnings season moves fast, so set stop-loss and take-profit to avoid passive losses.
Combine multiple indicators: Don’t just look at IV or PCR; also analyze stock price trends, volume, and anomaly lists.
Practice more, use less real money: Beginners can practice with simulated trading first and only use real money once they’re familiar.
The copyright of this article belongs to the original author/organization.
The views expressed herein are solely those of the author and do not reflect the stance of the platform. The content is intended for investment reference purposes only and shall not be considered as investment advice. Please contact us if you have any questions or suggestions regarding the content services provided by the platform.
