

FTSE Custom Global AI Select Index: One-click access to global AI leaders through Connect


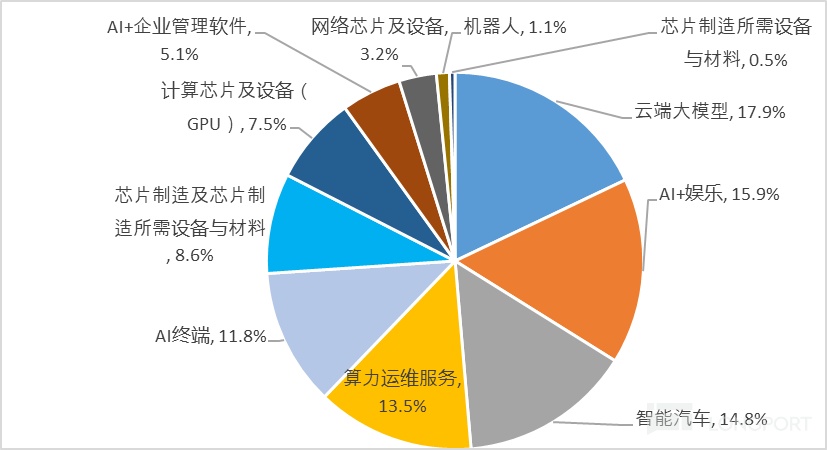
The E Fund (Hong Kong) FTSE AI Select Index ETF (Stock Code: $EFUND AI(03489.HK) ) covers the entire AI industry chain with its index constituents, evenly distributed across various segments, including cloud-based large models, AI+entertainment, smart vehicles, computing power operation and maintenance services, and AI terminals, each accounting for 10% to 20%. The top 10 constituents include giants in the AI industry from China and the US, mostly in the information technology, communication services, and consumer discretionary sectors. The highest weight of any single constituent is only around 7% (NVIDIA), reflecting diversification.
Industry classification of the index (by weight)
Top 10 constituents of the index
| Stock Code | Stock Name | Sector | AI Industry Chain | Weight |
| NVDA.OQ | NVIDIA | Information Technology | Computing Chips & Equipment (GPU) | 7.00% |
| MSFT.OQ | Microsoft | Information Technology | Cloud-based Large Models | 6.81% |
| 0700.HK | Tencent | Communication Services | Computing Power Operation & Maintenance Services | 6.72% |
| 0981.HK | SMIC | Information Technology | Chip Manufacturing & Related Equipment/Materials | 6.62% |
| 1810.HK | Xiaomi | Information Technology | AI Terminals | 6.54% |
| 1024.HK | Kuaishou Technology | Communication Services | AI+Entertainment | 6.22% |
| 9988.HK | Alibaba | Consumer Discretionary | Computing Power Operation & Maintenance Services | 5.75% |
| 1211.HK | BYD | Consumer Discretionary | Smart Vehicles | 5.73% |
| AAPL.OQ | Apple | Information Technology | AI Terminals | 5.21% |
| 3690.HK | Meituan-Dianping | Consumer Discretionary | AI+Entertainment | 4.72% |
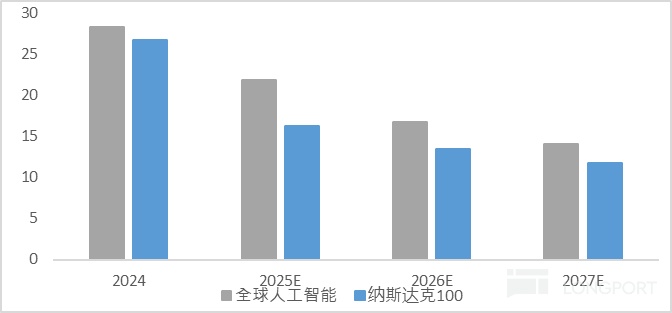
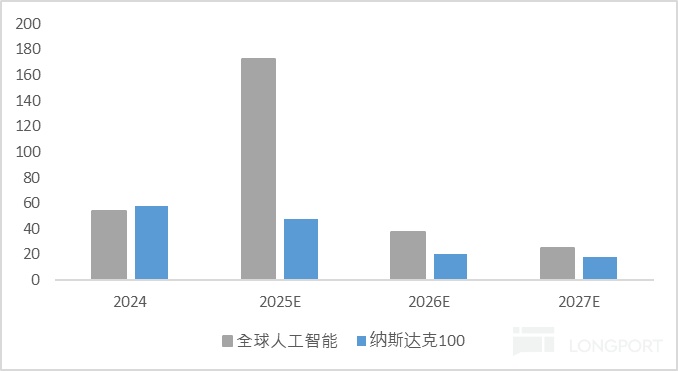
The revenue and profit growth expectations of the FTSE Custom Global AI Select Index are higher than those of the Nasdaq 100 Index. According to forecasts, the global AI industry's expected revenue growth rates for 2024, 2025, 2026, and 2027 are 28%, 22%, 17%, and 14%, respectively, while the expected net profit growth rates for the same periods are 54%, 173%, 38%, and 25%#. It can be seen that in 2025, the AI industry's profits will peak, showing signs of rapid growth.
Comparison of revenue growth expectations between the FTSE Custom Global AI Select Index and the Nasdaq 100*
Comparison of net profit growth between the FTSE Custom Global AI Select Index and the Nasdaq 100*
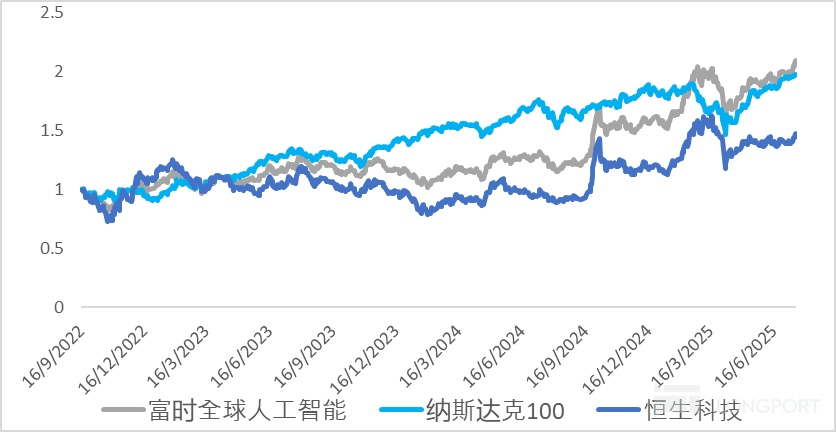
Since its base date, the FTSE Custom Global AI Select Index has significantly outperformed the Hang Seng Tech Index and, since 2024, the Nasdaq 100 Index. As of early 2025, the FTSE Custom Global AI Select Index has grown by 31%, higher than the Hang Seng Tech Index (25%) and the Nasdaq 100 Index (10%). The annualized return of the FTSE Custom Global AI Select Index since its base date on September 16, 2022, is 30%, higher than the Hang Seng Tech Index (15%) and the Nasdaq 100 Index (27%)##.
The Sharpe ratio of the FTSE Custom Global AI Select Index (1.06) is also higher than that of the Hang Seng Tech Index (0.25) and the Nasdaq 100 Index (1.01)##, meaning that under the same unit of risk, this investment portfolio may achieve higher excess returns. The better the risk-reward ratio of the portfolio, the higher the efficiency, and the more worthwhile the investment is, offering good "investment value for money."
Historical performance of the FTSE Custom Global AI Select Index
| FTSE Custom AI Select Index | Hang Seng Tech Index | Nasdaq 100 Index | |
| 2022 | 2% | 7% | -8% |
| 2023 | 17% | -8% | 55% |
| 2024 | 36% | 20% | 26% |
| 2025YTD | 31% | 25% | 10% |
| Since Base Date (2022) | |||
| Annualized Return | 30% | 15% | 27% |
| Annualized Volatility | 28% | 39% | 22% |
| Sharpe Ratio | 1.06 | 0.25 | 1.01 |
The latest sample of the FTSE Custom Global AI Select Index covers core AI companies from China and the US. As of July 31, 2025, the top 10 Hong Kong-listed constituents include Tencent Holdings, SMIC, and Alibaba Group in the computing power segment, as well as Xiaomi, Kuaishou Technology, BYD (H), Meituan-Dianping, Li Auto, XPeng, and Kingdee Software in the application segment. The top 10 US-listed constituents include NVIDIA, Broadcom, and TSMC ADR in the computing power segment; Microsoft, Amazon, Meta, Alphabet-A, and Alphabet-C in the model segment; and Apple and Tesla in the application segment. However, the index emphasizes sector balance, with no single constituent exceeding 7% in weight.
As of July 18, 2025, the valuation of the FTSE Custom Global AI Select Index is at the 89th percentile since its base date. Overall, the index has an excellent historical performance, balanced sector distribution, and a high proportion of new economy stocks. At the same time, the index brings together industry leaders with strong financial fundamentals, favored by smart money. Therefore, the E Fund (Hong Kong) FTSE AI Select Index ETF (Stock Code: 3489.hk), which closely tracks this index, is also worth attention for its investment value.
Valuation of the FTSE Custom Global AI Select Index
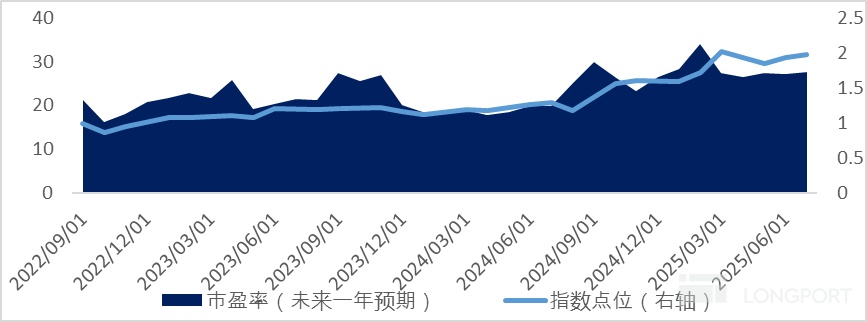
Data sources: Bloomberg, Wind, FTSE, E Fund Hong Kong, data as of July 31, 2025. #The forecast content in this section is based on official FTSE forecasts. The earnings expectations of the index are calculated by weighting the earnings expectations of the constituents by free-float market capitalization. ##Historical performance, returns, and Sharpe ratios are sourced from Bloomberg, with the comparison base date set as September 16, 2022. The above is only an objective display of the index's historical performance. Past performance of the index does not indicate its future performance and should not be taken as any investment advice. Investors should be aware of the risks of index volatility. The actual return of the fund may differ from the index performance due to management fees and tracking errors. *Includes future forecast data, all provided by FTSE.
The copyright of this article belongs to the original author/organization.
The views expressed herein are solely those of the author and do not reflect the stance of the platform. The content is intended for investment reference purposes only and shall not be considered as investment advice. Please contact us if you have any questions or suggestions regarding the content services provided by the platform.
