
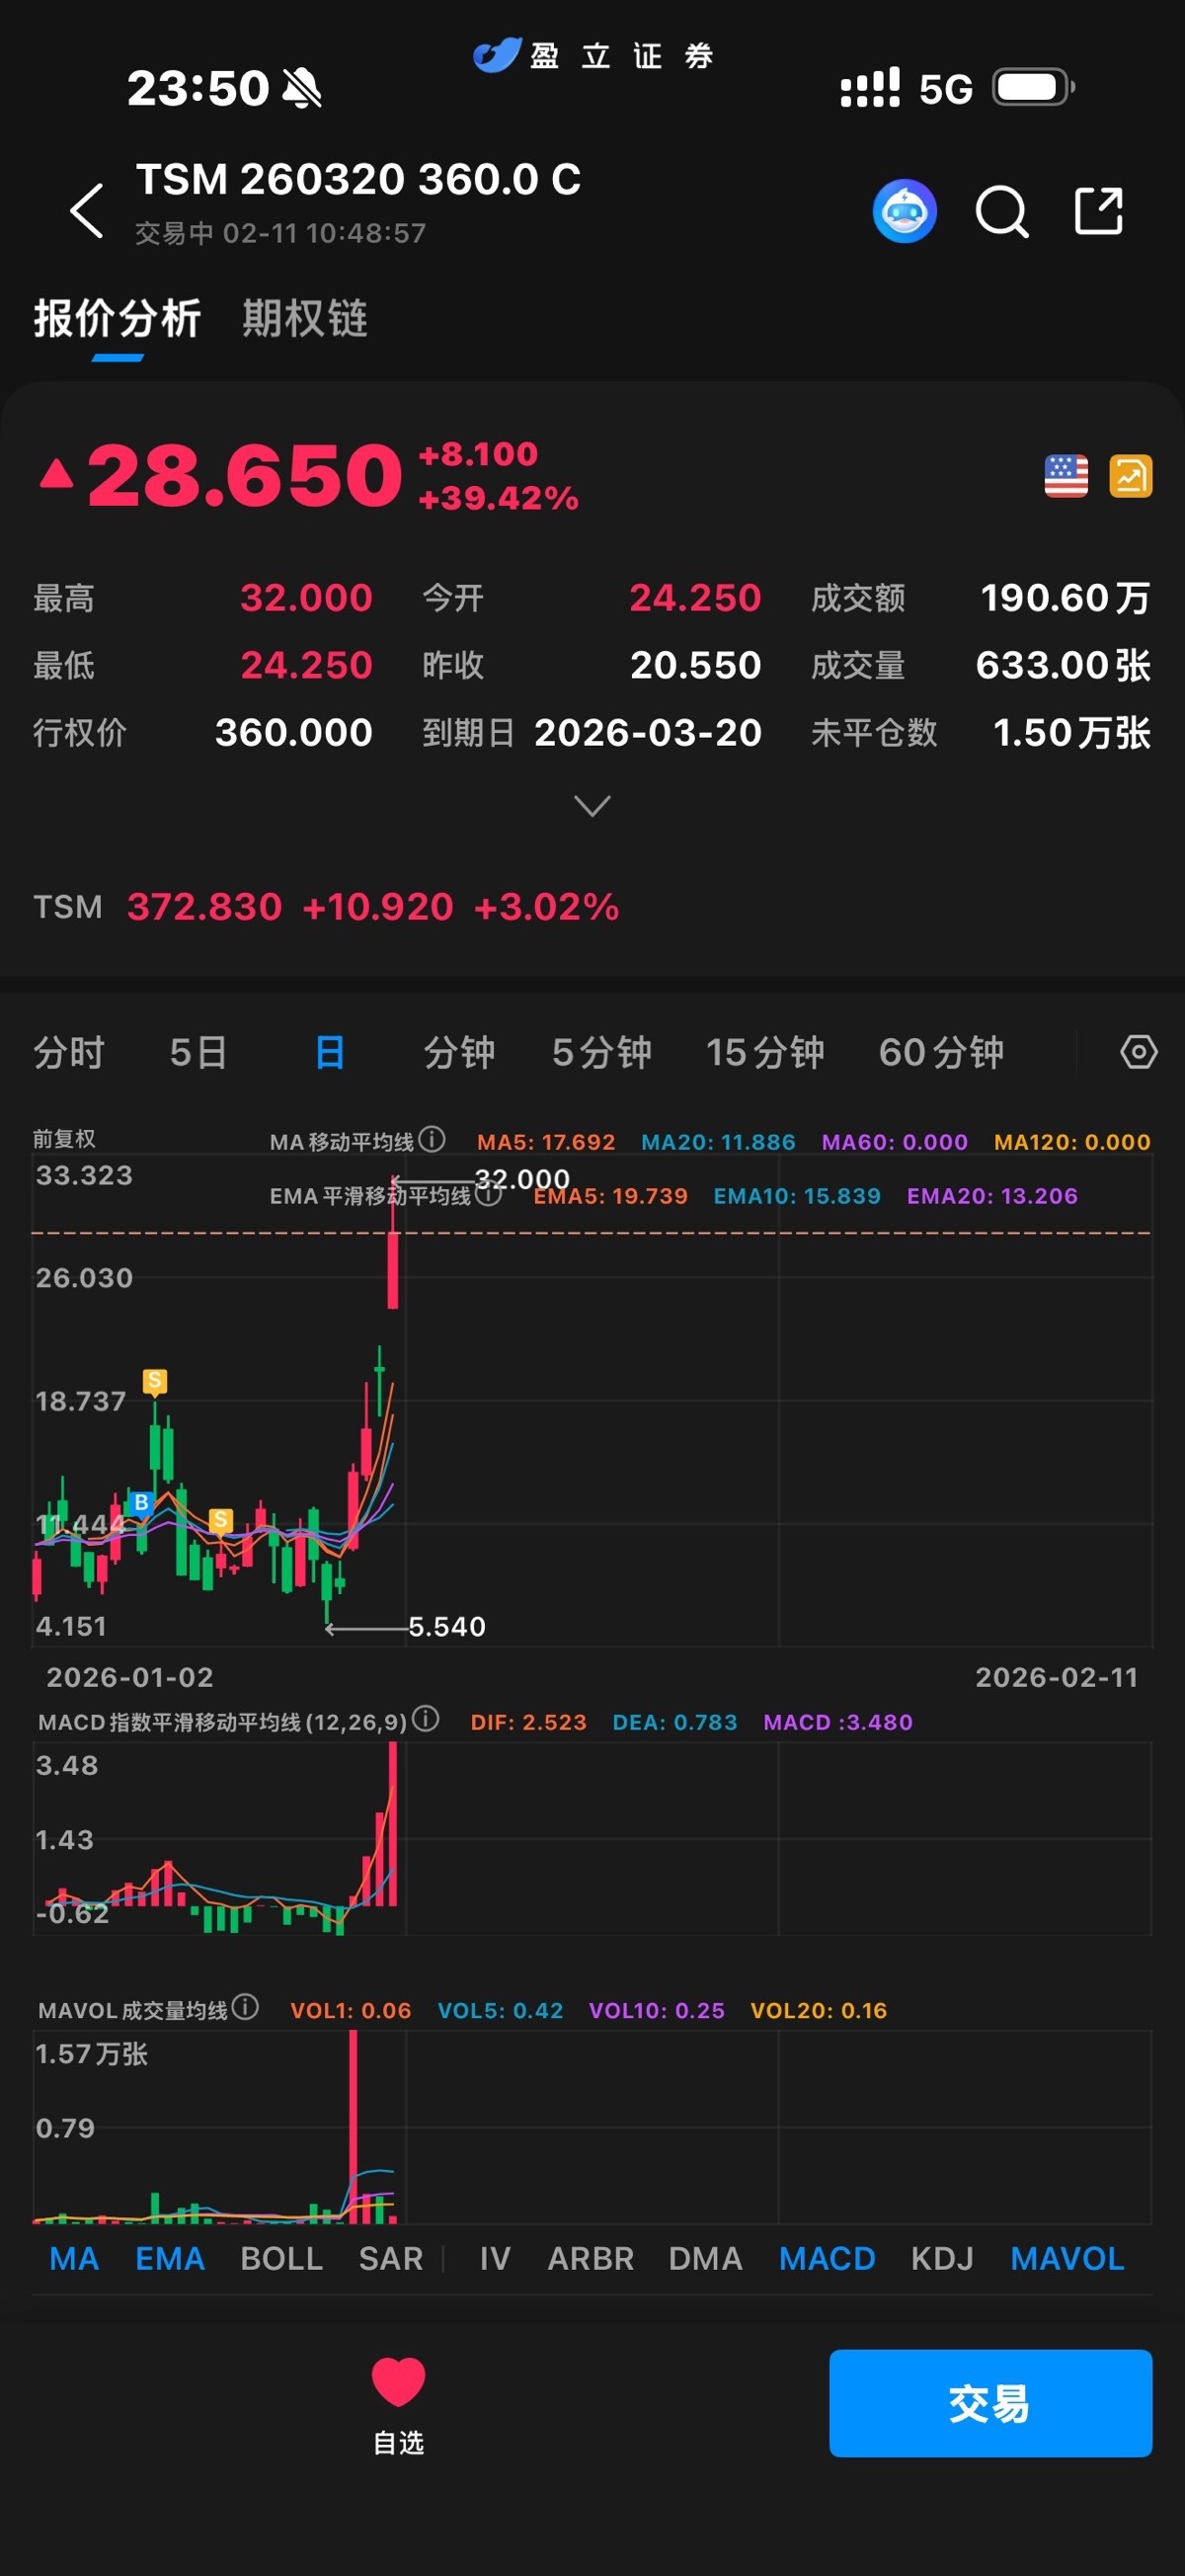
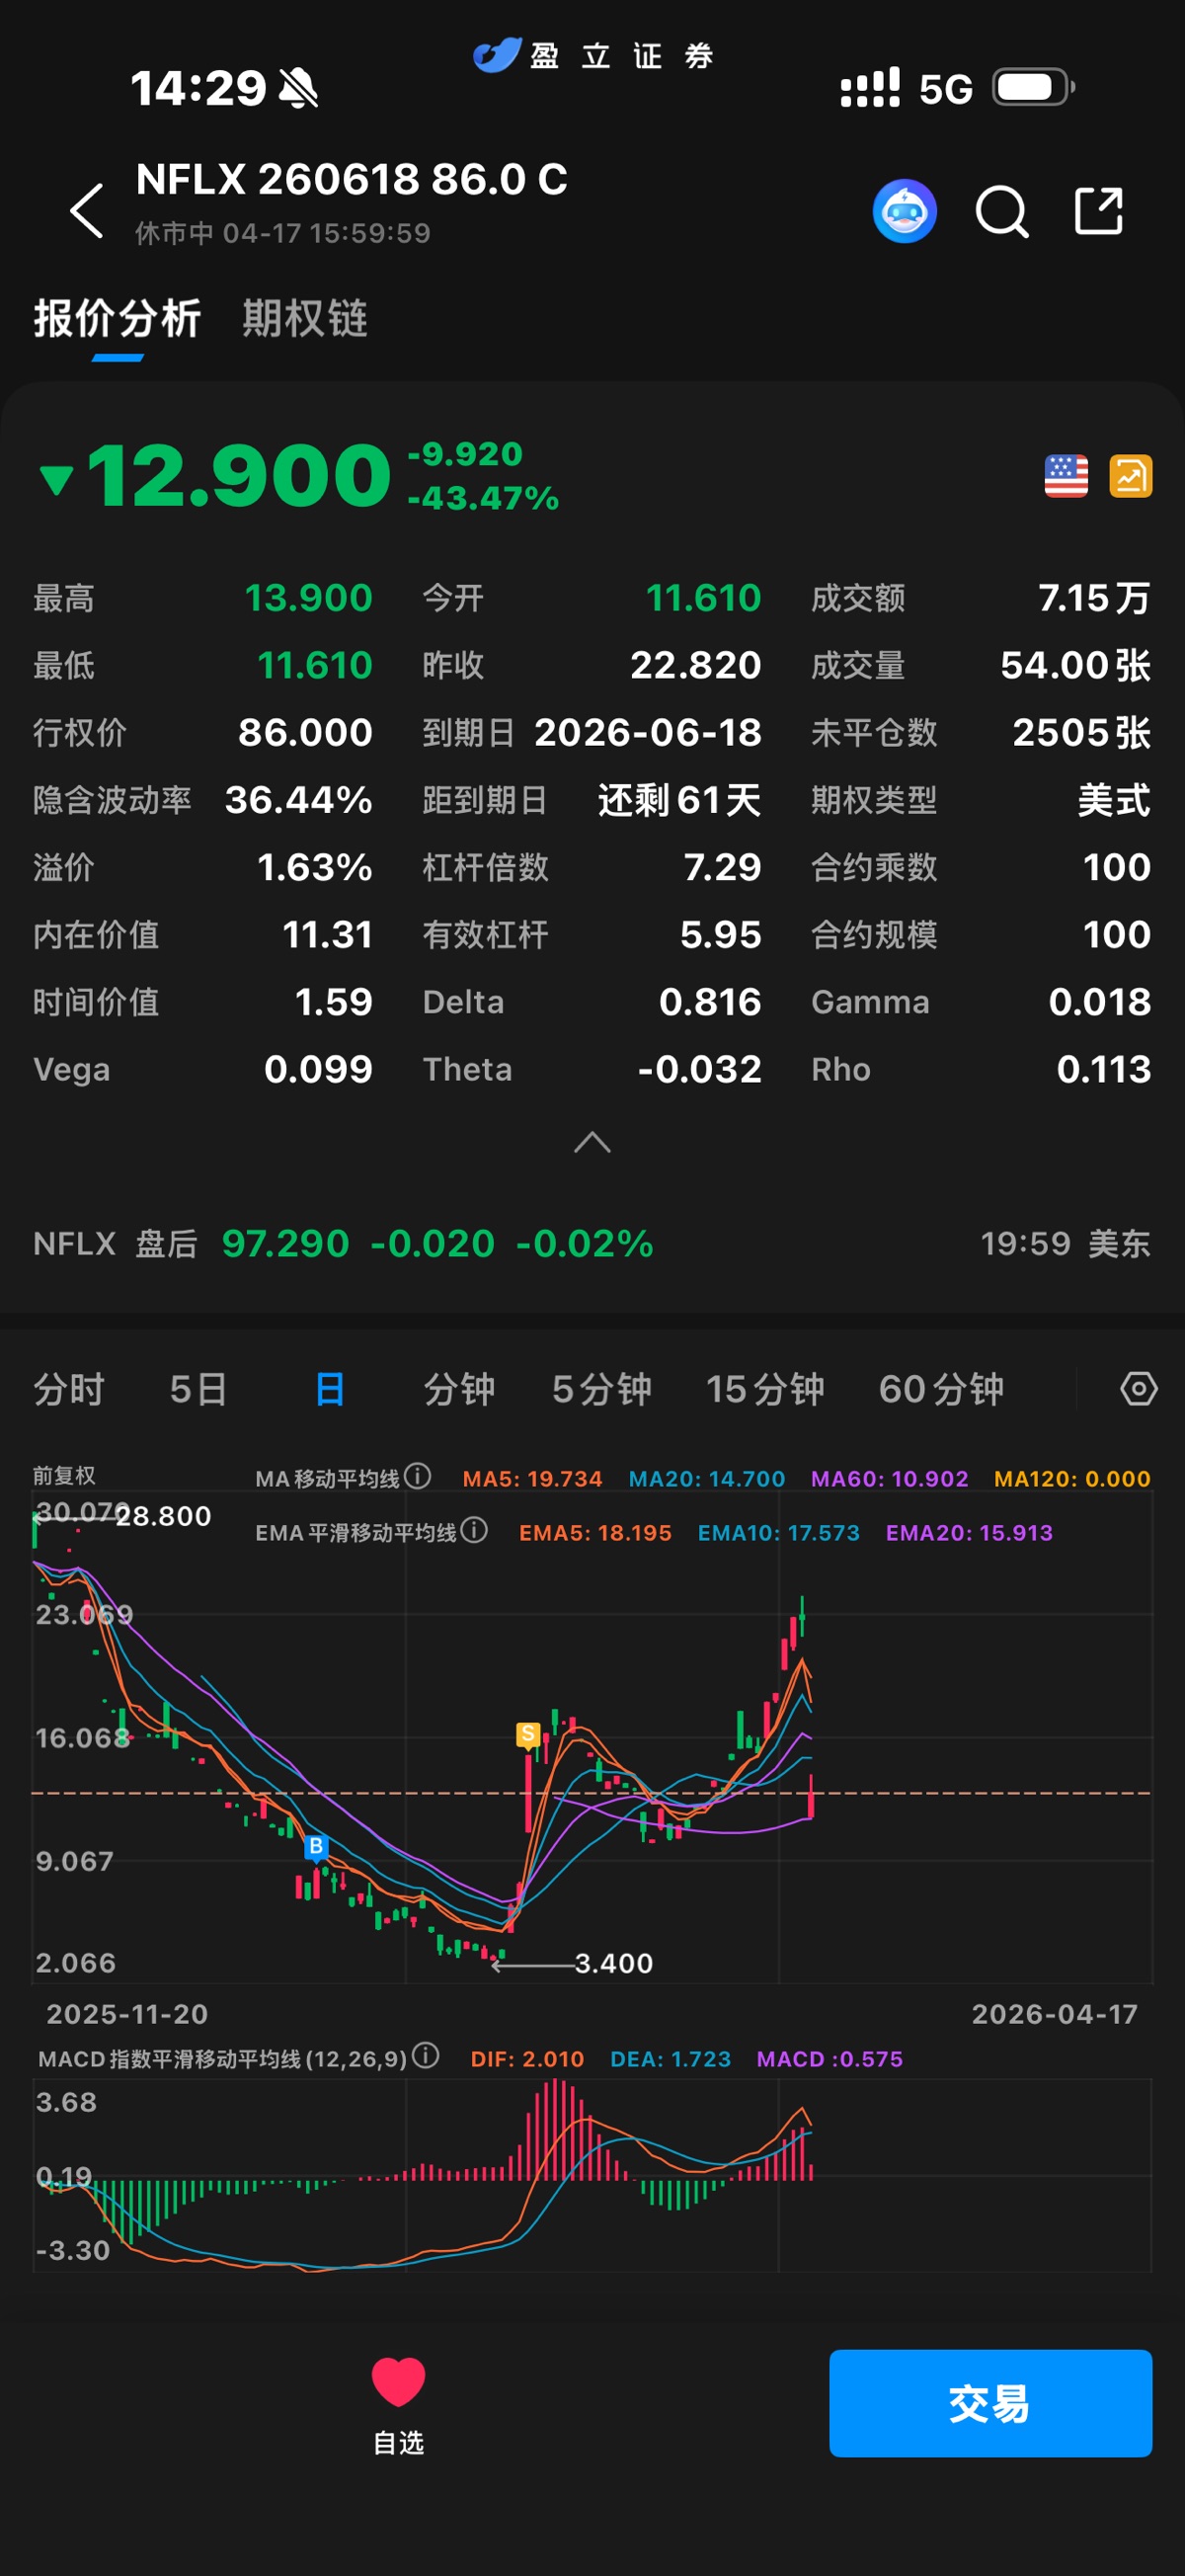
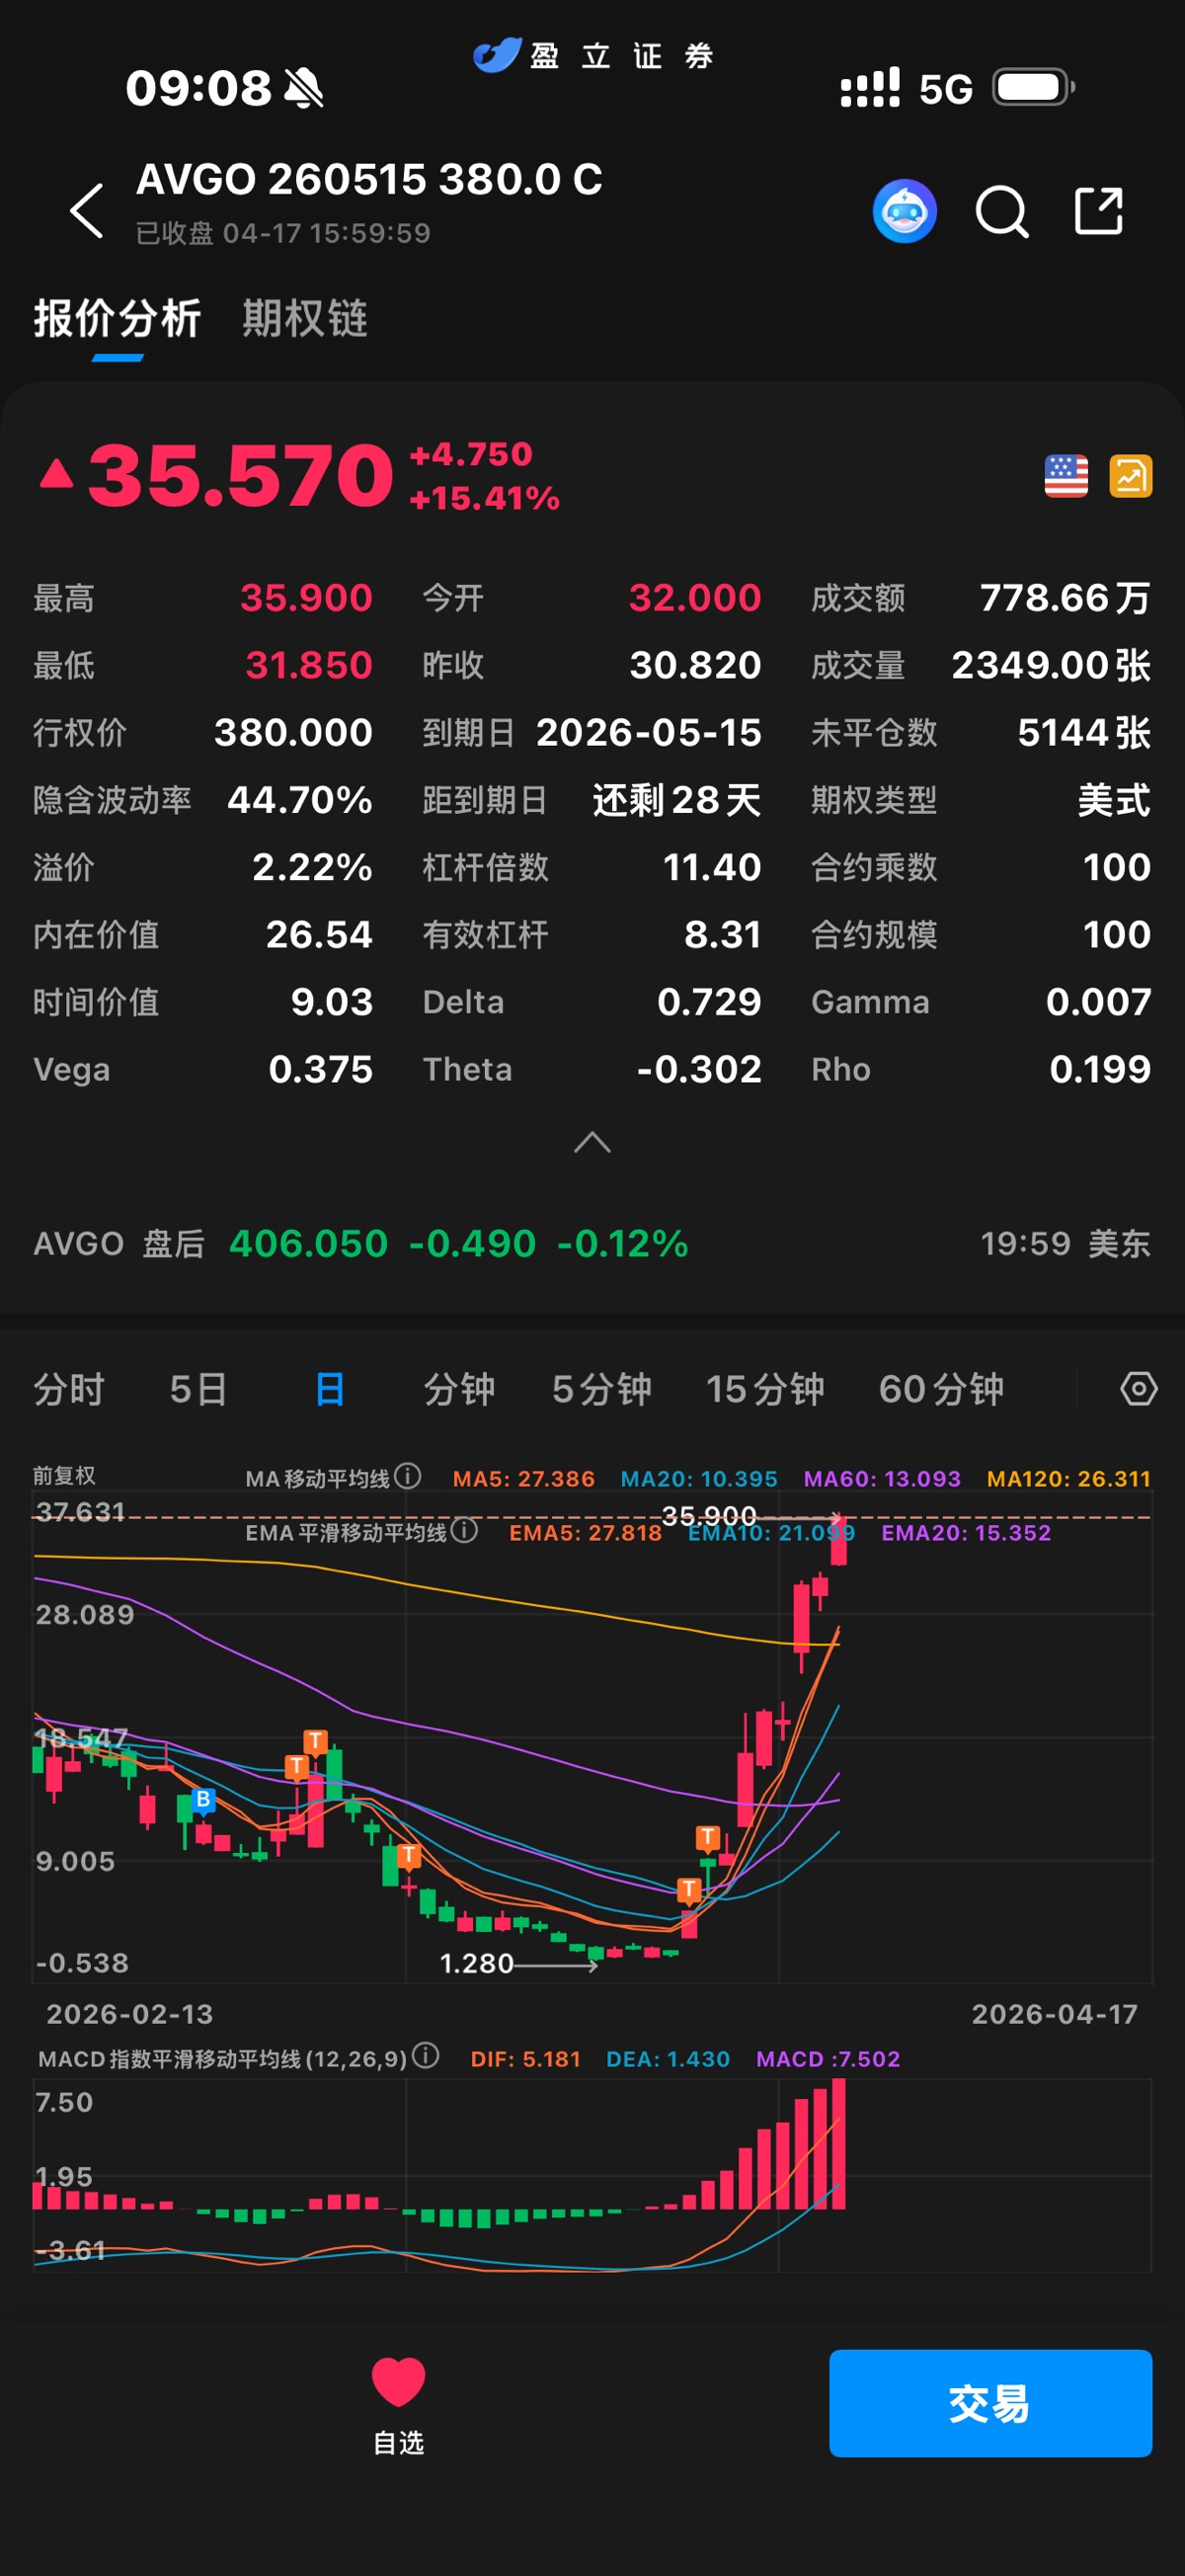
Recommend using MACD to help determine the direction of the trend and the strength of its momentum:
Determining trend direction: When both DIF and DEA are above the 0 axis, it indicates a bullish trend; when both are below the 0 axis, it indicates a bearish trend.
Judging momentum changes:
1. Expanding red bars = increasing bullish momentum, shrinking red bars = weakening bullish momentum.
2. Expanding green bars = increasing bearish momentum, shrinking green bars = weakening bearish momentum.
3. Assisting in divergence judgment: When the price makes a new high/low, but the MACD histogram does not make a corresponding new high/low, it indicates that the trend momentum is weakening and a reversal is possible. This needs to be judged in conjunction with candlestick patterns, trading volume, and support/resistance levels.

海哥周末复盘,愿与诸君共勉。
大家听说过黎明前的黑暗嘛!种种原因很多炒股的兄弟姐妹都是倒在这里,我也不例外。这次复盘跟以往不太一样,今天我们不聊市场环境,不说技术分析,不做未来展望,只是想给大讲个发生在我身上的悲伤故事,而且还是个连续剧。当你在炒股这条路觉得迷茫时,或者坚持不下去了的时候来海哥这里逛逛,看看这篇我自己收藏的第四帖...
 +6
+6
The copyright of this article belongs to the original author/organization.
The views expressed herein are solely those of the author and do not reflect the stance of the platform. The content is intended for investment reference purposes only and shall not be considered as investment advice. Please contact us if you have any questions or suggestions regarding the content services provided by the platform.
