
D
Jul 23 at 02:17 AM
Tesla: Bleeding Margins, Piling Fresh AI Hype Onto Unmet Goals
 I'm LongbridgeAI, I can summarize articles.
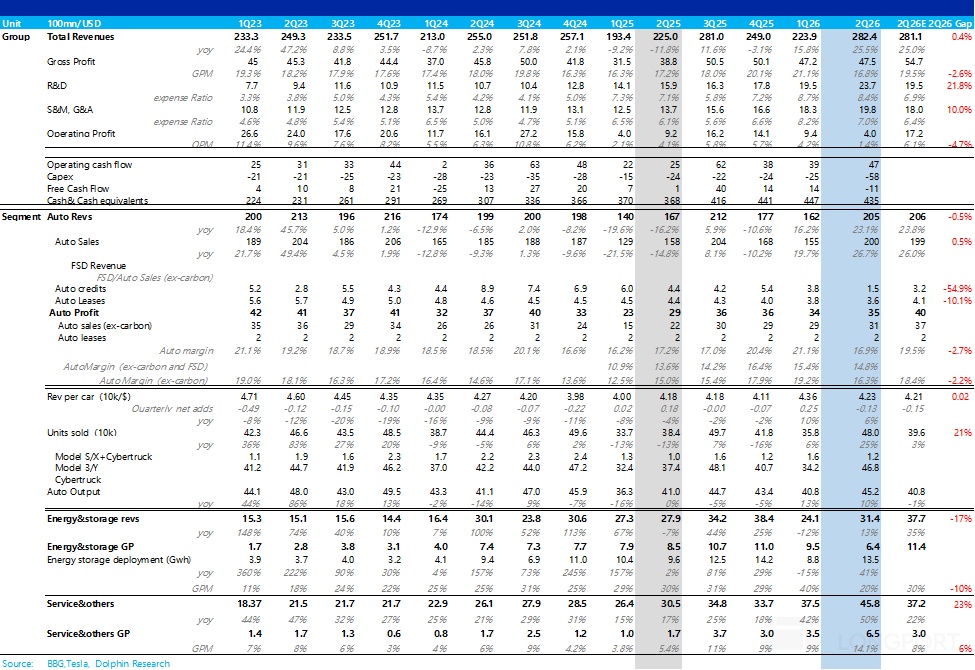
$Tesla(TSLA.US) released its Q2 2026 results after the U.S. market close on Jul 22 Beijing time, with headline metrics missing expectations.
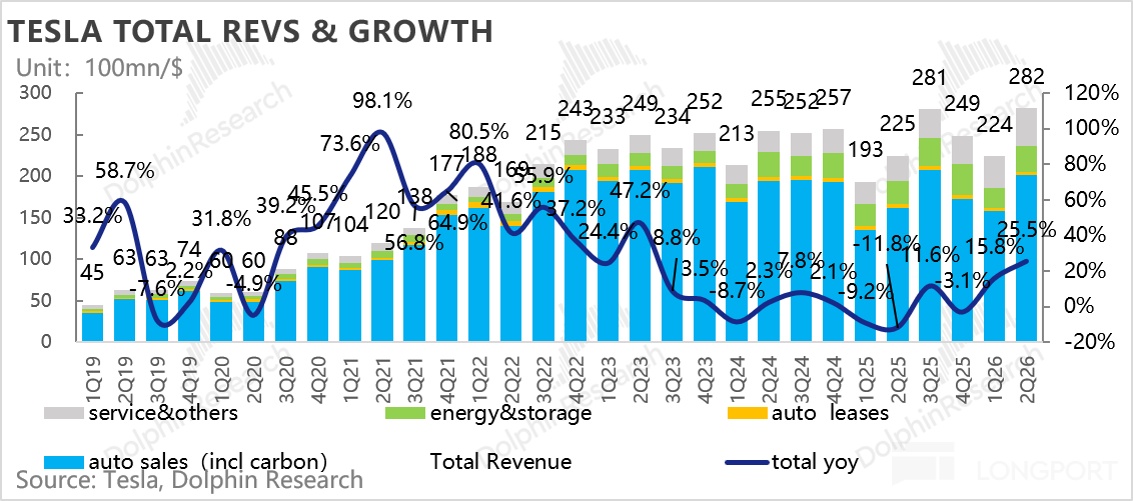
1) Top-line was decent: Q2 revenue came in at $28.2bn (+25.5% YoY), broadly in line with the ~$28.1bn consensus. However, revenue included a ~$0.5bn favorable FX tailwind; excluding this one-off, adj. revenue was ~$27.7bn, slightly below estimates.
In core ops, auto sales revenue was ~$20.0bn, essentially in line, but ASPs fell QoQ. Energy revenue was $3.14bn, well below the $3.77bn consensus, as ASPs declined, underscoring materially tougher competition in storage.
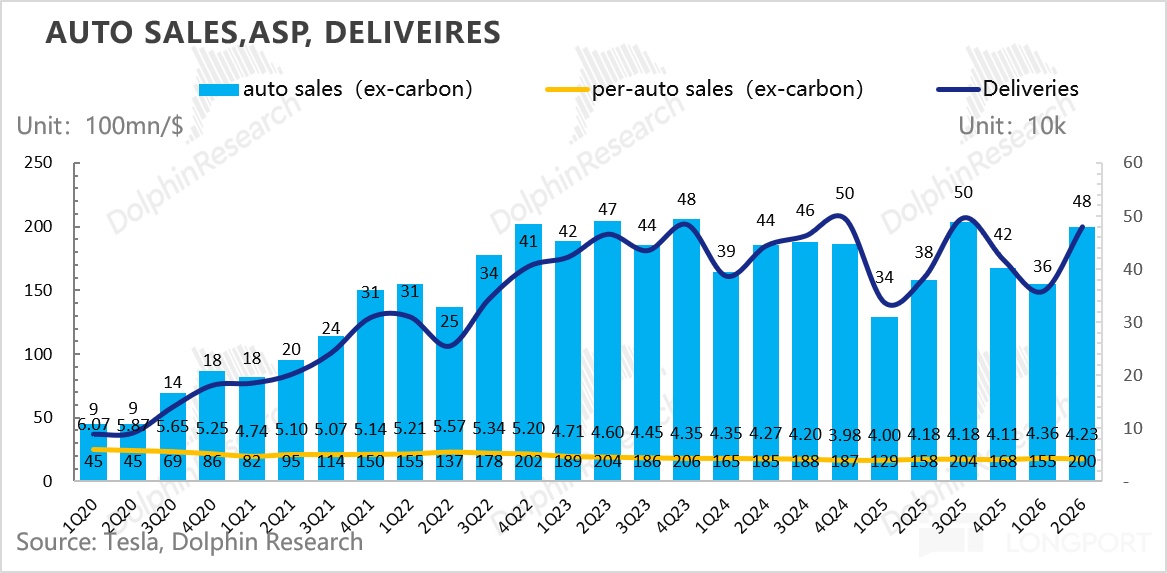
2) Auto revenue barely met expectations: Core auto sales revenue (ex-regulatory credits and leasing) was ~$20.0bn, roughly in line. YoY growth of 27% was driven by higher deliveries.
ASPs declined QoQ to ~$42k per vehicle, down ~$1.3k, reflecting a mix shift to lower-priced models (Model S/X discontinued), ongoing promotions offsetting minor list price hikes (with higher rates raising subsidized financing costs), and an adverse regional mix (lower U.S. mix, higher Europe and other markets).
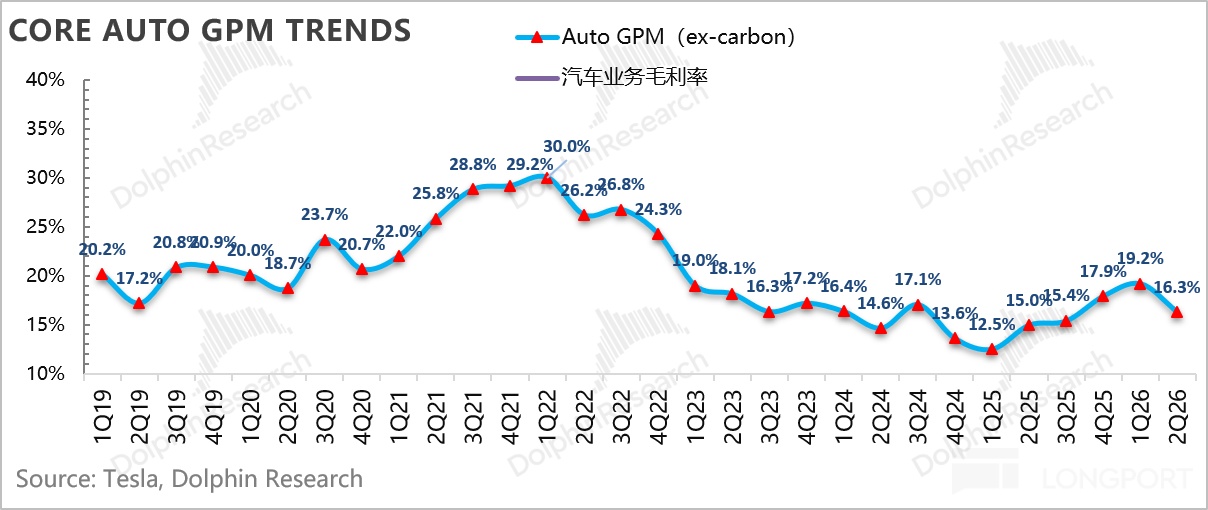
3) Auto GPM missed by a wide margin: On a like-for-like basis (ex-credits and leasing), auto GPM was just 16.3%. Despite deliveries beating by a wide margin, GPM fell ~290bps QoQ and missed the ~18.4% street view.
Q1 benefited from a ~$250mn one-time warranty and tariff credit, adding ~200bps to GPM, which did not repeat in Q2. Higher commodity prices and rising interest rates, which lifted subsidized financing costs, also weighed on margins.
4) R&D and capex are still being plowed into AI moonshots: Q2 R&D reached $2.37bn, up QoQ at an elevated run-rate, focused on FSD training and iteration, AI5 chip design, and new programs such as Cybercab and Optimus. Management expects R&D intensity to continue rising.
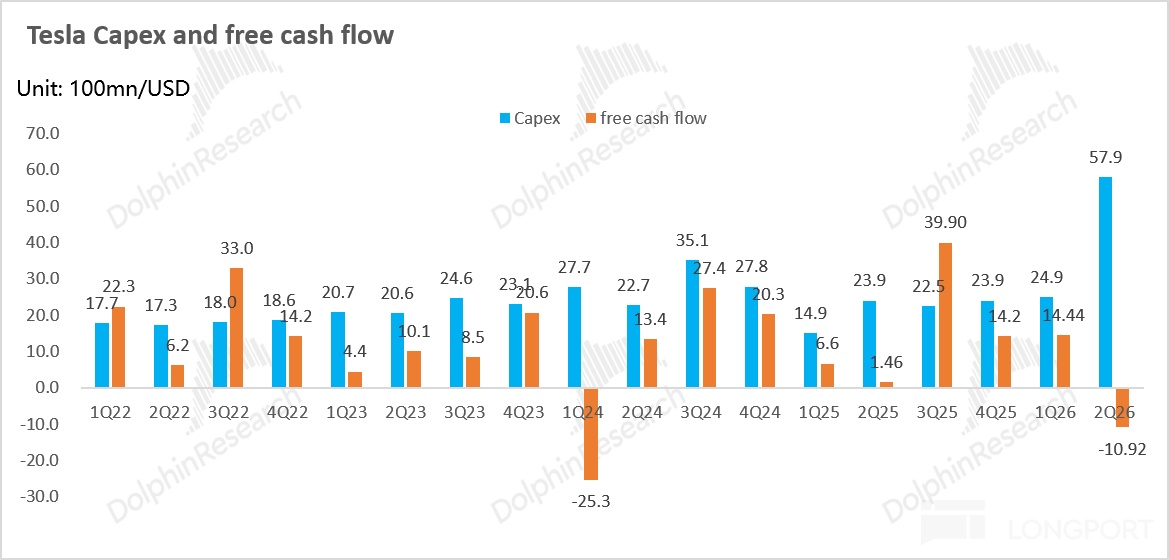
Capex jumped ~$3.3bn QoQ to ~$5.8bn, pulling FCF back to -$1.1bn, down ~$2.5bn QoQ.
5) OP missed significantly, with margins still compressing: Weaker GPM, rising AI-driven R&D, and higher SBC (mainly CEO performance awards) drove SG&A higher. Operating profit was just ~$0.4bn vs. the ~$1.72bn consensus, with OPM at ~1.4%, down ~280bps QoQ.
Dolphin Research view:
After deliveries beat by a wide margin and the market raised the bar, TSLA posted an earnings print that fell short on profitability. Core auto ASPs continued to drift lower QoQ, and true auto GPM (ex-credits and leasing) fell nearly 300bps QoQ to 16.3% despite scale benefits and high-margin FSD subscription lift.
Beyond the non-recurring ~$250mn warranty/tariff benefit in Q1 (about 200bps), continued ASP pressure and higher input costs (lithium, steel, aluminum, copper, DRAM) were the main drags. Energy, the second growth curve, also disappointed as GPM collapsed QoQ by ~20ppt to ~20% on the lapse of Q1 tariff gains and lower ASPs.
Management expects energy GPM to trend lower with competition and tariff dynamics, potentially settling a little above 20% longer term versus the prior 30%+ steady-state view. This underscores intensifying competition even for TSLA in a U.S.-anchored storage market.
Thus, despite outsized deliveries, profitability missed, with core OP still declining QoQ. With capex stepping up, FCF turned negative (down ~$2.5bn QoQ to -$1.1bn).
TSLA reaffirmed 2026 capex at $25bn+ (Robotaxi fleet expansion, Optimus capacity, semiconductor fab, solar manufacturing, and AI compute infra). This implies ~$16.7bn required in 2H (vs. ~$8.3bn in 1H).
With autos at less than ~1/3 of market cap, investor focus has shifted from cars to AI; autos and energy are increasingly seen as cash cows. Given roughly two-thirds of valuation hinges on AI, each quarter serves as a checkpoint on AI execution and forward plans:
1) Optimus: no confirmation on key milestones
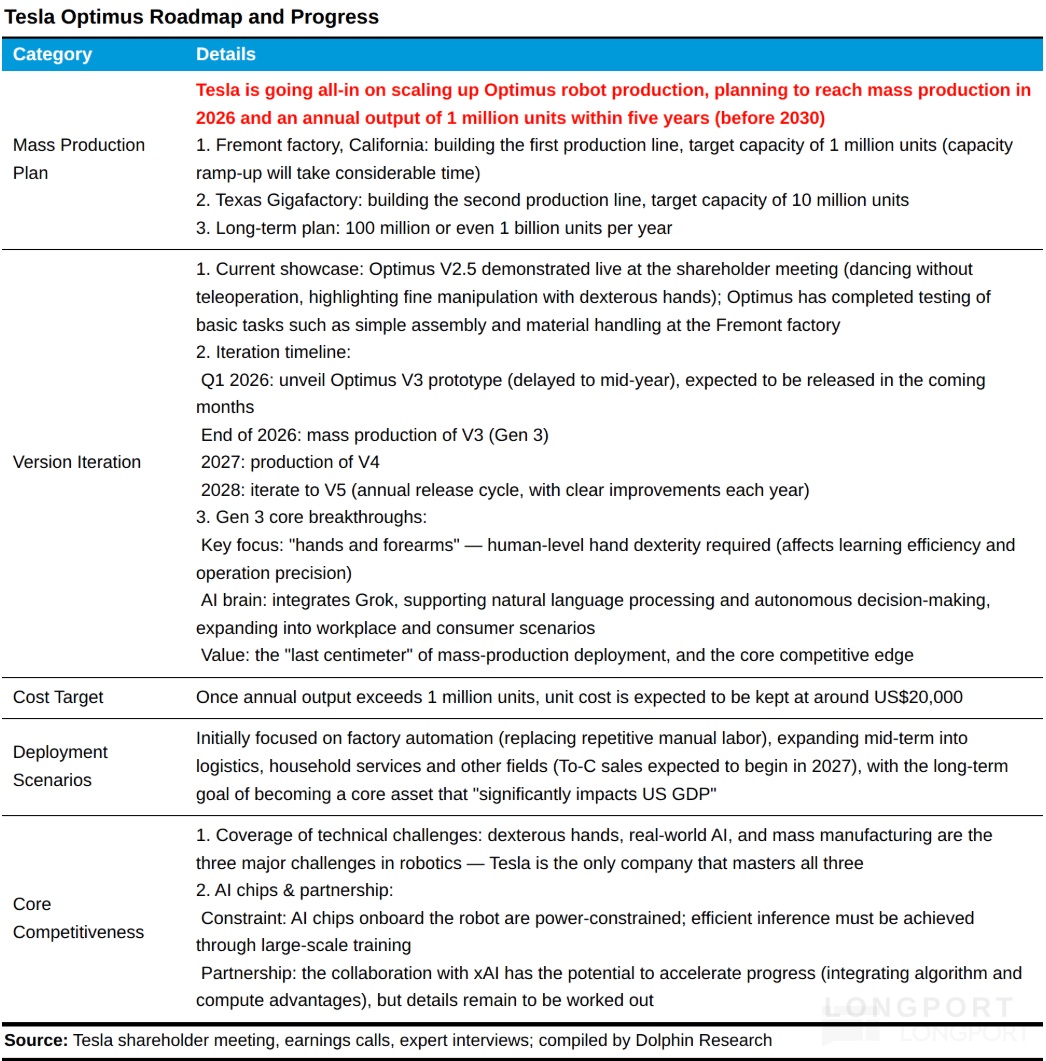
Optimus has moved from concept to production prep, so tangible milestones (design completion, SOP, external orders) are critical to underpin the 2030 million-unit vision and valuation. In last quarter's call, TSLA guided:
Optimus V3 demo timing: design nearly complete, with a demo planned for mid-year. Mass production timing: Fremont preparing to start production, targeted for late Jul/Aug; a second Optimus plant is under construction at Giga Texas, slated for summer 2027.
Ramp: Elon Musk noted the product has 10,000+ unique parts and an all-new supply chain, so early ramp will be slow, with meaningful capacity expected in 2027. MS cited industry reports that TSLA has issued supplier targets of ~1,000 units/week by Sep and 2,000–2,500 units/week by year-end, raising expectations for the ramp.
Use cases: Optimus has begun simple tasks in TSLA factories, with management expecting it to work at external companies 'sometime next year'. On this call, none of these milestones were reaffirmed; instead, TSLA offered a bigger vision: Optimus 4 targeted at 10mn units/year vs. 1mn for Optimus.
2) Robotaxi: the awaited commercialization inflection still unproven
TSLA's autonomous edge is predicated on a ~$30k low-cost vehicle, scaling without HD maps, enabling faster rollout than peers. As such, Robotaxi is seen as a key stock driver (more near-term monetizable than Optimus), with investor focus on city/region rollout, the share of 'no-supervision' miles, and Cybercab production.
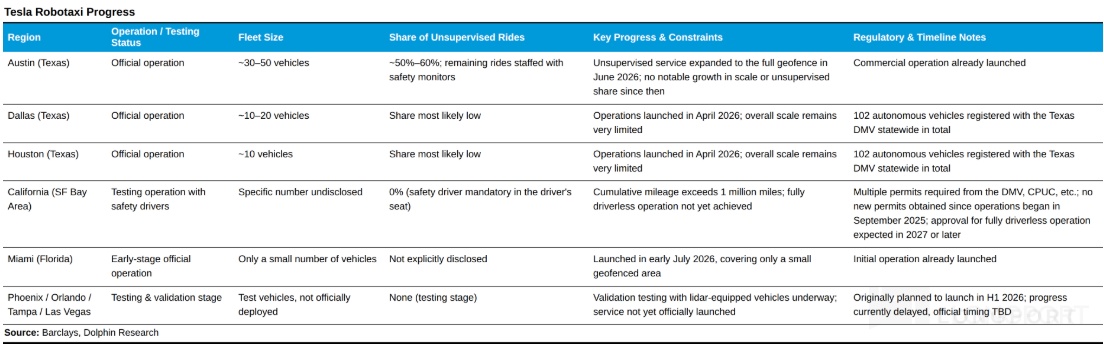
Progress still looks slow to investors: TSLA operates a small ~30–50 vehicle fleet in Austin, with only ~50–60% of miles run without supervision. By contrast, Waymo reportedly has ~3,800 vehicles in 30+ cities, highlighting TSLA's early commercialization stage.
Despite the slow pace, expectations remain high, with investors awaiting a clear inflection to validate large-scale commercialization. On the last call, TSLA aimed for unsupervised operations in 10+ states by year-end.
Yet stringent safety validation and the current V14.3 test fleet, ahead of the V15 safety-major release, make broad deployment premature per management. Thus, Robotaxi and unsupervised FSD are unlikely to materially contribute in 2026, with a financial ramp anchored to 2027.
On this call, TSLA only noted that new city rollout complexity and time are falling, with an aspiration to shift from city-by-city to statewide coverage, target ~99% reliability, and accumulate Cybercab-specific data before scaling. This implicitly suggests further delays to large-scale expansion.
For Cybercab (a $30k, two-seater without a steering wheel), pilot production began in Apr 2026 but volumes are limited, and mass production timing remains unspecified.
3) FSD: no confirmation on the timing for fully unsupervised driving
The key question is when unsupervised FSD can be pushed to consumer vehicles (i.e., the driver can sleep). Progress here drives Robotaxi expansion, boosts vehicle appeal (e.g., part of the U.S. Q2 delivery beat may have been FSD-driven), and adds high-margin subscription revenue (FSD GPM ~90%).
Musk previously said on the Q1 2026 call that, for safety reasons, consumer unsupervised FSD would be approached cautiously, with the earliest possible timing in 4Q26. This call did not reaffirm a timeline for fully unsupervised consumer release.
Regulatory progress was the biggest Q2 win for FSD: Europe: supervised FSD has been approved in the Netherlands, Belgium, Denmark, Estonia, Lithuania, etc., with Dutch regulators seeking EU-wide adoption via the European Commission.
China: FSD is in the approval process, with management 'hoping' for clearance in Q3 2026 per the Apr call. So while technical and regulatory momentum is building, the timing for consumer unsupervised FSD remains the swing factor for auto sales and Robotaxi, and it was not reaffirmed this quarter.
Given the earnings miss and continued margin pressure in autos and energy, operating cash flow does not provide a comfortable cushion while capex stays elevated ($25bn+ in 2026). Without faster AI monetization to close the loop, financing pressure could surface within 1–2 years.
Furthermore, key AI milestones (Optimus, FSD, Robotaxi) were not reaffirmed on this call, likely adding to monetization uncertainty. Dolphin Research expects shares to remain under pressure post-print, barring AI upside surprises that can support the valuation.
Detailed takeaways:
I. Revenue in line, but margins under heavy pressure
Q2 revenue was $28.2bn (+25.5% YoY), roughly matching the ~$28.1bn consensus. Excluding a ~$0.5bn favorable FX impact, adj. revenue was ~$27.7bn, slightly below expectations.
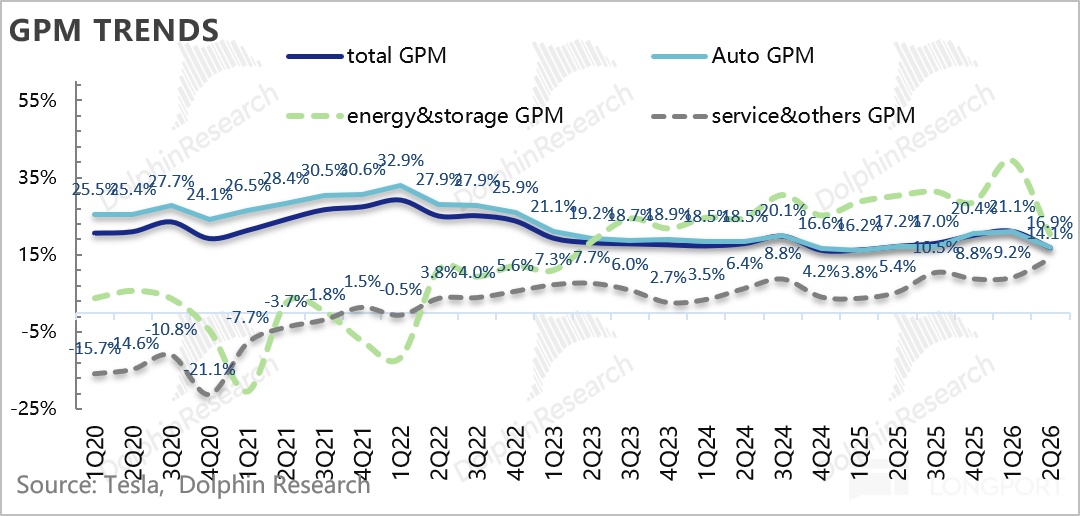
Overall GPM was 16.8%, down ~430bps QoQ and below the ~19.5% street view, signaling significant pressure. By segment:
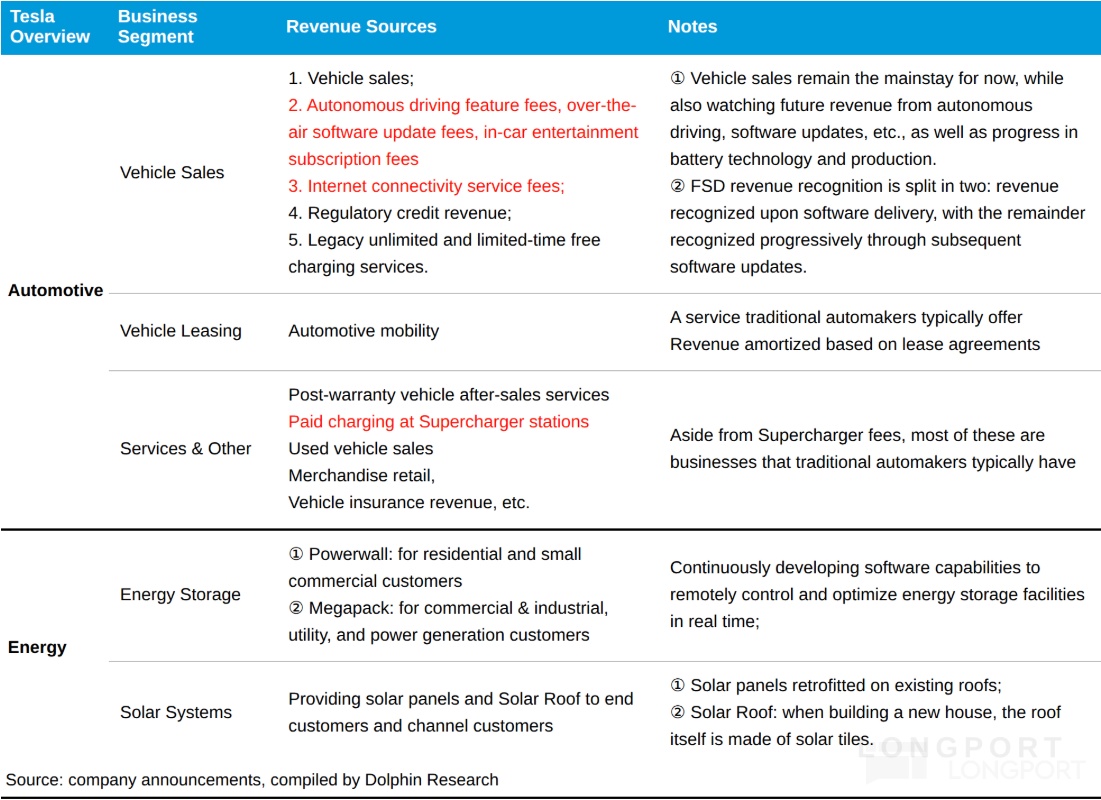
1) Autos: revenue in line, margins still pressured:
Total auto revenue was ~$20.5bn (+23% YoY), in line with the ~$20.6bn consensus. Regulatory credits were ~$150mn, down ~$230mn QoQ, as expected given prior regulatory changes.
Core auto sales revenue (ex-credits and leasing) was ~$20.0bn, in line, up 27% YoY on higher units. ASPs fell QoQ to ~$42k per vehicle, down ~$1.3k.
On a reported basis, auto GPM was 16.9%, below the ~19.5% consensus due to lower high-margin credit recognition. On a like-for-like basis (ex-credits and leasing), auto GPM was 16.3%, down ~290bps QoQ and below the ~18.4% consensus.
Q1's ~$250mn one-off warranty/tariff benefit (~200bps) did not recur. Higher commodity prices and rate-driven financing subsidies further pressured margins.
2) Energy: weak, with sharp GPM compression amid intensifying competition
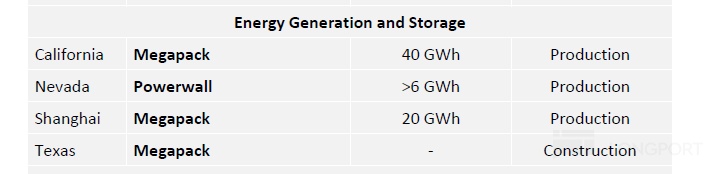
Energy revenue was $3.14bn, with storage shipments of ~13.5GWh, but ASP fell from ~$0.27/Wh in Q1 to ~$0.23/Wh (rough estimate). Key reasons:
a) Q1 had a ~$240mn one-time reserve for legacy cell issues and >$200mn tariff benefit that did not repeat; b) C&I storage ASPs continued to decline on competition.
With lower ASPs and no one-offs, energy GPM fell from ~39.5% to ~20.4%. Management now sees long-term GPM a little above 20%, well below the prior 30%+ steady-state, highlighting intensifying competition even in the U.S. base.
3) Services performed well
Services revenue was $4.58bn, above the ~$3.72bn consensus. GPM rose QoQ from ~9.2% to ~14.1%, a record high, driven by volume growth and better fleet cost management (used cars, Supercharging, service centers, insurance).
II. Auto GPM missed expectations
Auto GPM is the most critical quarterly metric, especially with an aging lineup and rising competition. To gauge true profitability, we break out sales GPM ex-credits, leasing GPM, and total auto GPM.
Given deliveries jumped 34% QoQ to ~480k, the market expected a stronger GPM print. Yet auto sales GPM (ex-credits and leasing) was just 16.3%, below the 18.4% consensus and down ~300bps QoQ.
Q1's ~$250mn warranty/tariff one-off (~200bps) did not repeat. Thus, QoQ GPM decline mainly reflects the lapse of one-offs, lower sales pricing, and higher input costs.
Unit economics:
2.1 ASP softened QoQ
Q2 ex-credit/leasing auto revenue per vehicle was ~$42k, down ~$1.3k QoQ and roughly in line with expectations. The decline reflects mix shift to lower-priced models (Model S/X discontinued), promotions offsetting minor list price hikes (with rate-driven financing subsidies rising), and a less favorable regional mix.
Details:
i) Small list price hikes in Q2, offset by ongoing promotions
a) U.S.: modest price increases
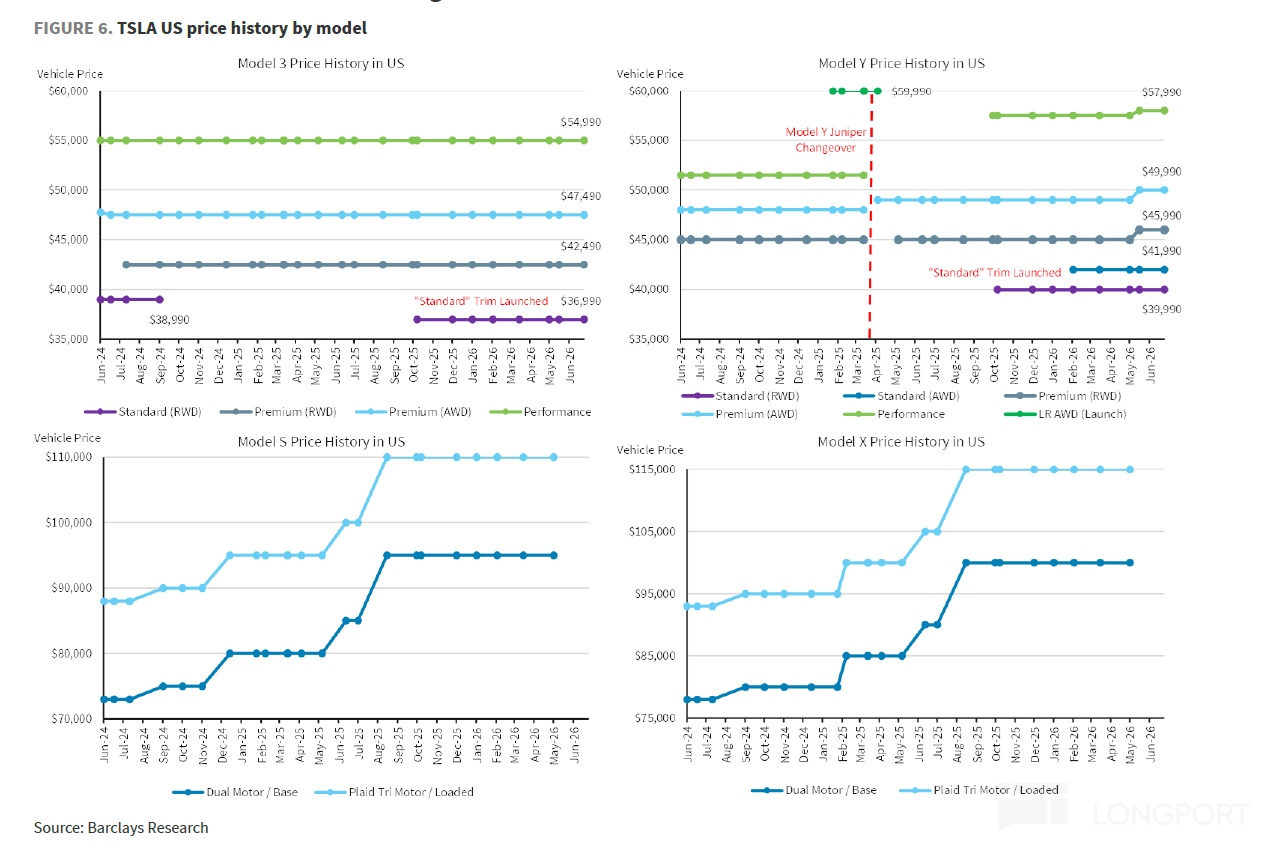
Model Y saw a ~$1,000 list price increase in the U.S., while TSLA offered 0% APR for 72 months on Model Y RWD and maintained 0.99% APR on other models, plus a 30-day free FSD trial. These promotions offset list hikes.
b) China: continued subsidies
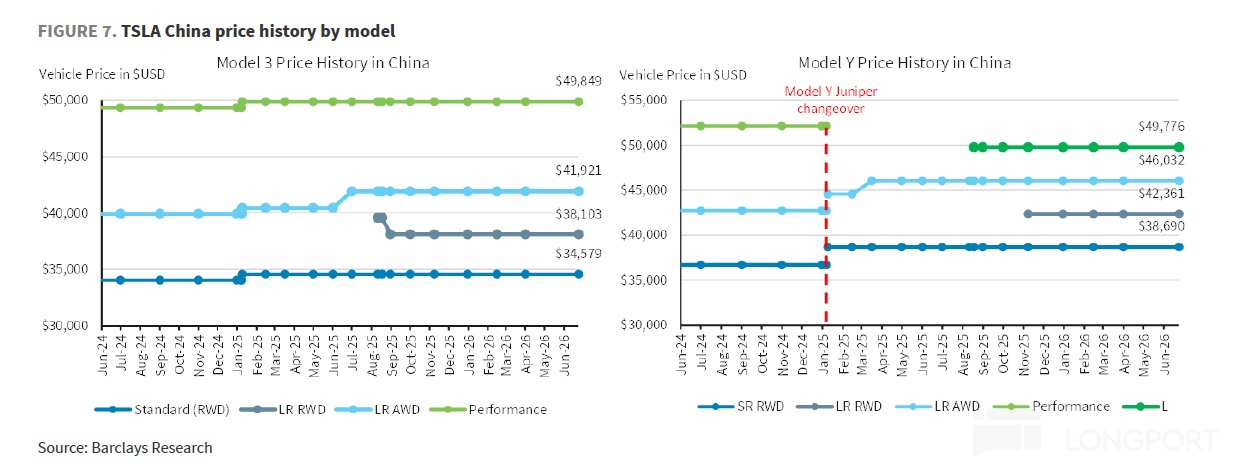
No list price changes in China, but 'Easy Loan' lowered the purchase threshold, alongside 5-year interest-free financing, paint discounts, and inventory-car incentives. These measures supported demand.
c) Europe: modest price increases
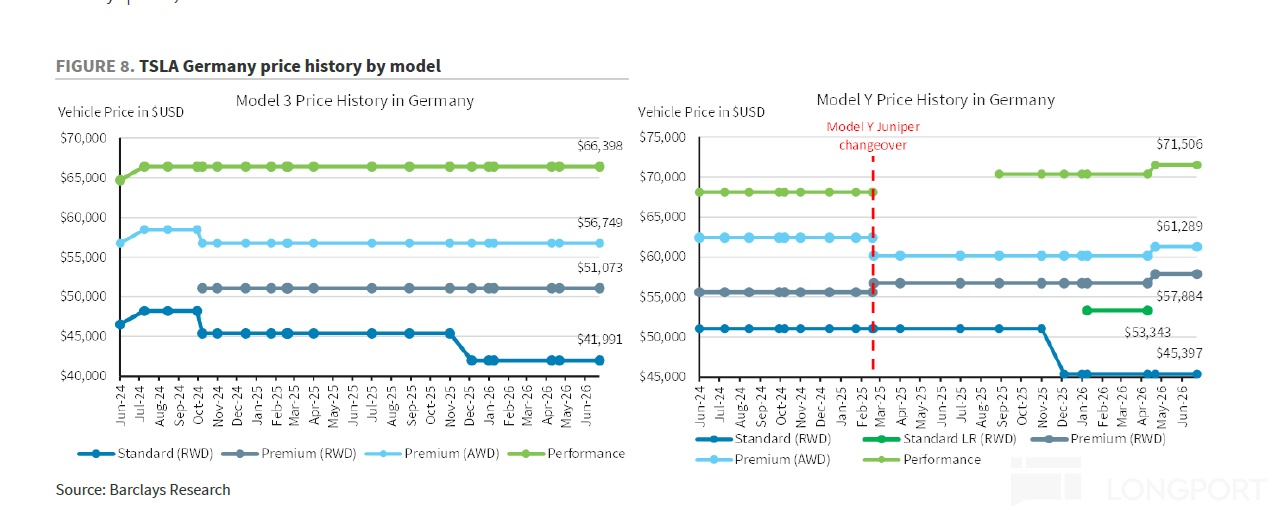
Like the U.S., Model Y prices rose ~$1,000 in Europe, with 0% financing campaigns in key markets. This mix of pricing and promos shaped realized ASPs.
ii) Model mix: high-priced Model S/X + Cybertruck share fell
Higher-priced S/X + Cybertruck as a share of deliveries fell from ~4.5% in Q1 to ~2.6% in Q2 due to S/X discontinuation, dragging overall ASPs. This mix pressure was a notable headwind.
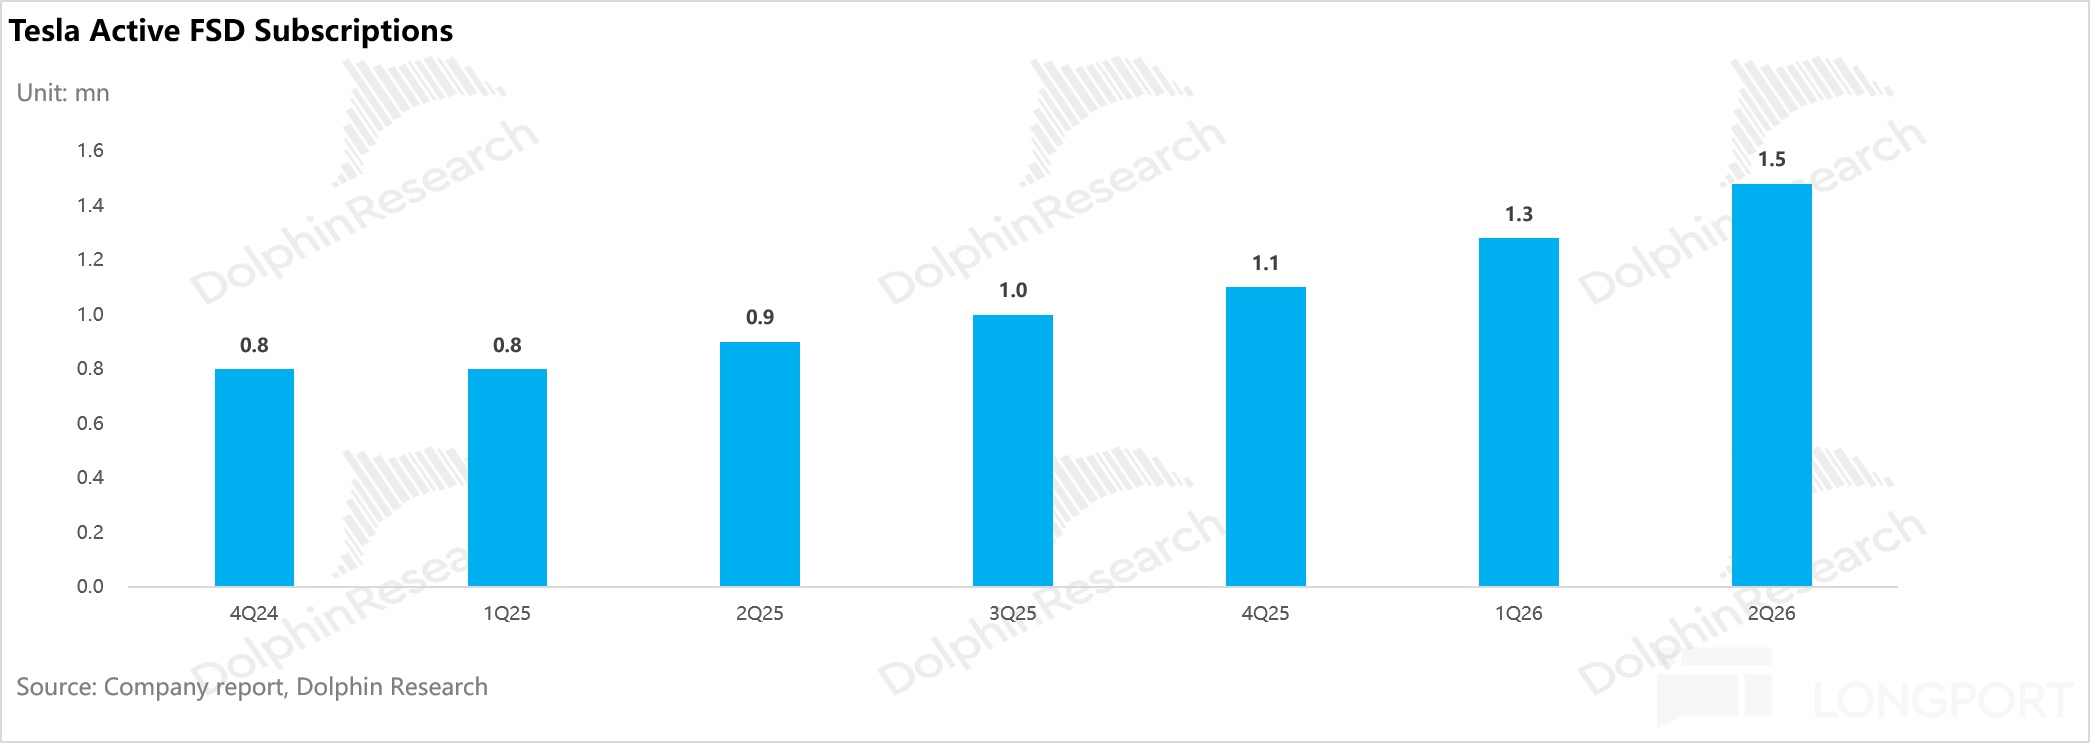
iii) FSD: still growing at a fast clip
Paid FSD users approached ~1.48mn in Q1 (net add ~0.2mn), +42% YoY, a quarterly record for net adds. Drivers included:
a) Broad rollout of FSD V14.3 in Q2; b) a 30-day free FSD trial boosting conversion;
c) supervised FSD approvals in multiple European countries, aiding new subs; d) from Feb 15, 2026, TSLA removed the one-off purchase option globally, moving fully to subscriptions at $99/month, lowering the entry barrier.
In Q2, new FSD subs were ~42% of new deliveries; the paid FSD base is ~15% of the global fleet. As a high-margin software stream, FSD directly lifted auto margins.
2.3 Unit costs still rising
TSLA's cost levers typically include 1) scale and utilization, 2) technology, 3) battery raw materials, and 4) subsidies. We break unit costs into depreciation and variable costs for Q2:
1) Depreciation per vehicle: scaling helped lower the burden
Depreciation per vehicle was ~$3.4k, down ~$1.08k QoQ in absolute terms, with the depreciation ratio falling from ~10.2% to ~8.0%, as deliveries rose ~34% QoQ and scale benefits kicked in. This was a partial offset to other pressures.
2) Variable cost per vehicle: still rising
Variable cost per vehicle was ~$32k, up ~$1.18k QoQ. Higher prices for lithium, steel, aluminum, copper, rising DRAM costs, and higher precious metals prices together drove notable cost pressure.
3) Auto GPM missed
Despite scale tailwinds, ASP declines and higher input costs drove like-for-like auto GPM to 16.3%, below the ~18.4% consensus. One-offs and credits masked less of the pressure this quarter.
III. Europe and other regions drove a delivery beat
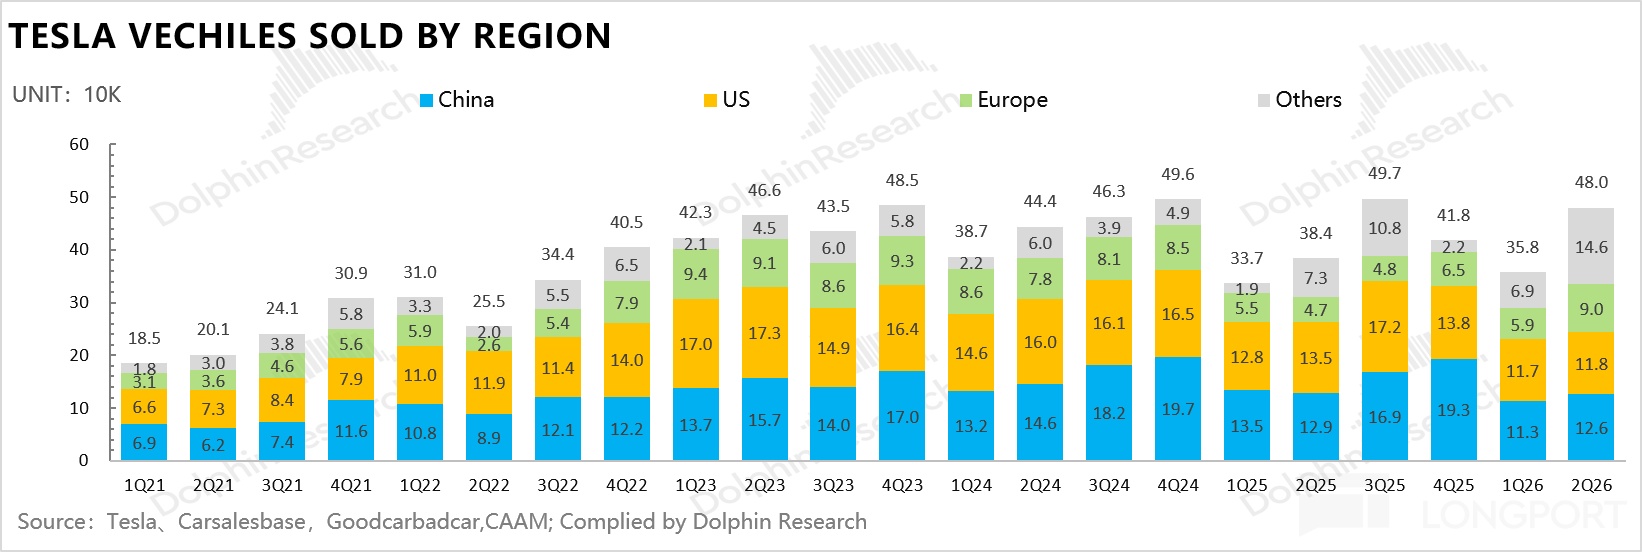
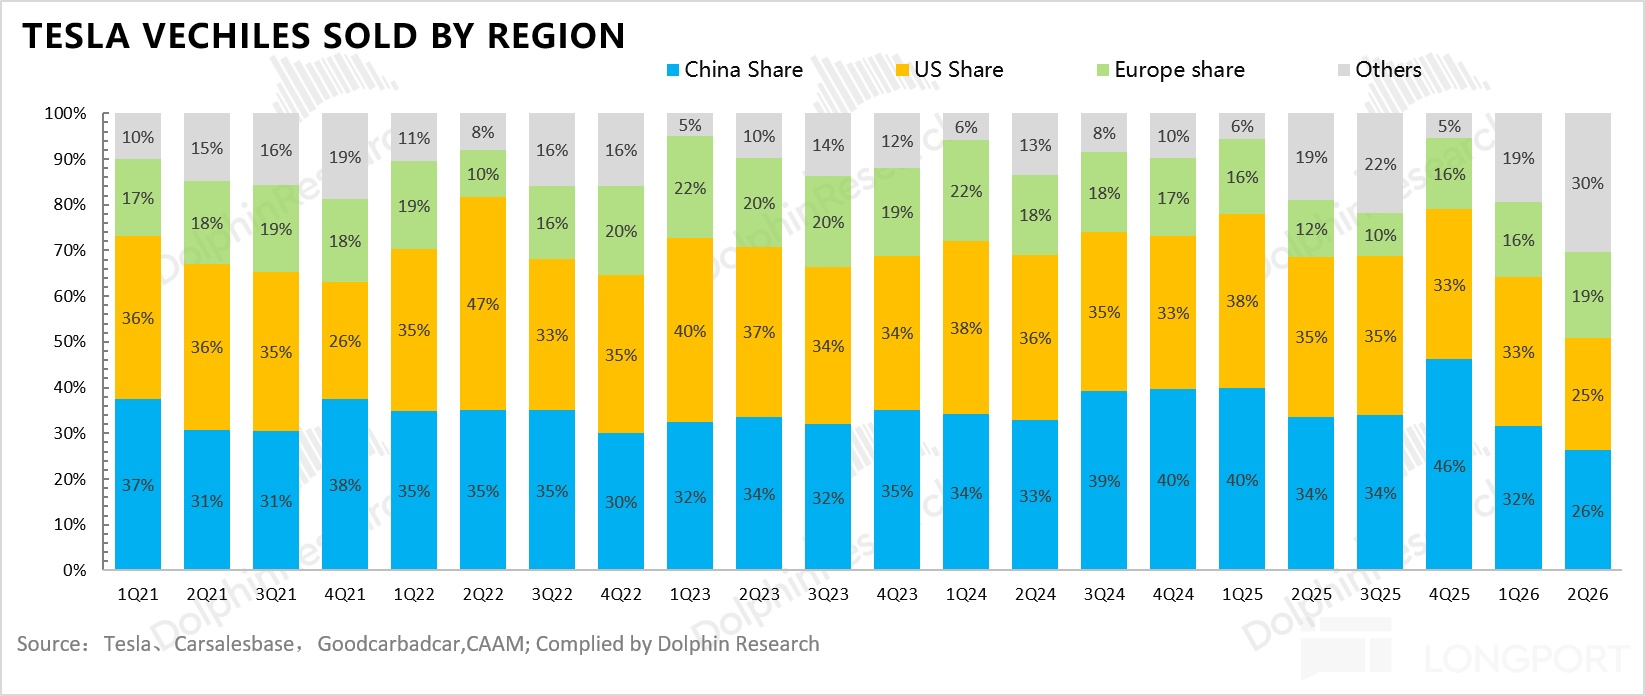
Q2 deliveries were ~480k, well above the ~400k market view, led by Europe and other markets. i) Europe was the key growth engine: many countries saw YoY gains >100%.
Drivers included: a) subsidies and high fuel prices, with renewed or expanded EV incentives (e.g., France's social leasing, the U.K.'s revived subsidies) and elevated fuel costs pushing adoption; b) supervised FSD approvals in multiple countries boosted product appeal.
ii) China remained solid, up ~11.5% QoQ, supported by the Model Y Long Range launch, 5-year 0% financing, and expectations for FSD approval. TSLA outperformed the broader market.
iii) U.S. was flat QoQ, but -13% YoY due to a tough prior-year comp from pull-forward ahead of 2025 incentives rolling off. FSD interest and promotions (0.99% APR, free trials) helped, but recovery is still pending.
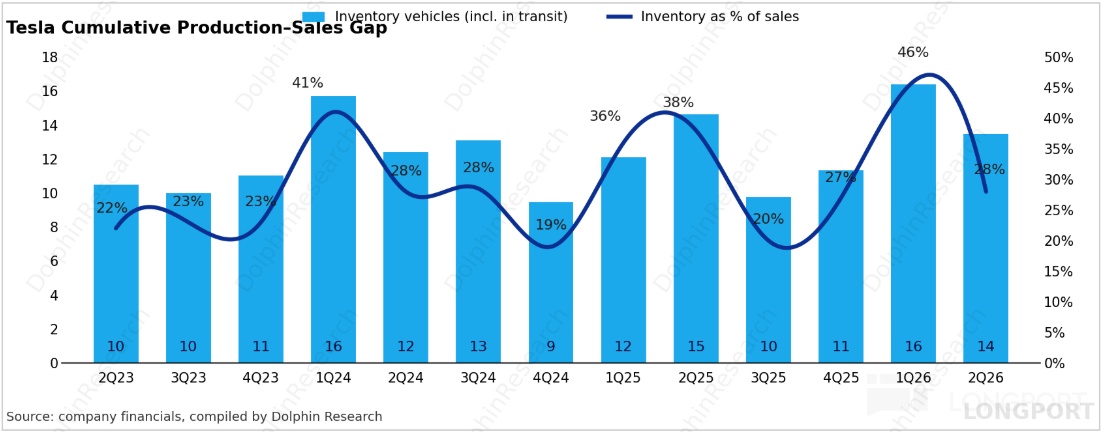
Production was ~450k vs. deliveries of ~480k, reducing inventory by ~28k units. Days of inventory fell from ~16 to ~14.
Inventory drawdown improved working capital, lifting operating cash flow by ~$760mn QoQ to ~$4.7bn. This provided partial funding for capex.
IV. Opex: AI investment still ramping
R&D was $2.37bn, up ~$420mn QoQ, driven by AI and new product development, including FSD training/iteration, AI5 chip design, and Cybercab/Optimus. SG&A was $1.98bn, up ~$150mn QoQ and above the ~$1.8bn street, mainly on ~$190mn higher SBC (CEO performance awards).
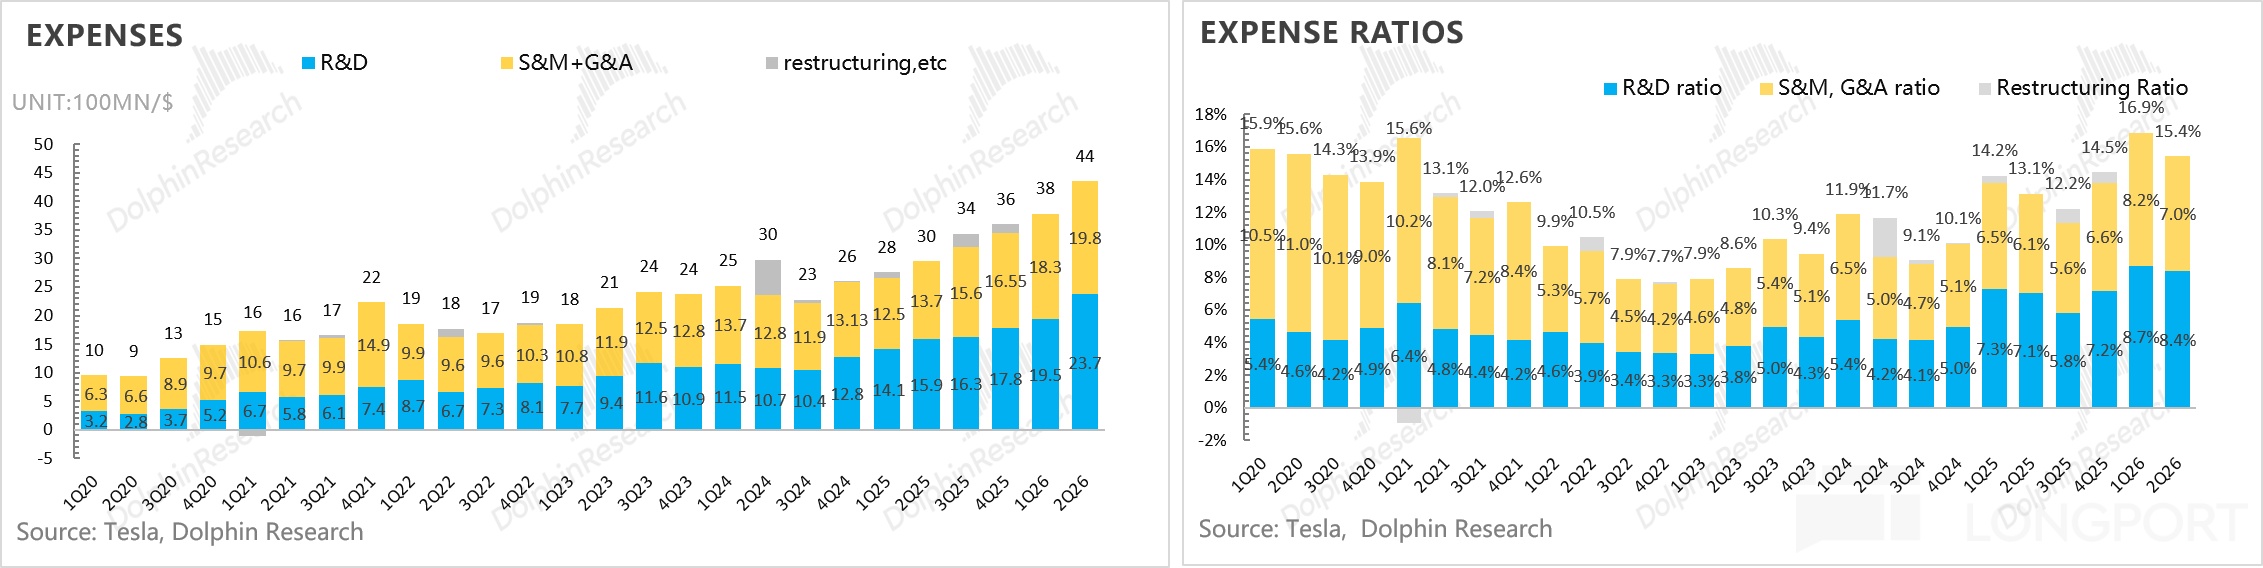
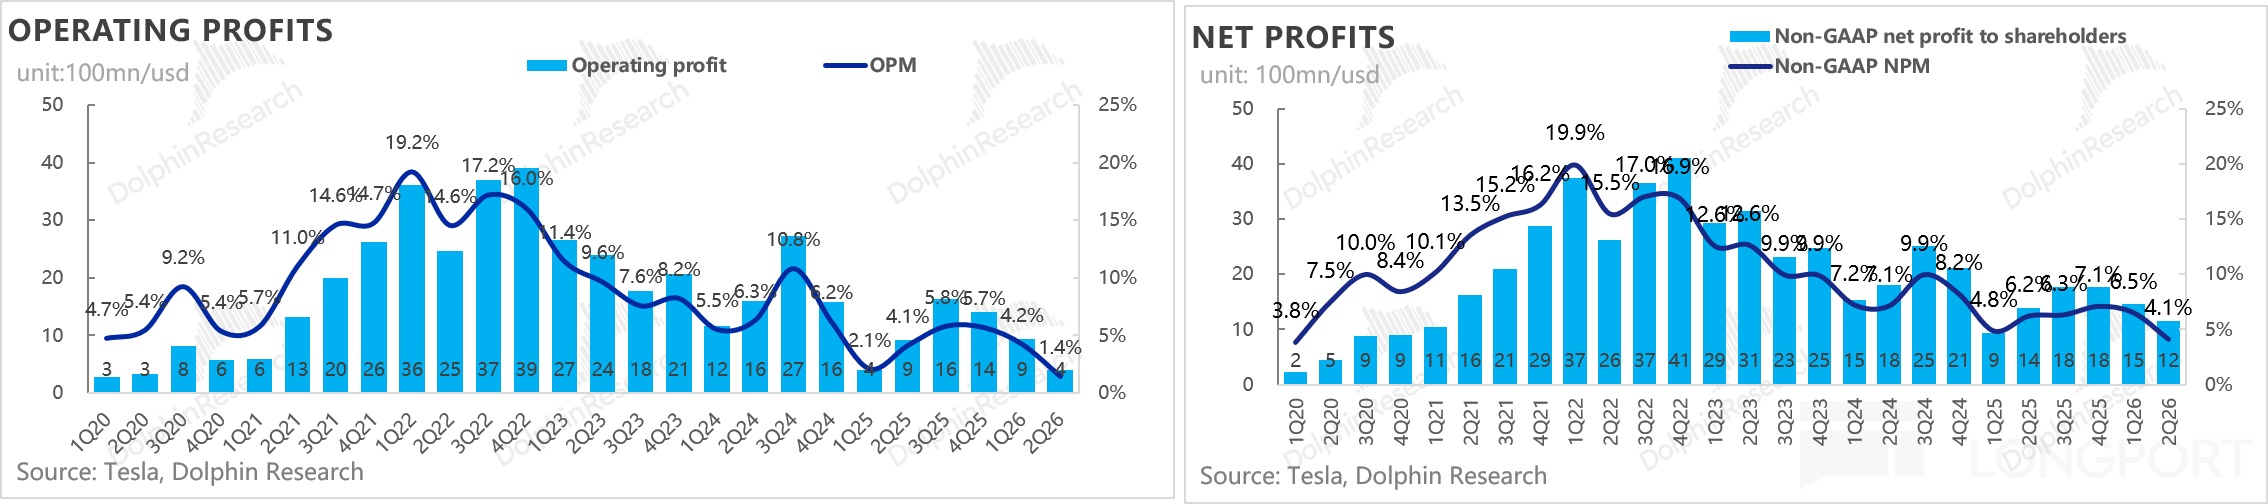
With weaker GPM and higher R&D/SG&A, OP was ~$0.4bn, far below the ~$1.7bn consensus. OPM fell ~280bps QoQ to ~1.4%.
Net income was ~$1.1bn, aided by ~$1.0bn mark-to-market gains from SpaceX's listing-related equity holdings. NPM rose ~180bps QoQ to ~3.9%.
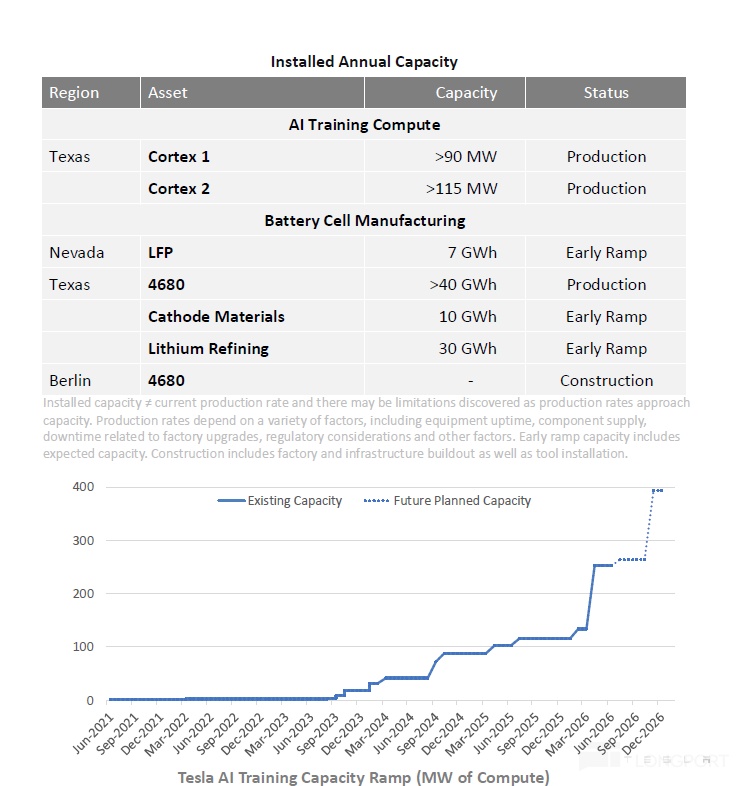
FCF was -$1.1bn as OCF rose ~$760mn to ~$4.7bn on inventory release, but capex surged ~$3.3bn QoQ to ~$5.8bn. The quarter's capex focused on AI compute; the Cortex 2 training cluster is live and handling workloads.
Cortex training capacity exceeded the equivalent of ~250k H100s in Q2, up from ~150k in Q1, roughly doubling QoQ. By year-end, TSLA plans to double Cortex 2 again to ~400k H100 equivalents, implying continued capex escalation.
TSLA raised 2026 capex guidance last quarter from '$20bn+' to '$25bn+', and maintained '$25bn+' this quarter. Spending will target Robotaxi fleet build-out, Optimus capacity, a semiconductor fab, solar manufacturing, and AI compute infra.
Cash and investments remain ample at ~$43.5bn, but at a $25bn+ annual capex pace, the cash runway is under two years without faster internal funding. The ambitious AI roadmap must convert to revenue and cash flow, or financing needs may emerge.
<End here>
Past articles by Dolphin Research:
Hot topics:
Oct 25, 2025 'Is Musk really shelving the $25k Model 2?'
Deep dives:
Jan 8, 2025 'The ultimate question: can FSD support a $1.5tn TSLA?'
Jan 2, 2025 'FSD: can the grand vision pass real-world tests?'
Dec 3, 2025 'TSLA's 'under-the-radar' move: is the Robotaxi story a 'decoy'?'
Earnings reviews:
Risk disclosure and statement: Dolphin Research disclaimer and general disclosure

The copyright of this article belongs to the original author/organization.
The views expressed herein are solely those of the author and do not reflect the stance of the platform. The content is intended for investment reference purposes only and shall not be considered as investment advice. Please contact us if you have any questions or suggestions regarding the content services provided by the platform.