
SanDisk's results are announced tomorrow; the break-even line was drawn today.
 I'm LongbridgeAI, I can summarize articles.
On 08.04, three companies reported earnings. The prices the market set for them side by side essentially put a clear price tag on how certain the market is about each.
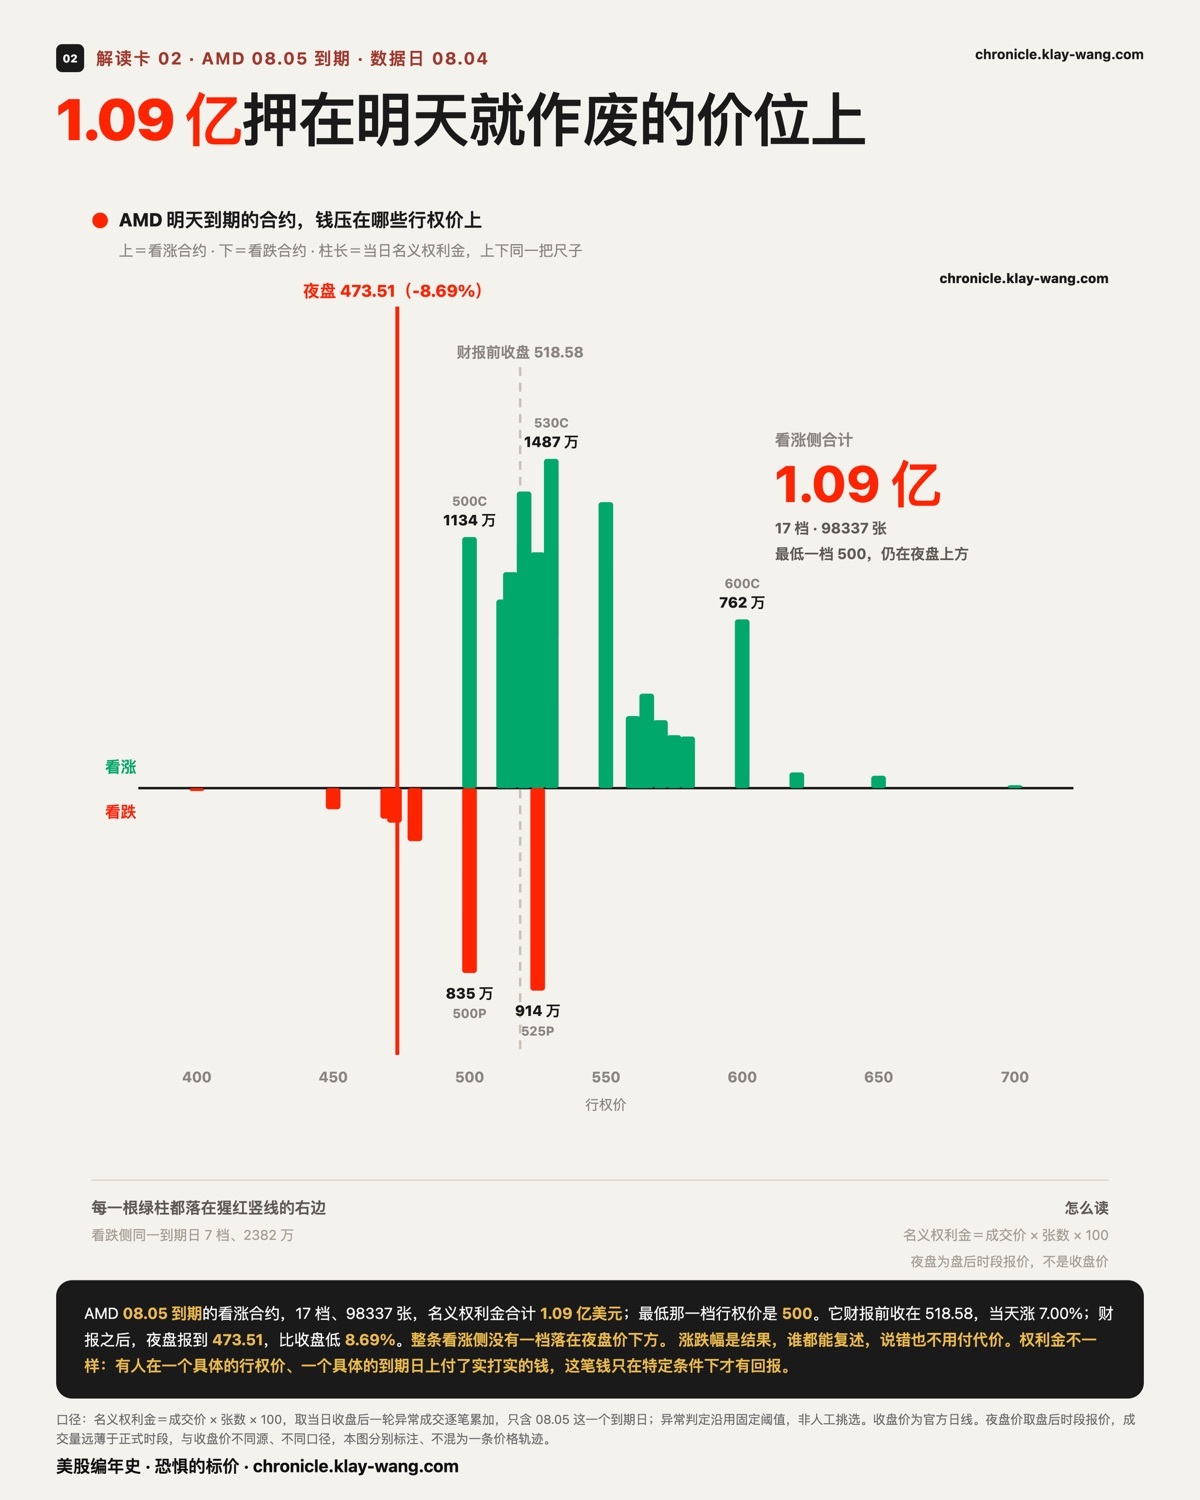
$109 million bet on a strike price that expires on 08.05.
In short: This money isn't an opinion; it's a cost, and it settles on 08.05.
First, why focus on premiums rather than price changes. Price changes are already realized results; anyone can recount them, and there's no penalty for being wrong. Premiums are different: someone paid real money at a specific strike price and a specific expiration date. This money only yields returns in specific scenarios, so it represents a priced, falsifiable proposition.
In the closing data for 08.04, for AMD options expiring on 08.05 (i.e., 08.05) with strike prices above $500, there were 17 strikes, totaling 98,337 contracts, with combined premiums of $109 million. For the same expiration date, the put side had 7 strikes, 32,935 contracts, and $23.82 million, just over one-quarter of the call side.
AMD's earnings report came out after the close. The pre-market latest price was $473.51.
If AMD closes around $473 on 08.05, this $109 million will shift entirely from one side to the other.
This sentence needs to be written carefully because it touches on our editorial red line. We do not know who paid this money or which side they bet on. Buying calls to bet on upside and selling calls to collect premiums are two completely opposite actions that look identical in trade records.
All we can say is: regarding the proposition that AMD closes above $500 on 08.05, the market traded $109 million in premiums. Who wins and who loses will be answered by the 08.05 close; this is zero-sum money.
Incidentally, let's settle the account for 08.03. On 08.03, we noted that among abnormal trades expiring within two weeks, AMD and SpaceX accounted for 60.6% of all premiums, with 22 trades each, totaling $147 million. At that time, we wrote that they would submit their results after the 08.04 close and reconcile on 08.05.
AMD. Last price before earnings: $518.58. For the 08.05 expiration, the expected volatility range given by two intraday readings was around ±7%. The pre-market price was $473.51, representing an actual move of 8.69%. This is about 20% more than the priced expectation; the ruler wasn't long enough.
SpaceX. Last price before earnings: $125.33. For the 08.07 expiration, both readings were around ±14.4%, double that of AMD. The pre-market price was $115.60, an actual move of 7.76%, roughly half of the priced expectation.
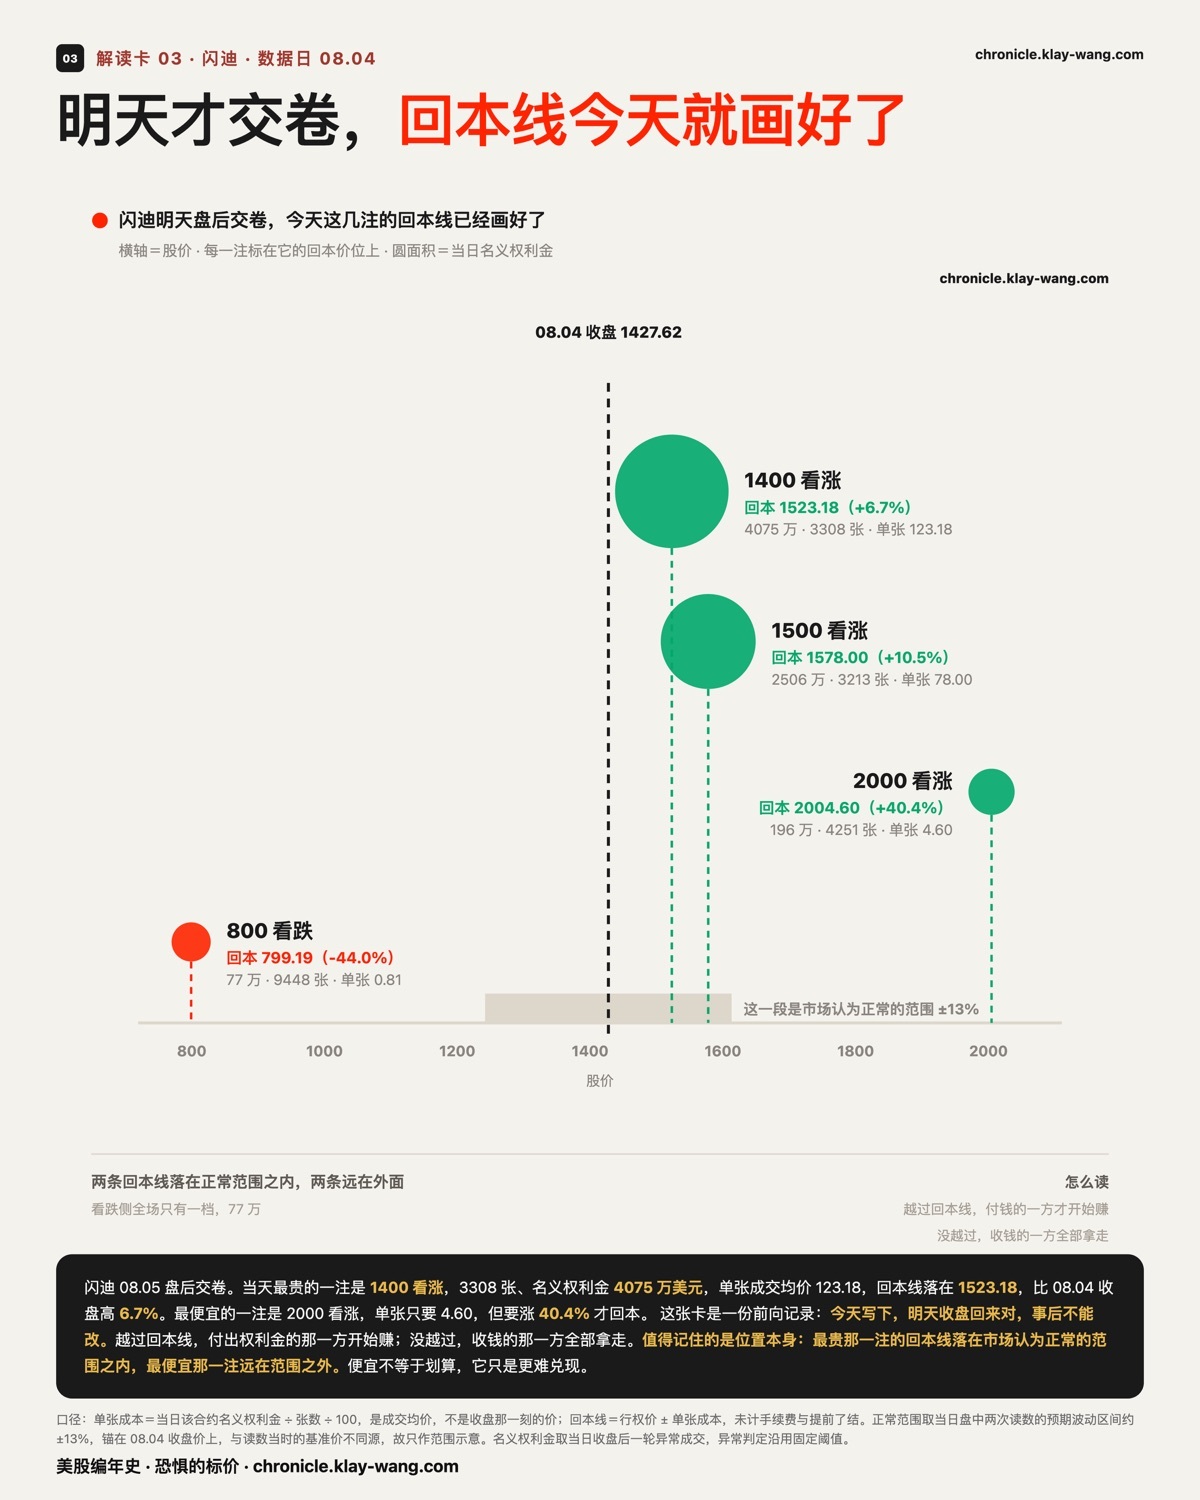
This section is a forward-looking record, written on 08.04 and verified on 08.05; it cannot be changed retroactively.
The most expensive bet was on SanDisk, which wouldn't submit its results until after the 08.05 session.
For the 08.07 expiration, the call side had three strike prices with combined premiums of $67.76 million. The put side had only one strike at $0.77 million. The call side was 88 times larger than the put side.
Laying out these three strikes, the breakeven line for each can be calculated. The cost per contract is the total premiums divided by the total contracts, i.e., the weighted average price, not the price at the moment of close:
Strike | Contracts | Premium | Cost/Contract | Breakeven | Dist. from 08.04 Close ($1427.62)
1400 Call | 3308 | $40.75M | $123.18 | $1523.18 | +6.7%
1500 Call | 3213 | $25.06M | $78.00 | $1578.00 | +10.5%
2000 Call | 4251 | $1.96M | $4.60 | $2004.60 | +40.4%
800 Put | 9448 | $0.77M | $0.81 | $799.19 | −44.0%
The meaning of the breakeven line: once the stock price crosses this line, the party that paid the premium starts to profit; if it doesn't cross, the party that collected the premium keeps everything. Both sides are listed here; we make no assumption about which side holds what.
Interestingly, the 2000 call strike. It costs only $4.60 per contract, but SanDisk must rise 40.4% within three days to break even. 4,251 contracts, $1.96 million. This is the cheapest yet hardest-to-realize bet in the entire market.
And the market's expected volatility range for this SanDisk strike was around ±13%. That means the breakeven for the 1400 strike (+6.7%) falls within the range the market considers normal, the 1500 strike (+10.5%) is also inside, but the 2000 strike (+40.4%) is far outside.
These three lines are pinned here as of 08.04. We will check on 08.05 close which ones were breached.
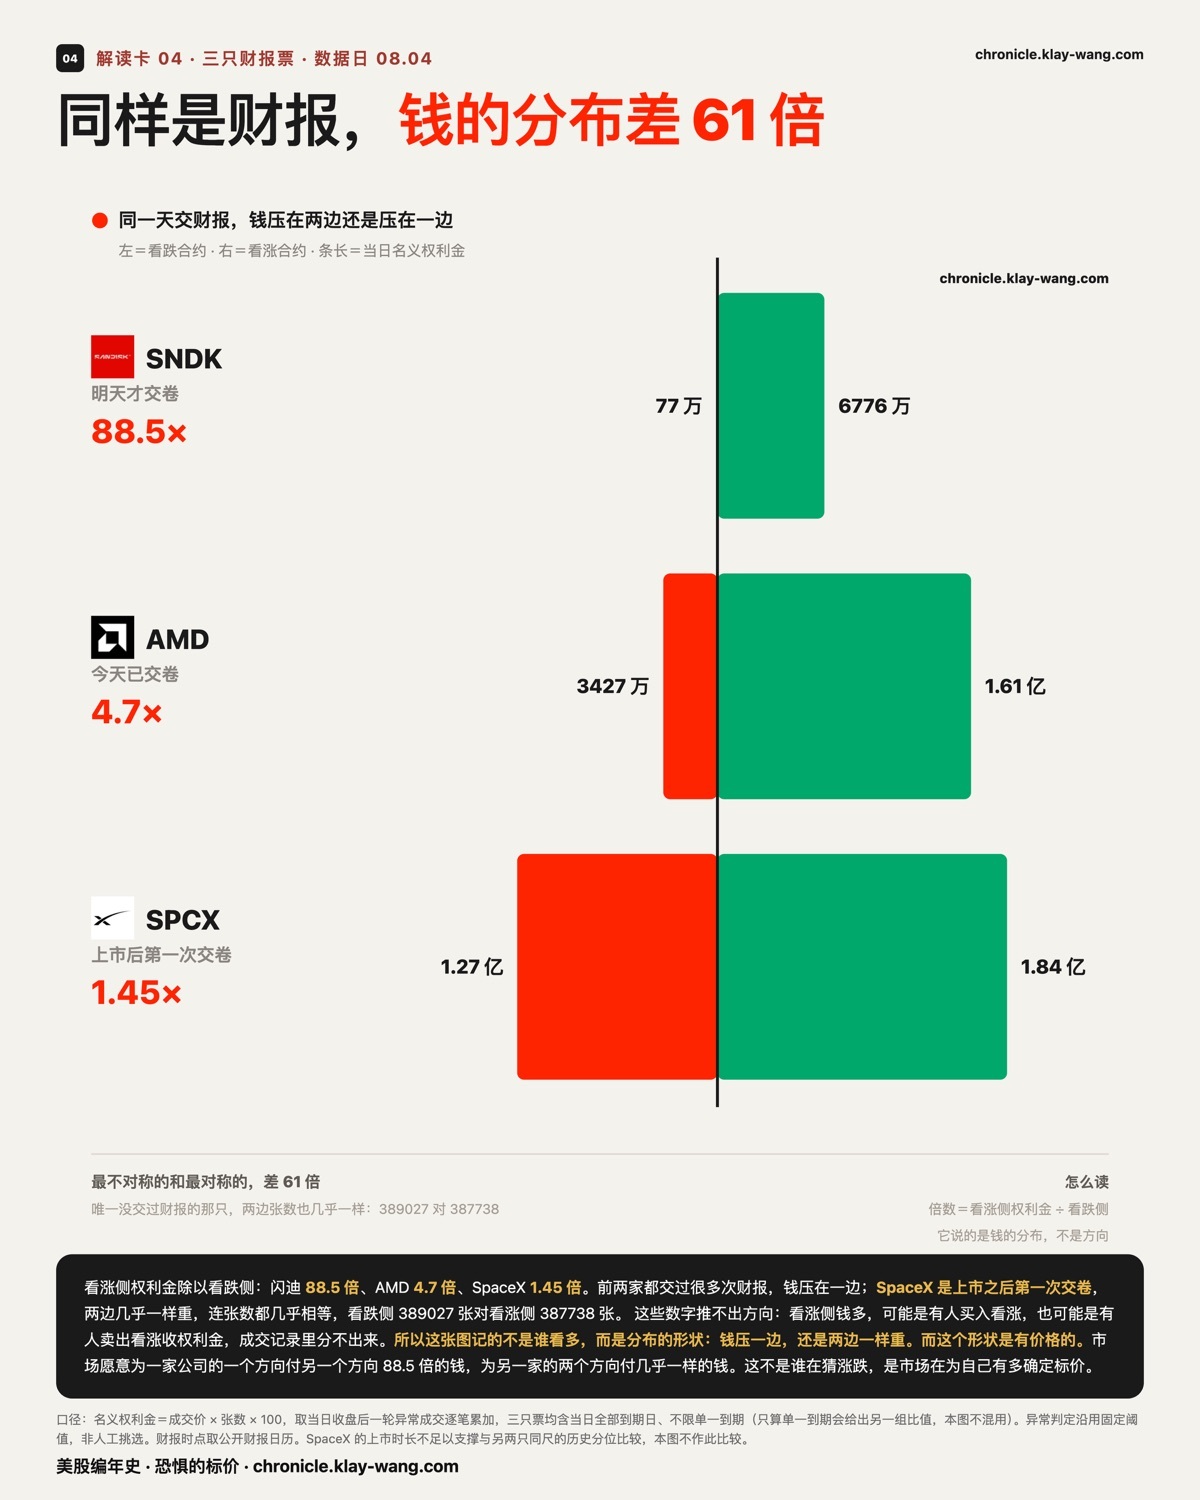
Same earnings reports, but money distribution differs by 61x.
In short: The market prices companies with historical precedents and those without any history using completely different methods.
Putting the three earnings bets together, looking at only one number: call-side premiums divided by put-side premiums. All figures taken from the 08.04 close perspective.
Call Side | Put Side | Ratio | Times Reported Earnings
SanDisk | $67.76M | $0.77M | 88.5x | Multiple
AMD | $161M | $34.27M | 4.7x | Multiple
SpaceX | $184M | $127M | 1.45x | Never
The difference between the most extreme and the most balanced is 61 times.
Perspective note: This table takes all abnormal trades for the day, regardless of expiration. The $109 million mentioned earlier only counts the 08.05 expiration for one stock; it's two different cuts of the same stock. Both numbers are correct; don't mix them up.
SpaceX has another detail: in terms of contract volume, the put side is actually larger than the call side, 389,027 vs. 387,738, a difference of less than 0.4%. However, the money is heavier on the call side. This indicates that the put side bought cheaper, further-out-of-the-money contracts. Heavy money is pressed on both directions, and the magnitudes are comparable.
Another number that better illustrates the point: the price range covered by this money. SpaceX's abnormal trades spanned 61 strike prices, with the lowest at 48.1% below the close and the highest at 163.3% above, a spread of 211 percentage points. AMD had 33 strikes, from 22.9% below to 35.0% above, a spread of 58 percentage points. SpaceX's money is spread 3.6 times wider than AMD's, and its total premiums of $310 million are 59% higher than AMD's $195 million, making it the largest single stock on 08.04.
The most extreme strike was the 330 call, with 98,953 contracts (the highest volume in the market), costing only $0.24 per contract, betting on a 1.6x increase within three days.
It is the only one among the three reporting earnings for the first time since going public. The market has no historical reference, so money is pressed on both sides and spread everywhere. The market has at least a consensus range for AMD, but not even a range for SpaceX.
Reiterating that line: these numbers do not imply direction. More money on the call side could mean someone bought calls, or someone sold calls to collect premiums; the trade record doesn't distinguish. So this section records not who is bullish or bearish, but the shape of the distribution: money pressed on one side, or equally heavy on both.
This shape itself contains information, and it has a price. The market is willing to pay 88.5 times more for one direction of SanDisk than the other, and almost the same for both directions of SpaceX. This isn't about guessing ups and downs; it's the market pricing its own certainty.
This judgment can be overturned, with conditions stated here. If SpaceX's next earnings show sides still close to 1:1, then it has nothing to do with the first report and is inherent to this stock's shape; this point is withdrawn. If SanDisk's next earnings ratio drops to single digits after the 08.05 results, then the 88.5x was merely a one-time anomaly; similarly withdrawn.
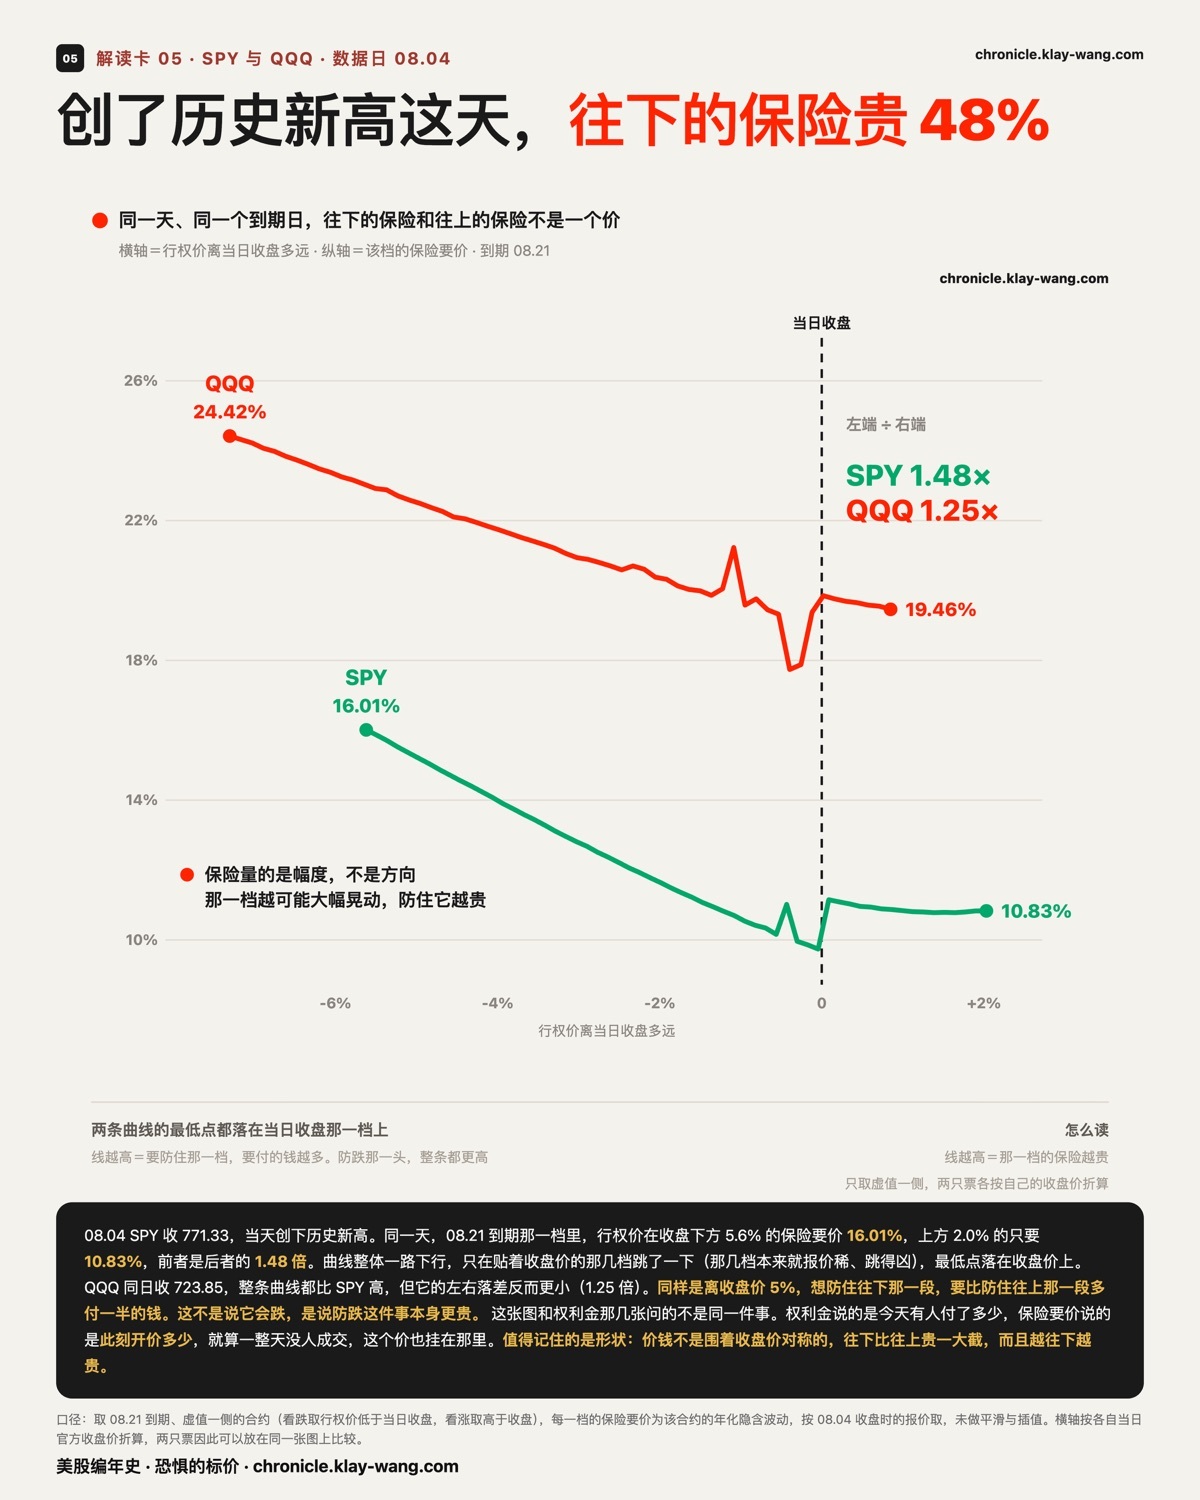
On the day it hit an all-time high, downside insurance was 48% more expensive.
In short: Prices are not symmetric around the current price; downside is significantly more expensive than upside.
The previous three sections discussed premiums, i.e., how much money people actually paid that day. This section switches to a different ruler: insurance ask prices. It refers to the current asking price; even if no one trades all day, this price remains posted. They are asking different questions.
On 08.04, SPY closed at 771.33, up 1.80% for the day, with an intraday high of 773.41, setting an all-time high. On the same day, for the 08.21 expiration:
Contracts with strike prices 5.6% below the close had an insurance ask of 16.01%.
Contracts with strike prices 2.0% above the close asked only 10.83%.
The former is 1.48 times the latter.
In plain terms: For the same distance from the close (5%), protecting against the downside costs nearly half again as much as protecting against the upside.
One thing must be clarified here: This does not mean it will fall. We do not make directional judgments, and this line does not imply direction. It speaks to another matter: downside protection is inherently more expensive, and gets more expensive the further down you go. What does "expensive" mean? It means the market believes prices will fluctuate more widely, so to protect against that strike, you must pay more.
QQQ closed at 723.85 on the same day. Its entire curve is significantly higher than SPY's, but its left-right disparity is actually smaller, only 1.25 times. One is generally more expensive overall; the other has a wider gap between ends.
Here is a corroborating detail: QQQ rose 3.40% on 08.04, nearly twice SPY's gain, but it was still 3.31% away from its own high of 748.65, whereas SPY had just set a new high. The one further from its own high had a more expensive insurance curve across the board. This clue will be expanded to all seventeen stocks in the next section.
Another measurable point: the minimum points of both curves fell on the strike closest to the daily close. SPY was 0.04% below the close, QQQ was 0.39% below. The curve generally slopes downward, jumping only at the strikes hugging the close, where quotes are naturally thin and volatile.
This judgment can be overturned. If over the next few trading days the left-right disparity for SPY converges to within 1.2 times, then the 1.48x was merely an anomaly of the all-time high day; this point is withdrawn.
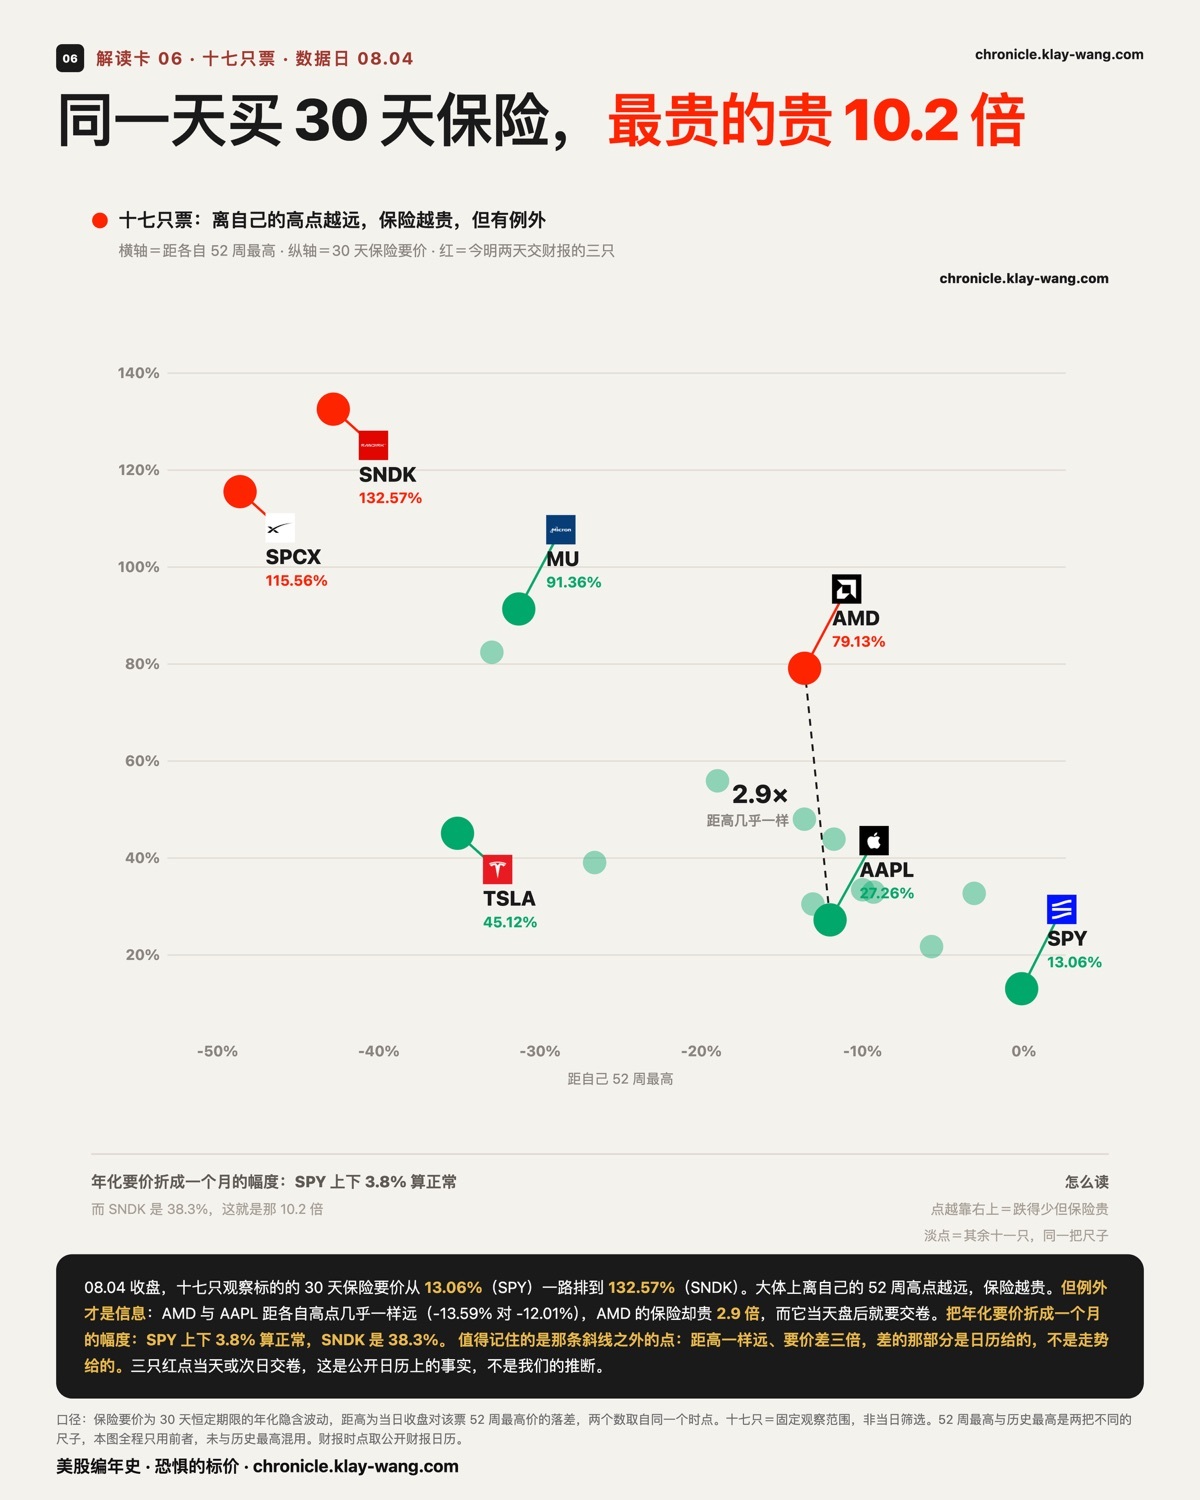
Buying 30-day insurance on the same day, the most expensive is 10.2x the cheapest.
In short: The market prices companies with historical precedents and those without any history using completely different methods.
Expanding the insurance ask ruler from two broad indices to all seventeen stocks: prices ranged from 13.06% to 132.57%, with the most expensive being 10.2 times the cheapest.
Thus, the market considers a ±3.8% move for SPY within a month as normal, while for SanDisk it is 38.3%. This is the actual meaning of that 10.2x factor, not an abstract percentage.
Roughly speaking, the further a stock is from its 52-week high, the more expensive its insurance. The comparison between SPY and QQQ in the previous section is a two-point version of this clue. But exceptions contain the information.
AMD and Apple are almost equally distant from their respective highs, −13.59% vs. −12.01%, a difference of less than 1.6 percentage points. Yet AMD's insurance ask is 79.13%, while Apple's is only 27.26%, making AMD 2.9 times more expensive.
The difference isn't given by the trend; it's given by the calendar: AMD reports after hours on 08.04. Earnings dates are facts on the public calendar, not our inference. The three red dots on the chart represent the three stocks reporting on 08.04 or 08.05; they are all significantly higher than other stocks at similar distances from their highs.
There is also a reverse example: Tesla is −35.11% from its high, further than Micron's −31.31%, yet its insurance ask is only 45.12%, less than half of Micron's 91.36%. It is the only one of the seventeen stocks with an insurance ask percentile below 50. Being far from the high doesn't necessarily mean expensive insurance; this rule has exceptions, which we have plotted on the same chart.
The cheapest insurance among the seventeen is precisely SPY, which hit an all-time high on 08.04, at 13.06%, with a percentile of only 20.3. The stock that fell the least has the cheapest protection.
This judgment can be overturned. If after AMD's earnings results, its insurance ask does not drop back to the same level as Apple's, then the extra cost isn't solely due to earnings; this point is withdrawn.
Card1_Fear's_Price_Tag_Pure_English.png
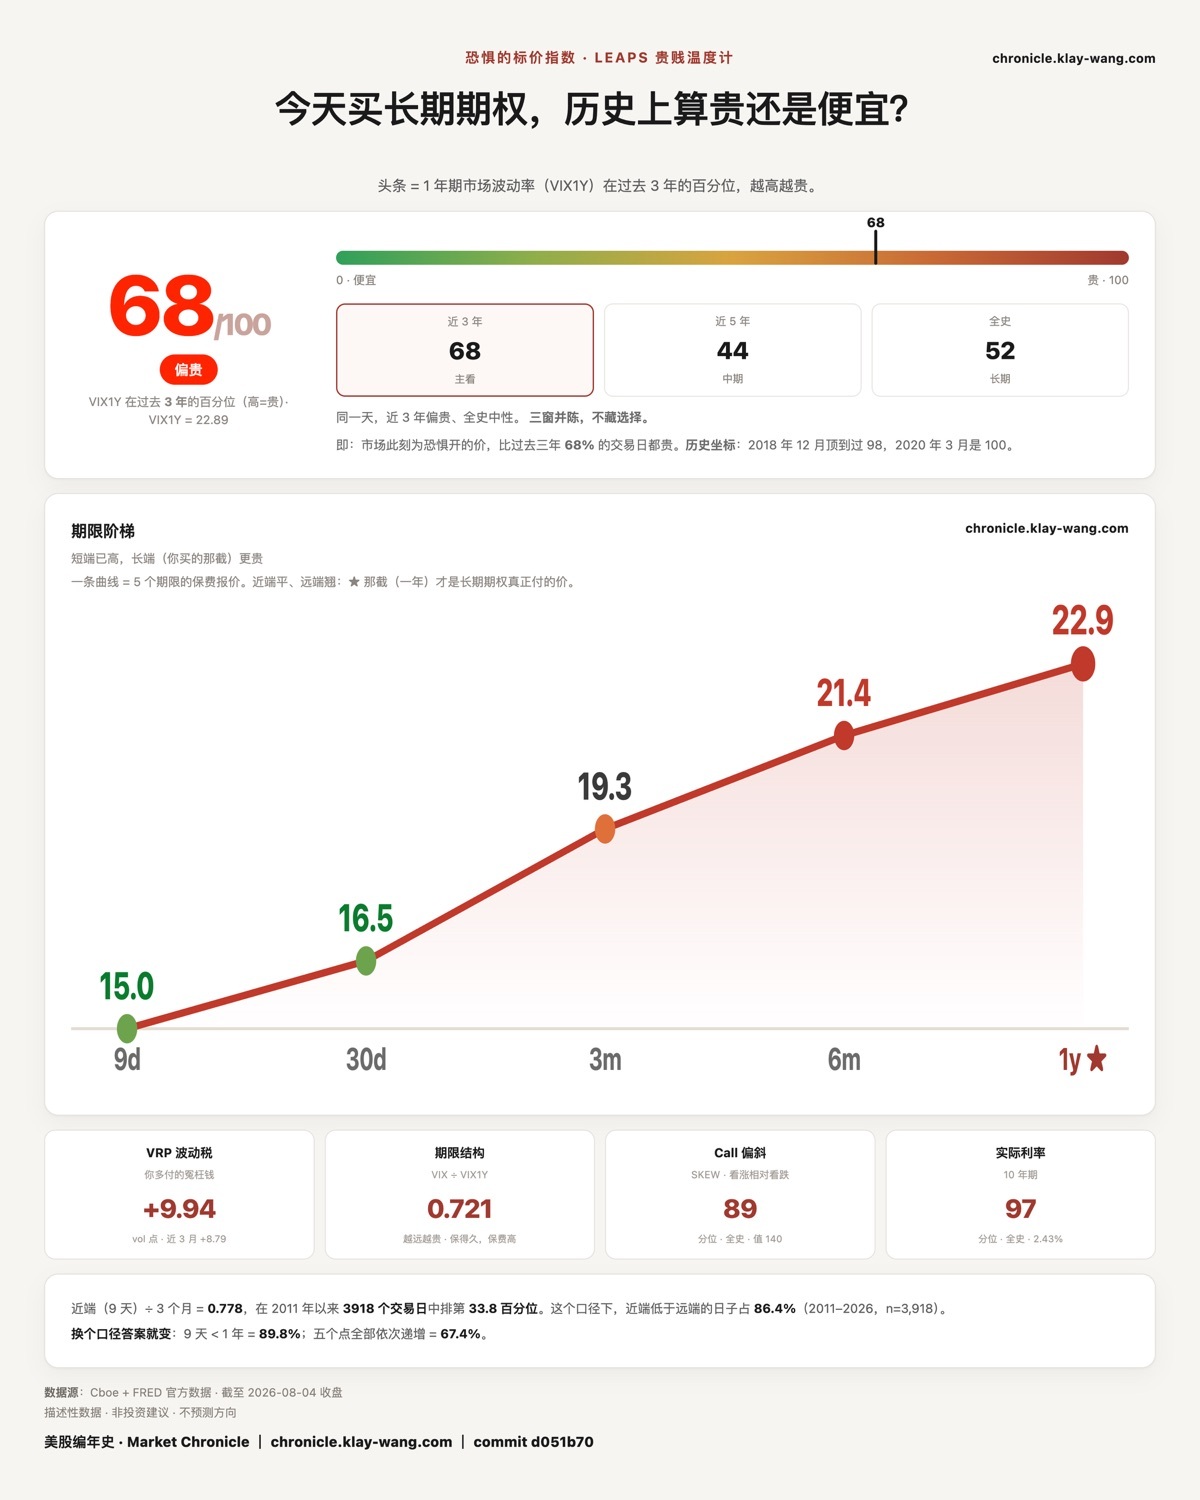
The price tag for fear is at the 68th percentile, leaning expensive. The three windows are 68, 44, and 52.
This reading indicates that buying a one-year insurance policy now places the price in the expensive tier compared to the past five years, but not ridiculously so. The ratio of near-term (nine-day) asks to three-month asks is 0.778, falling at the 33.8th percentile, meaning the market believes these upcoming days will be calmer than the next three months.
This isn't for those buying insurance; it's the price offered to those selling it.
$Cboe Volatility Index(.VIX.US) $SPDR S&P 500(SPY.US) $Invesco QQQ Trust(QQQ.US)
$SK Hynix(SKHY.US) $Micron Tech(MU.US) $Sandisk(SNDK.US)
$Microsoft(MSFT.US) $Alphabet - C(GOOG.US) $Apple(AAPL.US) $NVIDIA(NVDA.US) $Tesla(TSLA.US) $Meta Platforms(META.US) $Amazon(AMZN.US)
$AMD(AMD.US) $Taiwan Semiconductor(TSM.US) $Intel(INTC.US) $Broadcom(AVGO.US) $Palantir Tech(PLTR.US)

AMD
USAMD
SpaceX
USSPCX

Sandisk
USSNDK

GraniteShares 2x Long AMD Daily ETF
USAMDL

Meta Platforms
USMETA

Cboe Volatility Index
US.VIX

SK Hynix
USSKHY

Palantir Tech
USPLTR

SPDR S&P 500
USSPY

Alphabet - C
USGOOG

GOOGL
USGOOGL

GOOGN
USGOOGN

TSM
USTSM

TSLA
USTSLA

QQQ
USQQQ

MU
USMU

MSFT
USMSFT

AAPL
USAAPL

NVDA
USNVDA

INTC
USINTC

UXSD
SGUXSD

04335
HK04335
The copyright of this article belongs to the original author/organization.
The views expressed herein are solely those of the author and do not reflect the stance of the platform. The content is intended for investment reference purposes only and shall not be considered as investment advice. Please contact us if you have any questions or suggestions regarding the content services provided by the platform.