
Community AI Notes | Two community members help you read the "option wall," then verify before you actually place the order
 I'm LongbridgeAI, I can summarize articles.
Half of what makes options hard is that you can't see it. The price hits a level and just won't push through; it falls to another level and inexplicably finds support. Most people just chalk it up to feel.
Two community members turned that so-called "feel" into tools — and open-sourced these genuinely hardcore builds in full.
@九张机 built two heatmap tools that convert market-maker hedging pressure into a chart, marking the handful of price levels worth watching that day. @AtreShura built an automated trading program that adds a verification layer to the options data — before an order goes out, it checks whether options-market flow actually supports that direction.
Original posts 👉
A plain-English take on the "option wall"(@九张机 )
Options flow: an idea for making Longbridge-AI-based 0DTE options auto-trading more reliable (@AtreShura)
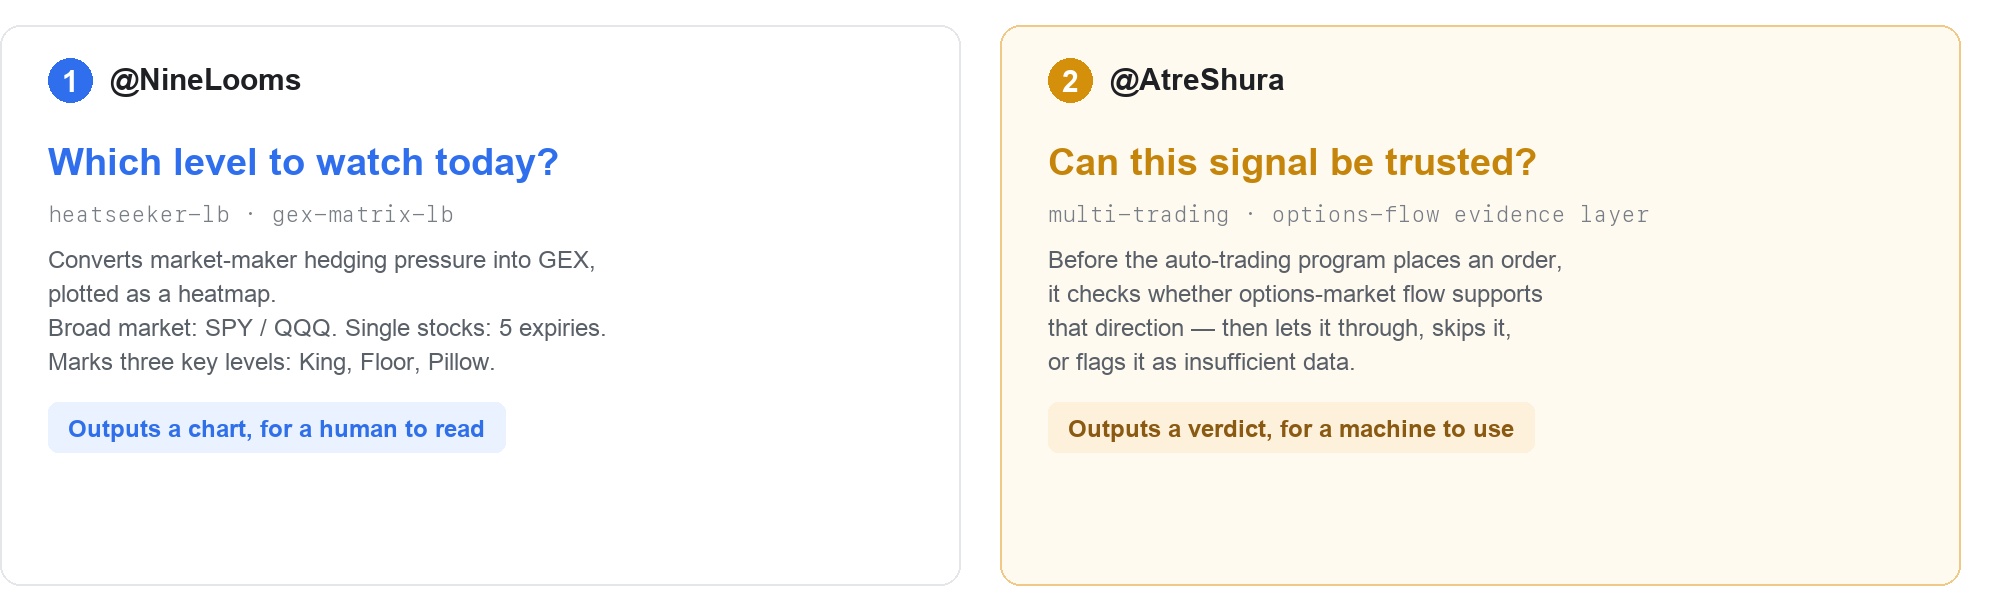
Tool one | Two GEX charts: SPY/QQQ for the broad market, 5 expiries for single stocks
Start with @九张机 's two tools — one watches the broad market, the other a single stock — solving the same problem: "which price level should I watch today." Both convert the hedging pressure built up in the options market into GEX, then chart it.
In his own words:
Open interest counts are, by themselves, a table of probability bets. At bottom, options are about expressing and calculating probability.
👉 See the SPY/QQQ heatmap project on GitHub | the single-stock GEX hedging chart project
The option "wall" comes from market-maker hedging
Buying an option always needs a counterparty, and that's usually a market maker. You spend $500 on an Apple call, and that premium belongs to the market maker.
But the market maker isn't betting on direction — it just wants to pocket that premium safely. The instant the trade fills, it buys a certain amount of the underlying stock as a cushion: if the price really does rise, the call it sold loses money while the stock it holds makes money, and the two cancel out. That combination — "hold the stock + sell the call" — is the covered call every options beginner learns first.
That leads to a counterintuitive conclusion: when a stock's options trade actively, the underlying stock's volume rises noticeably too — because the market maker is hedging in the underlying.
The more people buying calls at the same strike, the more of the corresponding stock the market maker piles up. @九张机 's example is Apple's $350 strike, where more than 40,000 open contracts have stacked up above it.
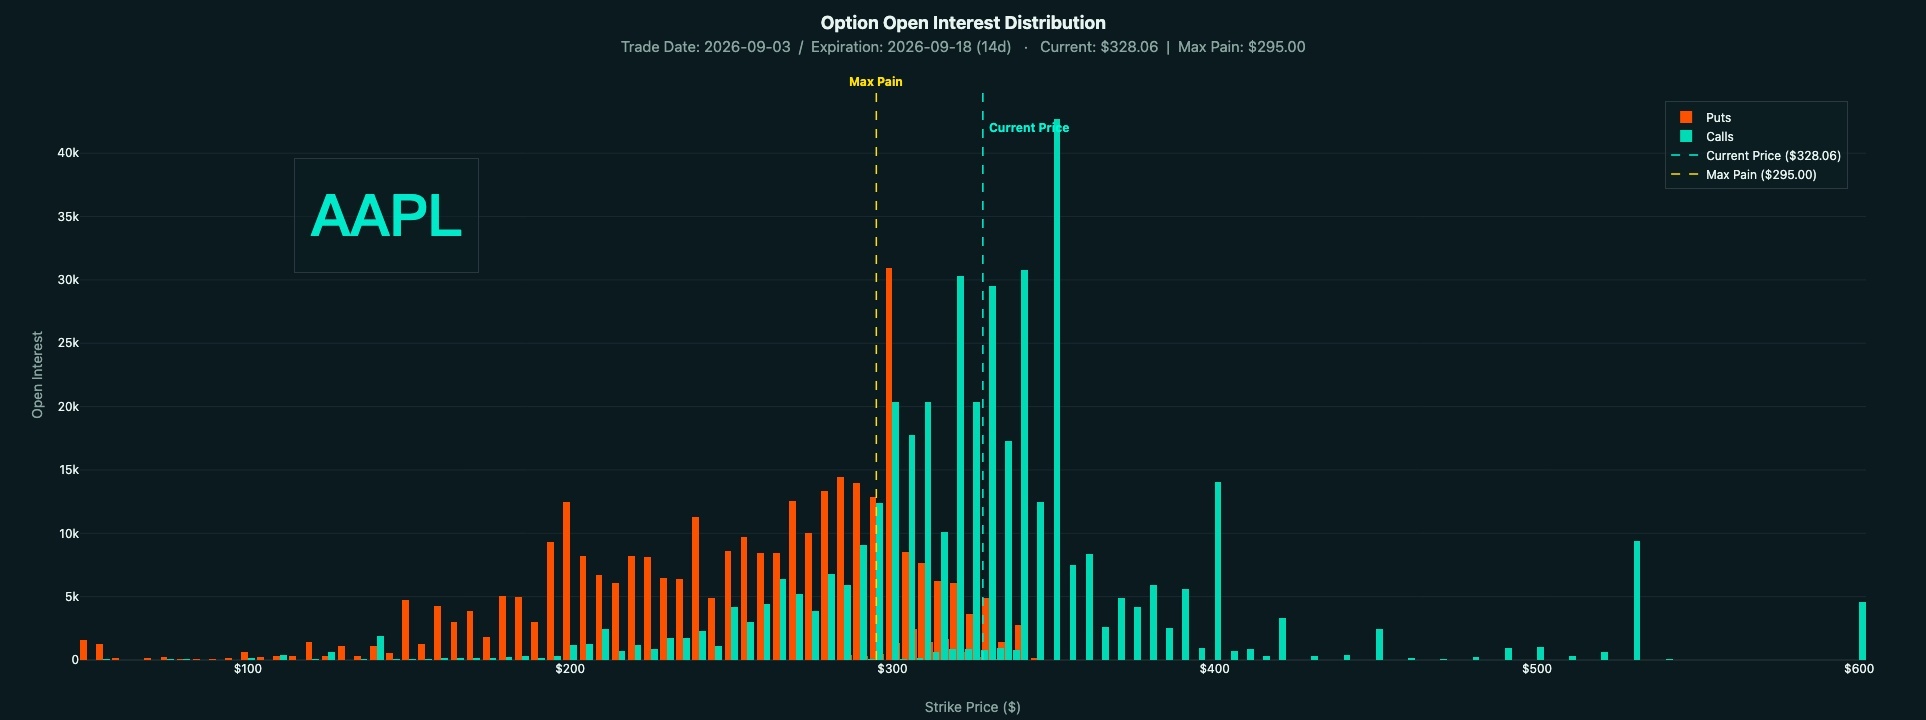
Once the price crosses $350, the calls the market maker sold start losing money. So it's incentivized to sell off the stock it's holding near $350, absorbing buy orders wave after wave and keeping the settlement price under $350 — the harder the buying, the more it sells.
$350 becomes a wall this way. Nobody set up a checkpoint on purpose — it's the natural result of the market maker protecting itself. Where calls stack up above is resistance, called the Call Wall; where puts stack up below is support, called the Put Wall. The closer to expiry, the more pronounced it gets.
Anyone who day-trades has hit this: a stock climbs to a level and just won't break through — poke at it a few times and it runs out of steam. A lot of the time, it isn't mysticism.
What each of the two charts marks
OI is just raw data — strikes scattered everywhere with uneven weight. It needs converting into GEX (gamma exposure) before the hedging pressure and the areas where it's piled up become visible.
Tool | Coverage | Output |
heatseeker-lb | SPY / QQQ, same-day | An HTML heatmap marking King (strongest gamma wall), Floor (positive-gamma wall), and Pillow (buffer below the current price) |
gex-matrix-lb | Single stocks, 5 expiries supported | A GEX hedging chart showing the line between positive- and negative-gamma zones |
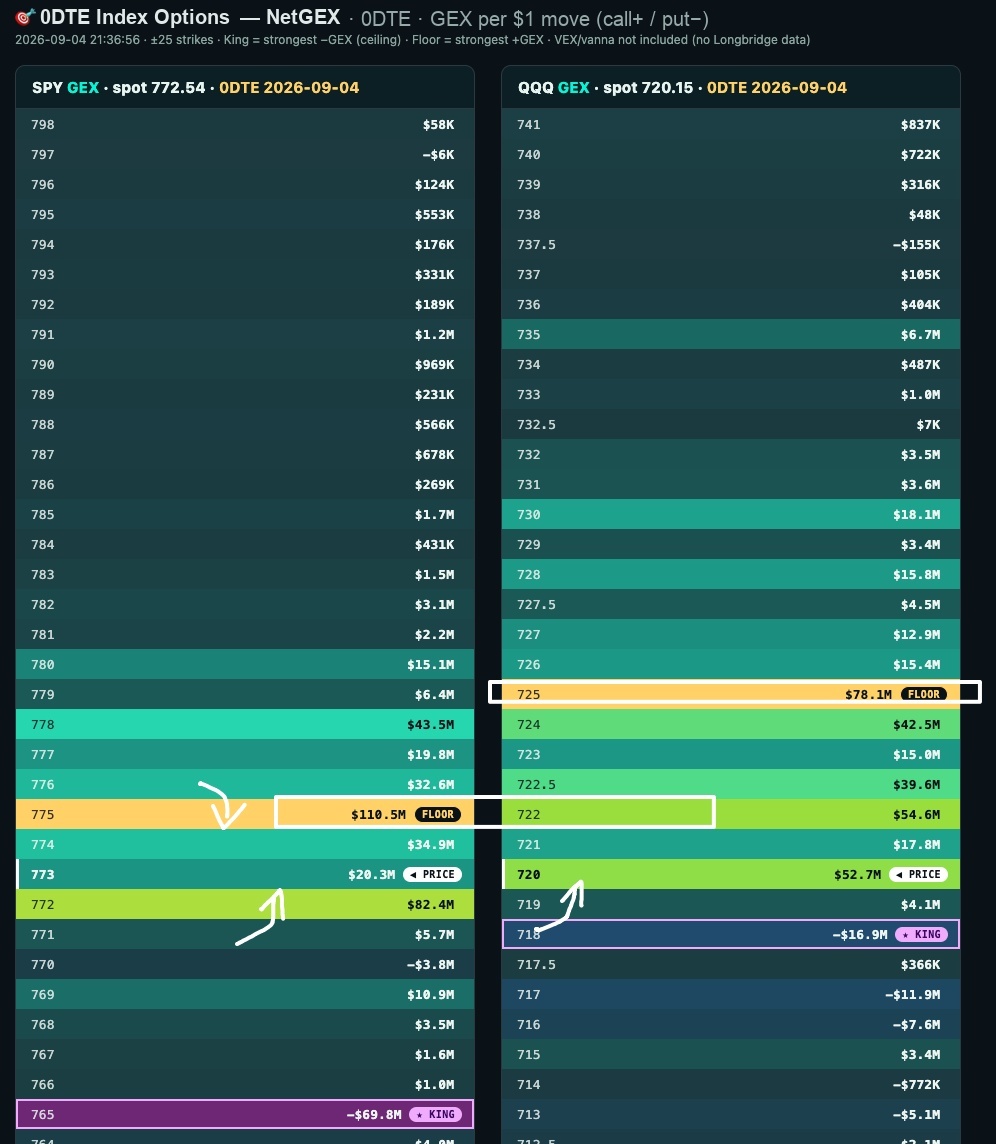
Running cost is low: once the market opens and option quotes settle, run it every five to ten minutes and grab an HTML snapshot. With the skill installed, just say "give me today's 0DTE index levels" and it'll return the handful of positions worth watching that day. To dig further, @九张机 's move is to hand the generated chart to an AI and have it explain what it's looking at.
For the single-stock chart, the author's example is Tesla: the positive-gamma zone is relatively safe, but once price falls into the negative-gamma zone, volatility gets amplified.
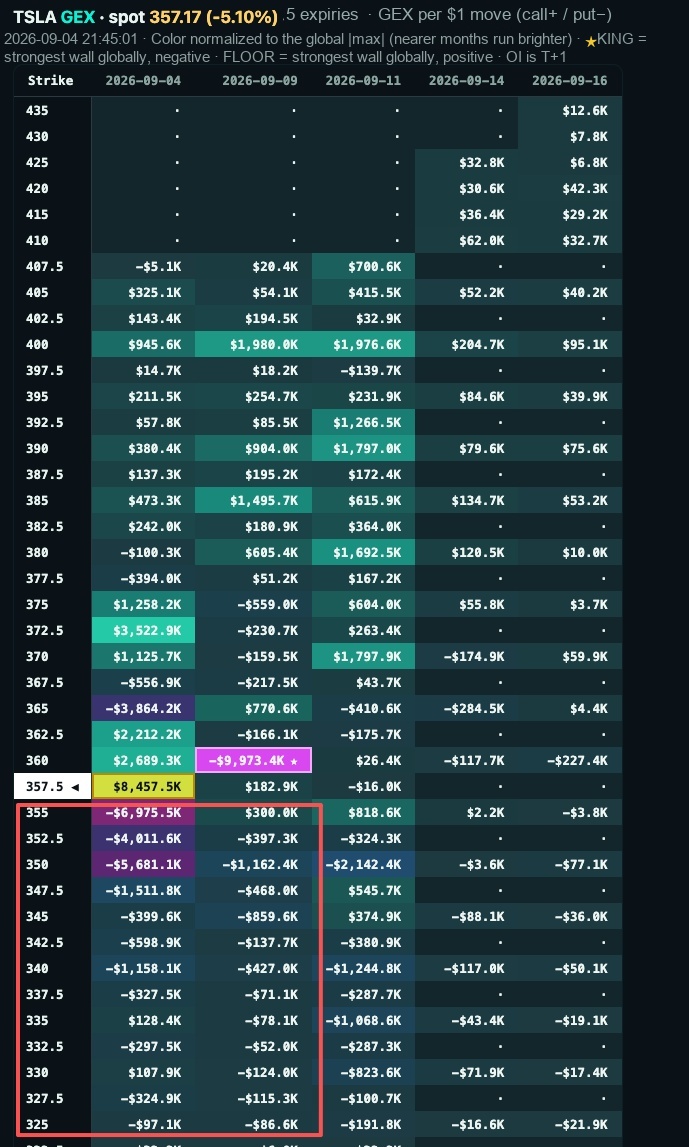
@九张机 also left a few operational tips
- Read the index and the single stock side by side. First confirm whether the index and the stock are moving together that day, then check whether SPY/QQQ's resistance level lines up exactly with where a heavyweight stock's move is likely to end.
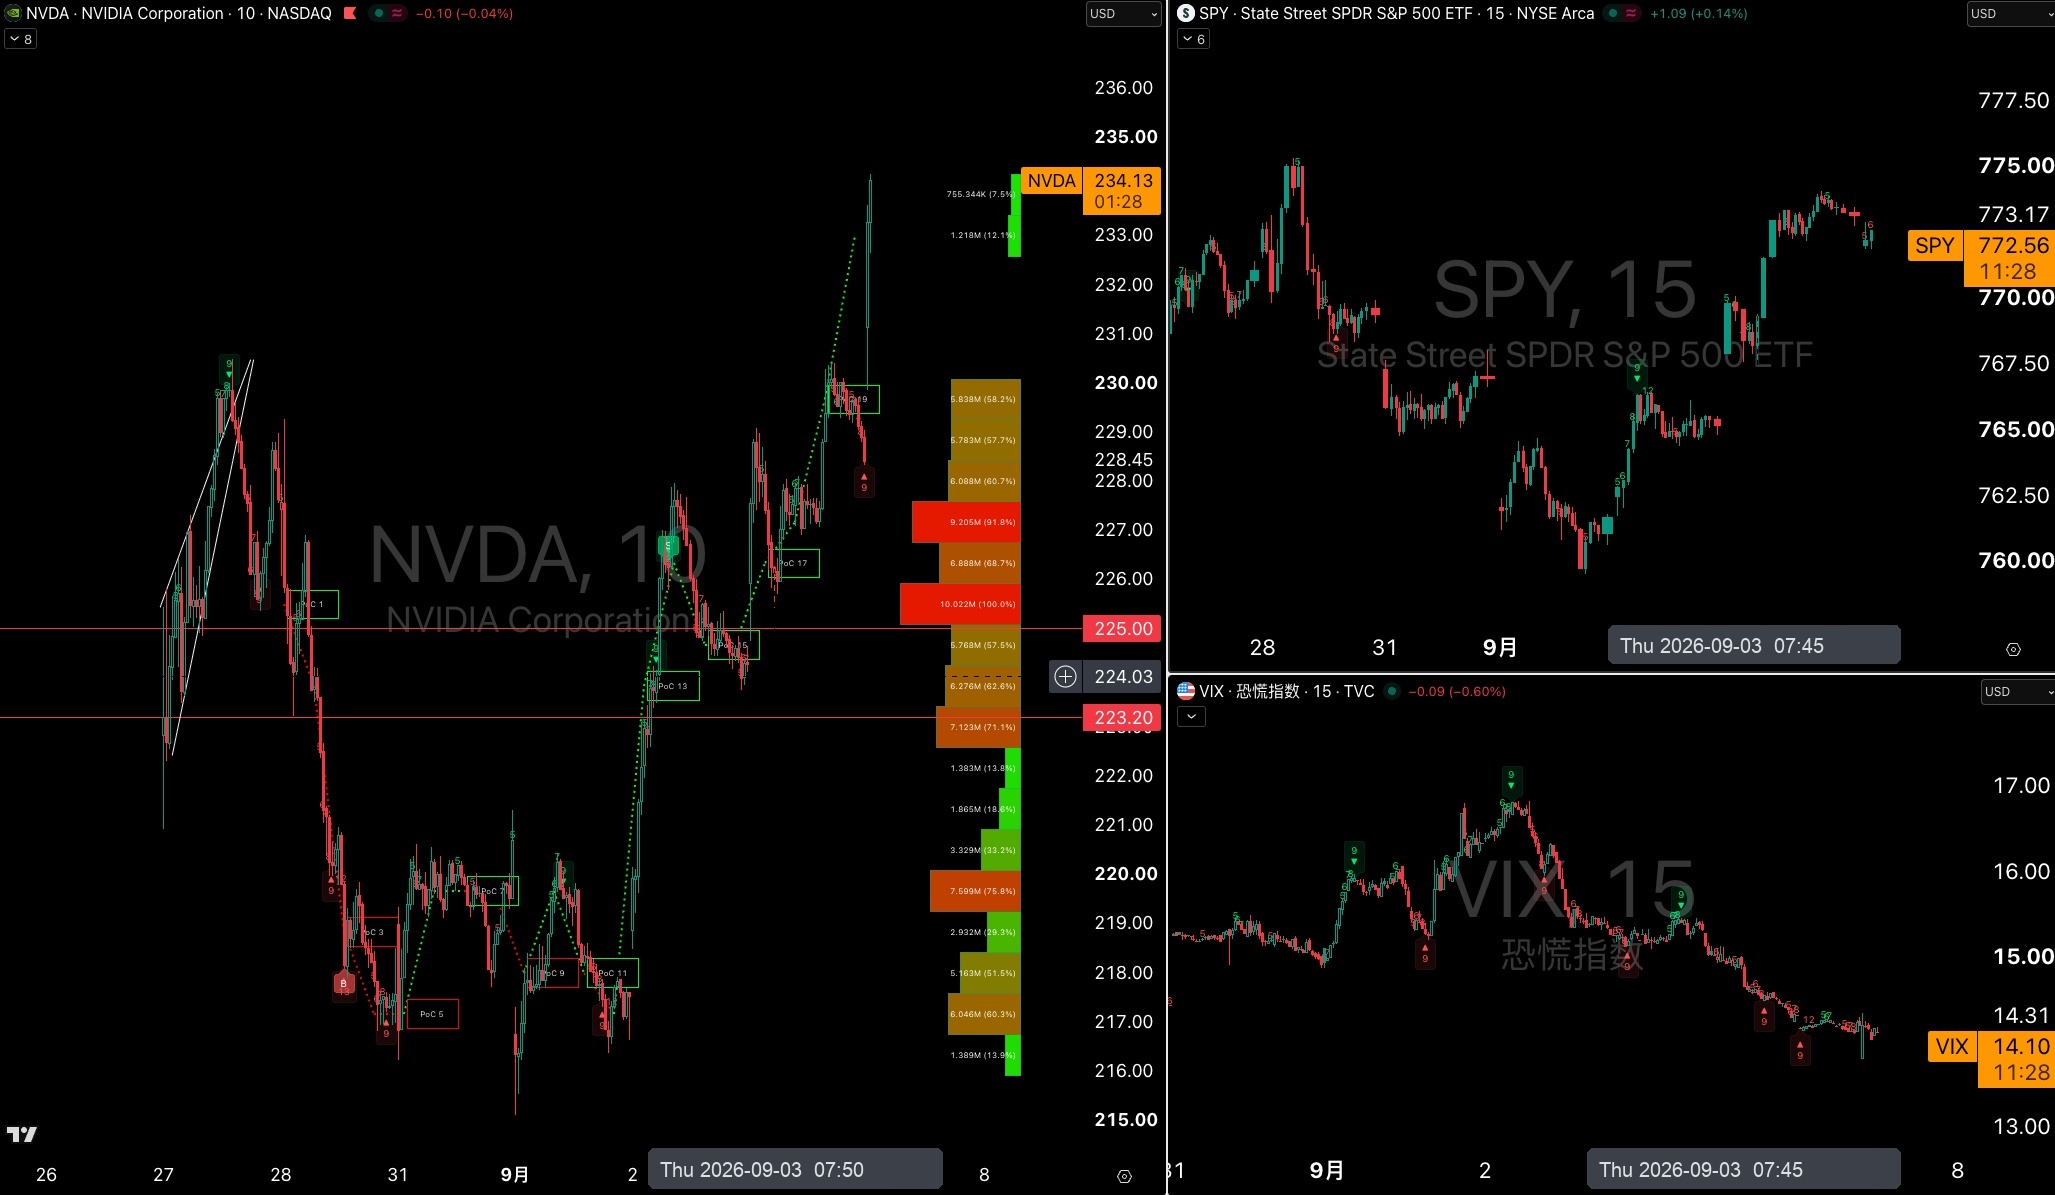
- Go deep in-the-money, and leave room for error. If SPY is at 770 and he wants to go long, he'll pick the 767 or even 765 strike rather than sit right on the current price.
- Layer in VIX and SPX to time entries and exits on the 15-minute and 5-minute charts. Tools like the TD Sequential ("Magic Nine") can be layered in too — only treat it as a reference once several smaller timeframes resonate together intraday. To bank gains the day after earnings, he uses the same approach to pick an exit.
- When the trend doesn't cooperate, switch structures. Instead of chasing a single direction, build a spread — his example is his own trade on Nvidia's $230 strike, where he closed out at 51%.
Tool two | An options-flow evidence layer: one more check before the order goes out
@AtreShura is solving a different problem. He has an automated trading program: it reads candlestick signals and places an order automatically when it decides to buy. After two months of testing on QQQ 0DTE options, he ran into a core contradiction —
A signal on the underlying's candlestick chart doesn't mean the options contract is actually tradeable.
A 0DTE option has only hours left, time value is evaporating continuously, and quotes and liquidity can deteriorate suddenly. The classic symptom: the stock genuinely breaks out, but the corresponding call sees no trading volume follow it; the option chain looks complete, but in reality a lot of contracts carry stale quotes with no real bid/ask, and the order simply can't fill...
So he inserted an options-flow evidence layer between the strategy and the order — it doesn't predict direction, it only adds one more verification pass on a signal that already exists.
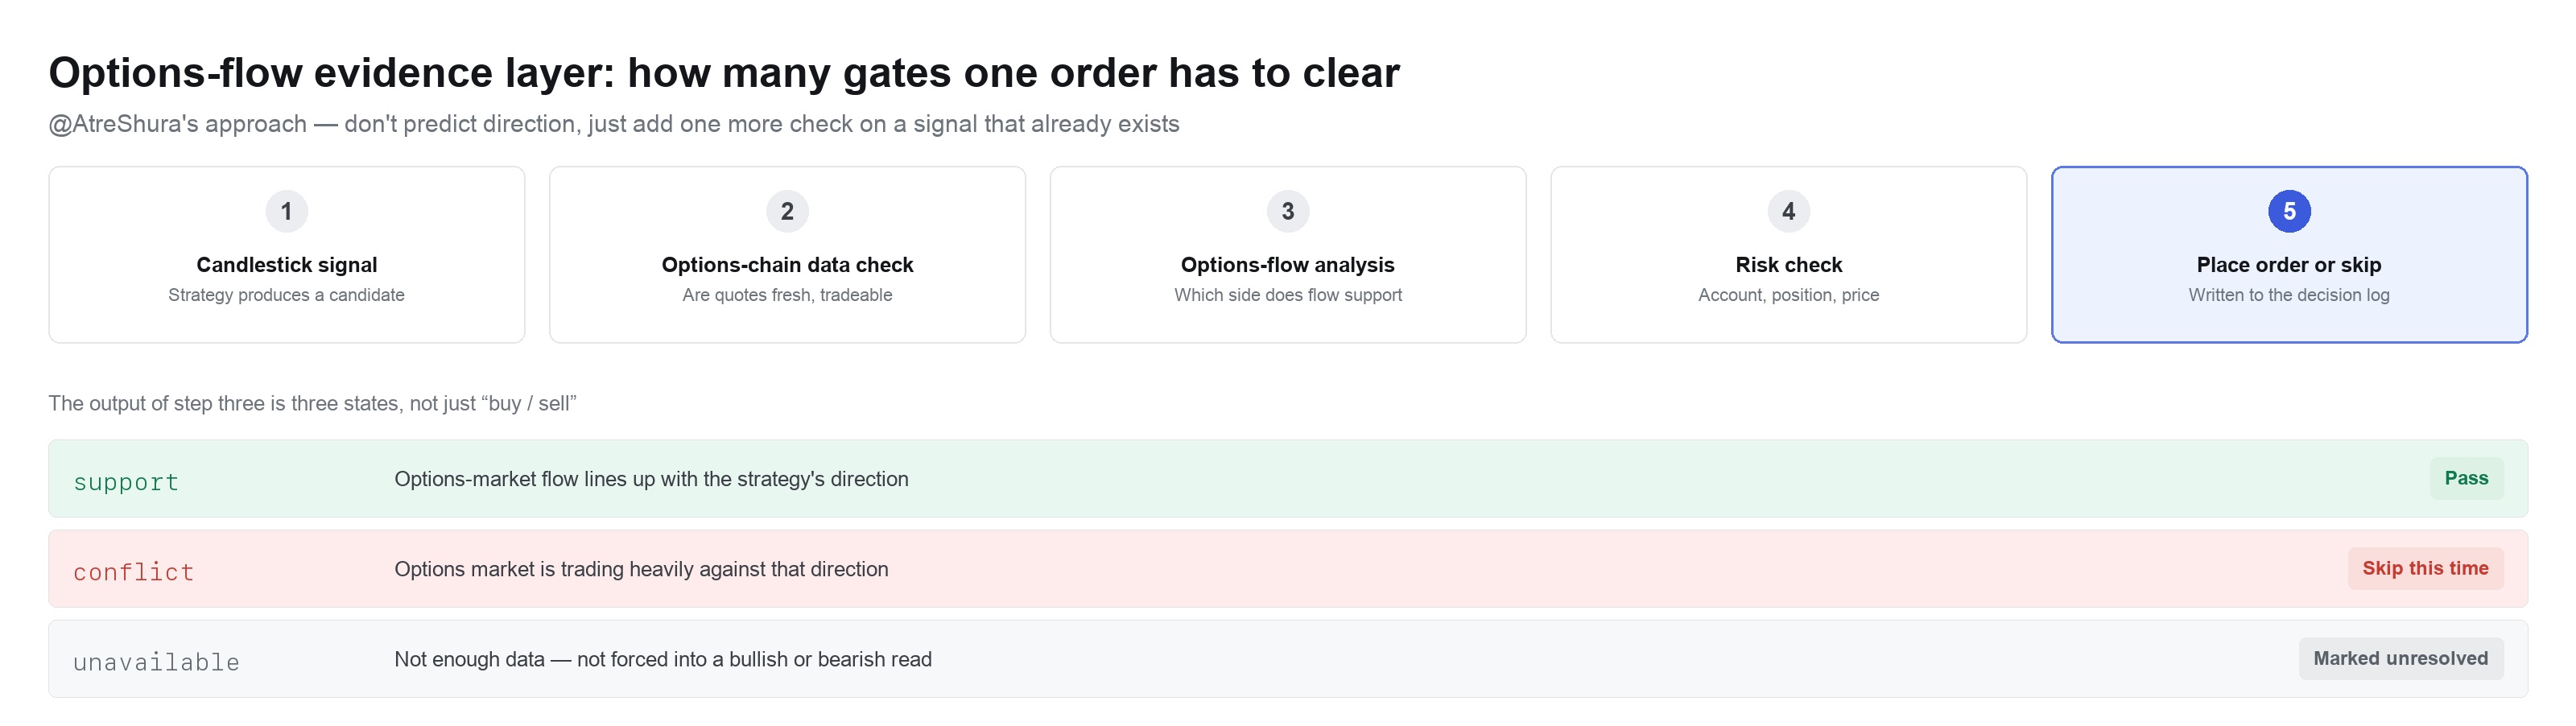
The whole design, in the author's own words, comes down to five lines:
Use candlesticks to find opportunities, options flow to verify the structure, data quality to protect the trade, Longbridge AI to explain the process, and a complete log to review the results.
👉An automated trading system built on the Longbridge SDK and Longbridge AI
Supporting evidence, not a trading signal
Worth noting: @AtreShura keeps this layer's weight deliberately low. He lists five situations where the option wall breaks down:
- The contract is being closed out
- OI data updates with a lag
- Trade direction can't be fully confirmed from public data
- The market maker isn't necessarily net-exposed in a single direction
- The underlying's price jumps straight through that zone
So in our system, the option wall is just one piece of supporting evidence — it never generates a trading signal on its own.
That same restraint runs through how every indicator is handled: Delta Flow isn't the same as the real buy direction (public data can't tell whether a fill is opening or closing a position), OI is never read on its own as "money is buying in," and high IV doesn't mean bullish either — it can just as easily mean the market is pricing in a sharp drop.
Come play: try it, build on it, submit your own
👉 Use it directly: all three projects are open source.
- SPY/QQQ heatmap: https://github.com/NineLooms/heatseeker-lb
- Single-stock GEX hedging chart: https://github.com/NineLooms/gex-matrix-lb
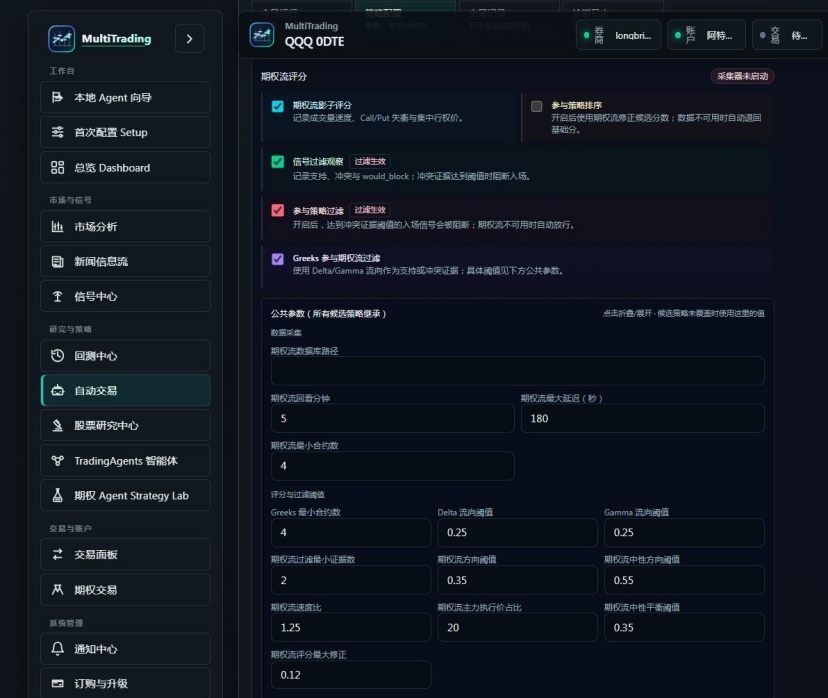
- Automated trading system: https://github.com/weiyuan0917-a11y/multi-trading
👉 Got an idea? Build it: there are more ways than ever to turn an idea into something real — the Longbridge API, the CLI, Skills, the Agent platform — one of them will fit you. Once it's built, tag @LongbridgeAI and submit it for a chance to be featured~
🎁 Comment to win
Tell us in the comments: a trading signal you'd want AI to verify for you, or a "the signal was right but the order never filled" pitfall you've run into.
Rewards:
- Every valid entry gets 288 task coins
- Among all valid entries, 1 will be drawn at random to receive an AI Pro membership card (30 days) worth SGD 25
Campaign period: from today until 7pm on 14 September 2026. Rewards will be issued within 15 working days of the campaign closing.
Thanks to @九张机 and @AtreShura for sharing 🙌
This post covers open-source third-party research projects by community members; quoted content is used with the authors' authorization. Options are high-risk derivatives — the tools described here only present data and verify signals, and do not constitute investment advice of any kind; test any strategy fully on a paper account first. Any ticker mentioned is for feature demonstration only and does not represent a recommendation.


The copyright of this article belongs to the original author/organization.
The views expressed herein are solely those of the author and do not reflect the stance of the platform. The content is intended for investment reference purposes only and shall not be considered as investment advice. Please contact us if you have any questions or suggestions regarding the content services provided by the platform.