

The ominous sign in the US stock market: indices hitting new highs while sellers are disappearing

The S&P 500 index in the US stock market has repeatedly hit new highs, but the proportion of trading volume from declining stocks has dropped to a new low since 2020, indicating a potential market correction. Historical data shows that similar situations have previously triggered declines of over 5%. Although the VIX index and MOVE index have reached new lows, suggesting that risks have been absorbed, the upcoming earnings season and fiscal policy trends will be key tests for the market
As the U.S. stock market climbs to new record highs, a potential ominous signal is emerging: sellers in the market are becoming increasingly scarce.
Recent developments show that the S&P 500 index has set five historical highs in the past nine trading days, with market sentiment exceptionally high. However, according to data compiled by Thrasher Analytics, the trading volume of declining stocks has averaged only 42% of the total trading volume on U.S. exchanges over the past month, the lowest level since 2020.
The impact of this trading volume signal cannot be ignored. Andrew Thrasher, co-founder of the data analytics firm, points out that historically, when this indicator reaches such low levels, it often signals a market correction. Data shows that in three instances in 2020, 2019, and 2016 when similar situations occurred, the S&P 500 index experienced at least a 5% decline.
Meanwhile, another contradictory signal in the market comes from the volatility index. The Chicago Board Options Exchange Volatility Index (VIX) fell to its lowest level since the end of February on Thursday, while the ICE BofA MOVE Index, which measures expected volatility in U.S. Treasuries, also dropped to a near three-and-a-half-year low. Some strategists believe this is not market complacency, but rather that investors have digested the "known unknown" risks, including trade disputes and economic growth concerns.
Amid these mixed signals, the market's next test will be the upcoming earnings season. Additionally, investors will closely monitor the U.S. budget balance data for June, set to be released on Friday, as well as a questionnaire sent by the Treasury to primary dealers, looking for "clues" that its debt management strategy may change. Until clear catalysts emerge, the market may continue to navigate between optimism and potential risks.
Imbalance in Trading Volume: Historical Indicators of Correction Risk
The weakening of selling power in the market is the most direct reflection of current investor sentiment. Andrew Thrasher points out that the continued decline in the proportion of trading volume from declining stocks "suggests that the market may be experiencing excessive bullish sentiment, which could lead to a mild correction after a slight overextension."
Although historical data shows that the market may face a decline of 5% or more after this signal appears, Thrasher believes that this correction may be relatively "mild." He stated:
"I do not expect a double-digit decline. A 3% to 5% correction is normal in a bull market."
He added that, given investors' preference for cyclical sectors such as technology and finance, they are likely to view potential corrections as buying opportunities. History also indicates that corrections following such low trading volume levels are typically short-lived, lasting generally no more than a few weeks.
Currently, investors are closely monitoring a range of market signals, including trading volume, to assess the sustainability of this rebound. Since the low in April, the S&P 500 index has risen about 26%. Although concerns have been raised due to the high concentration of large tech stocks, signs such as relatively light positions among some institutional traders suggest that the market may still have room for further gains
The "Surface" and "Substance" of Earnings Forecasts
Behind the soaring market indices is a quiet erosion of analysts' confidence in corporate earnings prospects. Although earnings forecasts appear to be rising on the surface, their reliability is being undermined, bringing new uncertainties to market stability.
Since the Trump administration began implementing tariff policies, the divergence among analysts has significantly widened. Data shows that the consensus earnings per share forecast for the S&P 500 index over the next 12 months has risen to $282, up from the data on February 19. However, according to Bloomberg columnist Nir Kaissar, the median standard deviation of earnings forecasts, which measures the divergence of analysts' predictions, has increased by 11% since February 19.
Apple Inc. is a typical example. Given its reliance on overseas supply chains and potential business disruption risks, the divergence in analysts' earnings forecasts has more than doubled. Other companies such as Visa, UnitedHealth Group, Adobe, RTX Corp., and 3M have also seen their earnings forecast divergence at least double. This phenomenon is widespread across various sectors of the S&P 500 index.
The uncertainty in earnings forecasts is also reflected in the widening gap between the highest and lowest forecast values. Since February 19, the median gap between the highest and lowest earnings forecasts among S&P 500 constituents has widened by 10%. Nir Kaissar warns that while consensus earnings forecasts are rising, analysts' confidence is weakening, and "the stability of the stock market depends on the stability of the earnings forecasts it relies on."
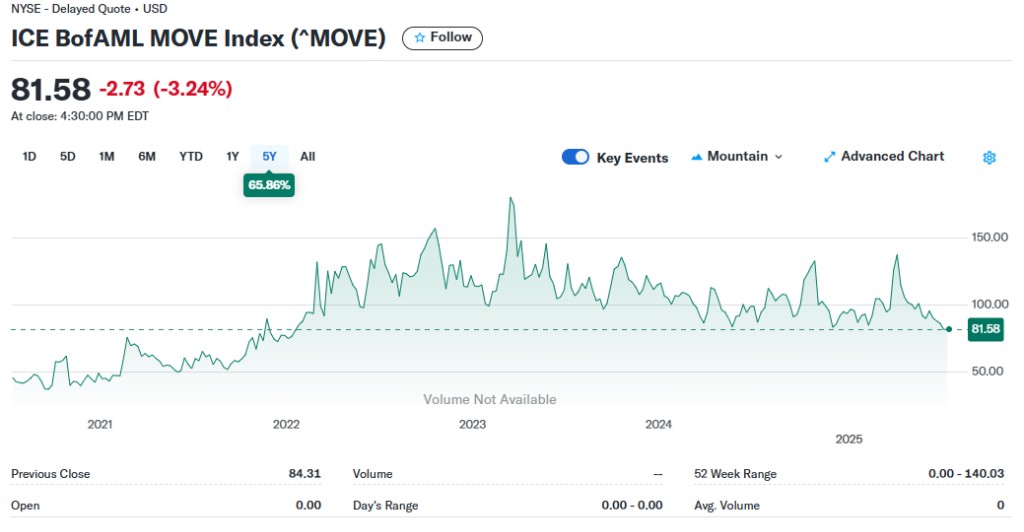
VIX and MOVE Indices: Has the Market Digested the Risks?
In contrast to the concerns revealed by trading volume and earnings forecasts, key indicators measuring market panic and bond market volatility are at multi-year lows, injecting optimism into the market.
The VIX index closed at 15.78 on Thursday, well below its long-term average of about 19.5. DataTrek Research strategists believe this indicates that investors have digested risks such as trade uncertainty and economic growth concerns. Data going back to 1992 shows that when the VIX index remains below the average level for an extended period, the annual average return of the S&P 500 index typically ranges between 13% and 26%, performing strongly.
DataTrek co-founder Nicholas Colas wrote:
"The market is usually more correct than we think."
The calm in the bond market also confirms this. The ICE BofA MOVE index has fallen to its lowest level since early 2022, indicating that the market is stabilizing after months of turmoil. This week, the auctions for U.S. 10-year and 30-year Treasury bonds also received ample demand.
However, Jefferies International strategist Mohit Kumar still cautions that, given fiscal concerns, he remains cautious about long-term bonds in the U.S., Europe, and the UK
