
C
7 hours ago
MRVL Options Seller Daily No.004 | Some Are Chasing a 175% Lottery Ticket. Others Are Collecting 97% Annualised Rent.
 I'm LongbridgeAI, I can summarize articles.
$Marvell Tech(MRVL.US) jumped 4.84% last night, closing at US$240.38. The options chain was even livelier than the stock itself — a few call options gained 175% in a single day.
Lively as it all looks, the earnings report isn't out yet — it lands after the US market close on 27 August, which is the early hours of 28 August, Singapore time.
But today, we'd like to show you another group of people on the very same options chain.
They don't guess direction. They calculate rent.
One Options Chain, Two Price Lists
First, the price list the buyers see.
For contracts expiring in earnings week, implied volatility (IV) has surged to 135%. IV is the price the market quotes for "how wild the ride might get" — the higher it climbs, the more expensive the option. Contracts expiring a month later, meanwhile, sit at only around 76%. Same stock, ticket prices nearly double apart — and that gap in between is the price of this one earnings night. Scalpers' tickets on concert night have always been the dearest.
Now, the price list the sellers see. Same set of numbers, read the other way round —
A 135% ticket price means whoever is willing to carry the risk of that night gets paid a premium (the cash that lands in your account when you sell an option) priced at that same 135%. Every dollar the buyers hand over for scalped tickets goes straight into the sellers' pockets as rent.
Which leaves just one question — is this rent easy money?
The Rent Is High Because the House Keeps Shaking
If a high annualised yield alone makes you want to jump in, look at this set of indicators first.
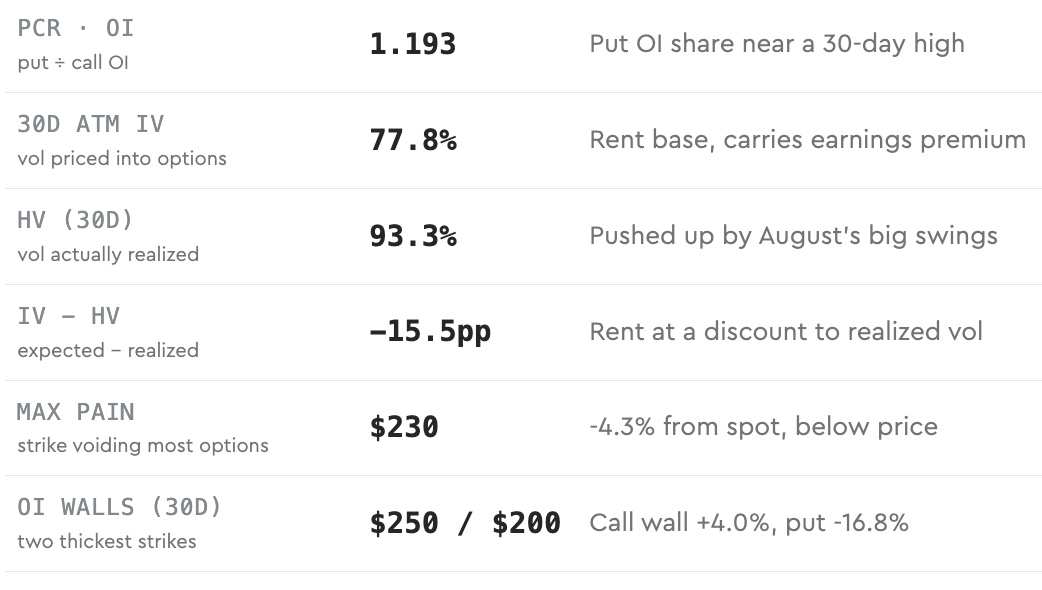
Two signals are worth translating.
One: historical volatility (HV — how much the share price has actually moved) stands at 93%, above the 77.8% IV of contracts near the current price. The market is already charging a rich price for this stock, yet its recent temper has been wilder still than what's priced in. The rent is set this high because the house has been shaking every day.
Two: the put-to-call open interest ratio (PCR·OI) sits at 1.193, higher than on 96.6% of days over the past 30 days — existing positions have their defences stacked to a one-month high. Yet in the window one month after earnings, call open interest outnumbers puts by some 60%.
Shields packed up close, spears stacked in the distance. The market has written its script in real money: this night will be turbulent — and once it's over, the bulls intend to keep telling their story.
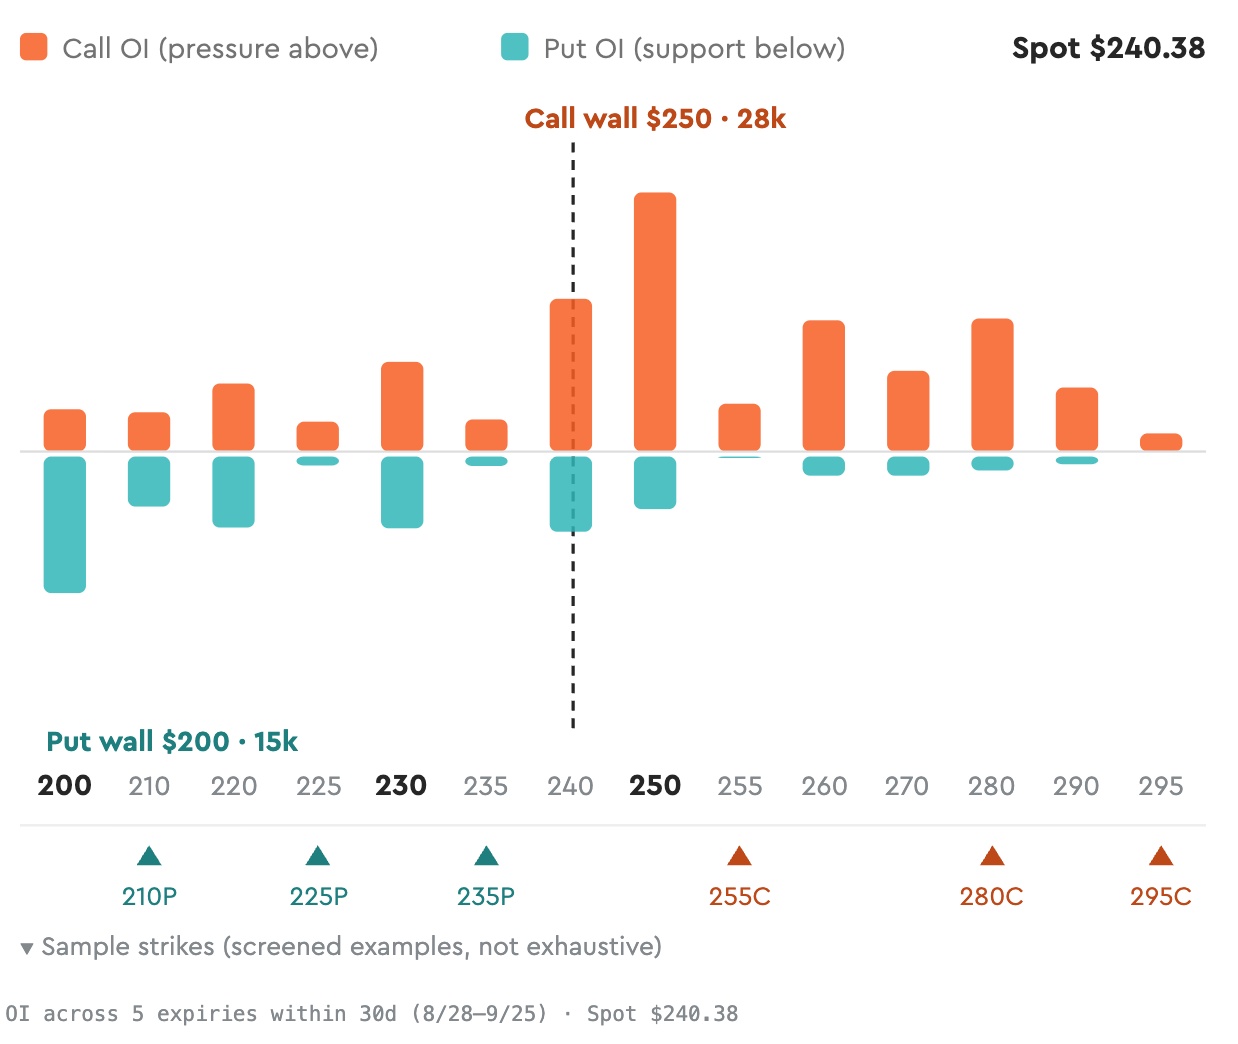
The levels are all in the chart: 250 is the thickest wall of call open interest; the 240 line is the put wall, and the share price is standing right against it. Earnings-night moves are unlikely to show this US$10 range any respect — but once things settle down afterwards, these two levels will turn back into magnets and speed bumps.
How a Seller Writes the Answer Sheet
Close the book on all the numbers above, and the seller's logic fits in one sentence —
Buyers earn money by getting the direction right. Sellers earn money when the actual move turns out smaller than the move that was priced in.
The mechanics are simple enough. Take selling a put (a cash-secured put) as the example — you commit to a price at which you'd genuinely be happy to buy, and pocket the rent upfront. If the stock stays above that price at expiry, the rent is yours for free; if it falls below, you buy 100 shares at your committed price — effectively picking up stock at a discount.
Screening the data by this logic — contracts expiring after earnings, sheltered beyond the option walls — gives three tiers in each direction, all in the table below (annualised yields are on a cash-secured basis, i.e. with the full purchase amount set aside in the account; the call side works the same way, so we'll use puts as the example):
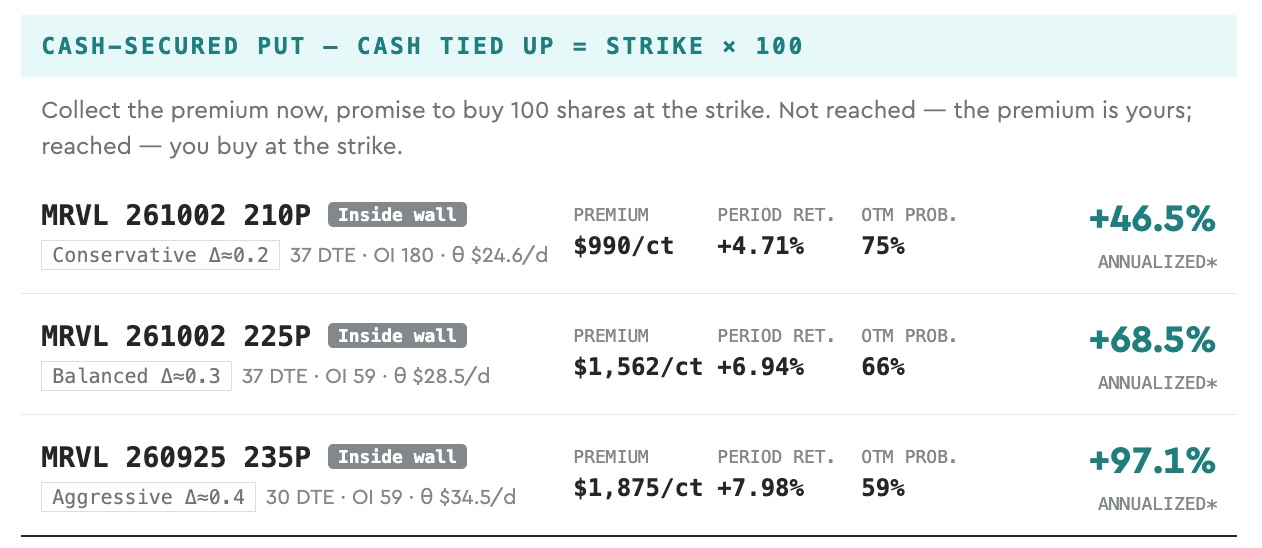
How you read the table matters more than the table itself — one line per tier:
Conservative (210 Put, ~46% annualised): your committed purchase price is 13% below the current price, with roughly a 75% chance of keeping the rent free and clear at expiry.
Balanced (225 Put, ~68% annualised): rent and buffer each give a little ground; about a 66% chance of keeping the rent.
Aggressive (235 Put, ~97% annualised): only a 59% chance of keeping the rent — close to a coin flip. At this tier, half the money comes from volatility, and half is a bet on direction.
But that 75% probability has a flip side — one time in four, the counterparty will exercise their right (the term is "assignment"), and you must take delivery of 100 shares at your committed price. No negotiation. Assignment is never "automatically safe". So whether you'd genuinely welcome buying at that price — and whether you could comfortably hold those 100 shares — matters far more than the annualised figure.
On earnings night, buyers are holding a lottery ticket that might pay 175%, and sellers are collecting an insurance premium written at a 135% ticket price. Both kinds of money exist. Just be clear about which one you're earning — then keep your position sized to what you can afford to lose.
Join the Options Trading Leaderboard
Got a view on tonight's move? Don't just think it — trade it, and see how you stack up against other forecasters.
Signing up is simple: open the Longbridge App, tap "Me" → "Events" → authorise and register. Done — and you can opt out at any time.
👉 [Options Trading Leaderboard]
Note: this event is open only to Longbridge Securities (Singapore) clients with options trading permission. Options are complex investment products. Leaderboard data is for display purposes only; other participants' trades do not constitute investment advice of any kind. All investments carry risk — please trade with care.
One Last Thing
Headlines → dashboard → screen: the same framework works for any other ticker. We've packaged it into a small open-source tool at github.com/hey997064-sys/options-seller — install the Longbridge CLI, enable US options market data, enter a ticker, and it generates the same report. Setup steps and screening rules are in the README. The metrics will change, the code will change, the screen will return more contracts some days and fewer on others — but the seller's logic stays the same: make no directional call; simply sell a commitment at a price you can live with, and pocket the time value.
We are traders, not gamblers.
Friendly reminder: All contracts and figures above are teaching examples screened from public market data and do not constitute investment advice or guidance of any kind. Selling options requires margin and carries assignment obligations; in sharp market moves you may be required to take delivery at the strike price and bear unrealised losses. All probabilities cited are model estimates, not guarantees of safety. Implied volatility swings sharply around earnings — you can get the direction right and still lose money to volatility moves. Please make decisions prudently based on your own risk tolerance. Investing involves risk; trade with caution.
$Invesco QQQ Trust(QQQ.US)$SPDR S&P 500(SPY.US)$NVIDIA(NVDA.US)$Alphabet - C(GOOG.US)$Lumentum(LITE.US)$Roundhill Memory ETF(DRAM.US)$SK Hynix(SKHY.US)









The copyright of this article belongs to the original author/organization.
The views expressed herein are solely those of the author and do not reflect the stance of the platform. The content is intended for investment reference purposes only and shall not be considered as investment advice. Please contact us if you have any questions or suggestions regarding the content services provided by the platform.