Gross Margin Analysis: A Core Metric for Assessing Company Profitability
Gross profit margin directly reflects a company’s product profitability. Understanding its formula, industry differences, and trend analysis is crucial for Hong Kong investors assessing a firm’s financial health.
TL;DR: Gross margin measures the proportion of a company's profit after deducting the cost of goods sold, serving as a core metric for evaluating product competitiveness and cost efficiency.
When reading financial statements, gross margin is often the first profitability metric investors focus on. For Hong Kong individual investors, whether analyzing Hong Kong stocks, US stocks, or multinational companies, gross margin is a key financial signal. It directly shows how much of each dollar of revenue a company retains after paying direct production costs, forming the foundation for ongoing operations and R&D. Mastering gross margin analysis helps us more accurately determine a company’s underlying profitability and long-term competitive edge.
What is Gross Margin?
Gross margin is the ratio of profit remaining after a company sells goods or services and deducts direct costs (i.e., cost of goods sold). Put simply, it reveals how much money a company actually keeps for every HKD 100 of products sold—funds that can be used to cover administrative, marketing, and R&D expenses, ultimately transforming into net income for shareholders.
Gross Profit vs. Gross Margin
Before understanding gross margin, it’s necessary to distinguish between two concepts:
Gross Profit: The absolute amount remaining after deducting the cost of goods sold from operating income, calculated in currency (such as HKD).
Gross Margin: The percentage of gross profit relative to operating income. As a relative metric, it’s better suited for comparing companies or performance over time.
For example: Suppose Company A’s gross profit is HKD 4 million, and Company B’s is HKD 8 million. At first glance, B seems to perform better. But if A’s operating income is HKD 5 million (gross margin of 80%) and B’s is HKD 40 million (gross margin of 20%), A’s product profitability is far higher than B’s. This illustrates the value of gross margin as a relative indicator.
Where Does Gross Margin Appear in the Income Statement?
In a consolidated income statement, gross profit appears at the very top of the profit hierarchy:
Revenue
Less: Cost of Goods Sold (COGS)
= Gross Profit
Less: Operating Expenses
= Operating Income
Plus/Minus: Non-operating income and expenses
= Profit before tax
Less: Income tax
= Net Income
Gross margin analysis focuses on the profitability of “the product itself,” excluding indirect factors like management, taxes, and financing.o thoroughly understand financial analysis at other levels and evaluate a company's overall operational landscape, it is recommended to read this alongside our comprehensive "Income Statement Analysis" guide to build a more holistic framework for deciphering financial reports.
How is Gross Margin Calculated?
The formula for gross margin is straightforward:
Gross Margin = (Revenue - Cost of Goods Sold) ÷ Revenue × 100%
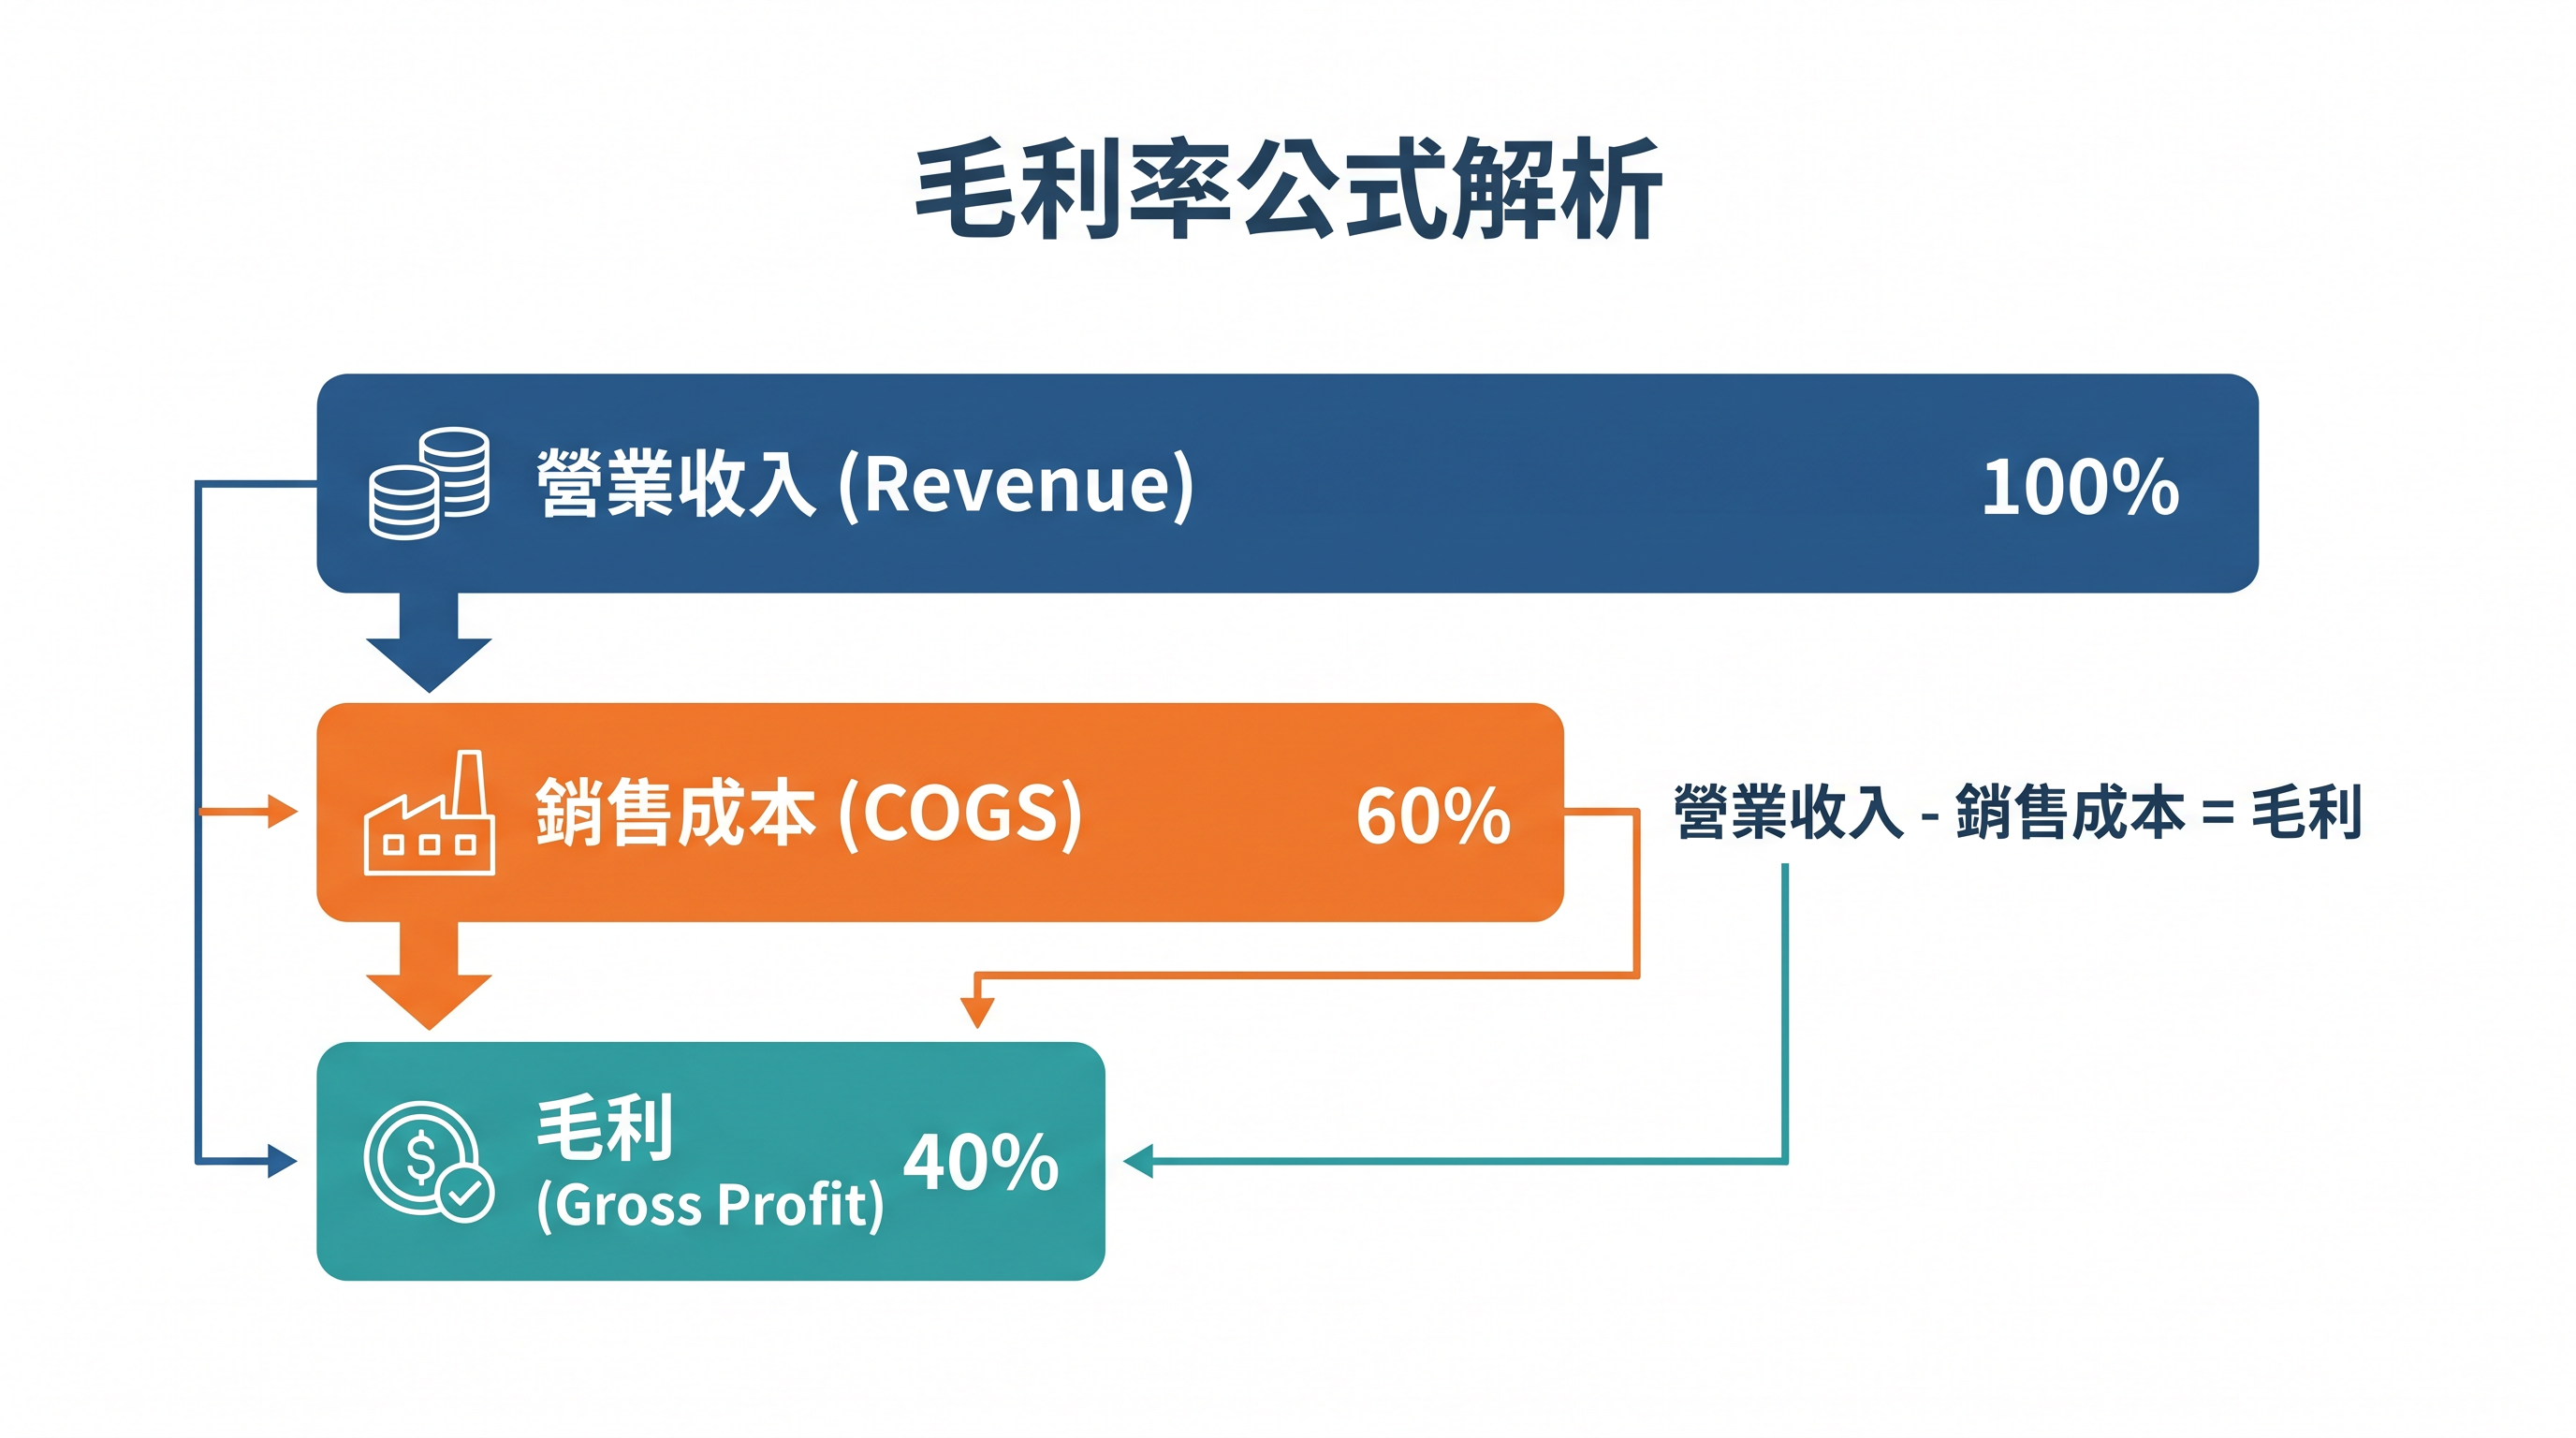
Example Calculation
Let’s assume a retailer reports the following annual financial data:
Revenue: HKD 10 million
Cost of Goods Sold (including purchase cost, direct labor, manufacturing expenses): HKD 6 million
Calculation steps:
Gross Profit = HKD 10 million - HKD 6 million = HKD 4 million
Gross Margin = HKD 4 million ÷ HKD 10 million × 100% = 40%
This means that for every HKD 100 in sales, the company retains HKD 40 to pay for management, salaries, and other costs, ultimately forming net profit.
What’s Included in Cost of Goods Sold?
Cost of Goods Sold (COGS) doesn’t only refer to "purchase cost"; it covers all expenses directly related to producing or delivering a product/service, including:
Cost of raw materials or purchased goods
Direct labor expenses (wages)
Manufacturing expenses (such as allocated plant rent, equipment depreciation, etc.)
Note that indirect costs like administrative salaries and marketing expenses are not included in COGS, but are classified as "operating expenses." These affect operating margin directly, not gross margin.
Tip: Different companies may treat COGS accounting differently. When analyzing, pay attention to the notes in financial statements to ensure consistent comparisons.
How to Interpret Gross Margin Levels?
Gross margin isn’t always “the higher the better,” and there’s no universal “reasonable standard.” Interpretation should consider industry characteristics and company background.
Industry Differences Set the Benchmark
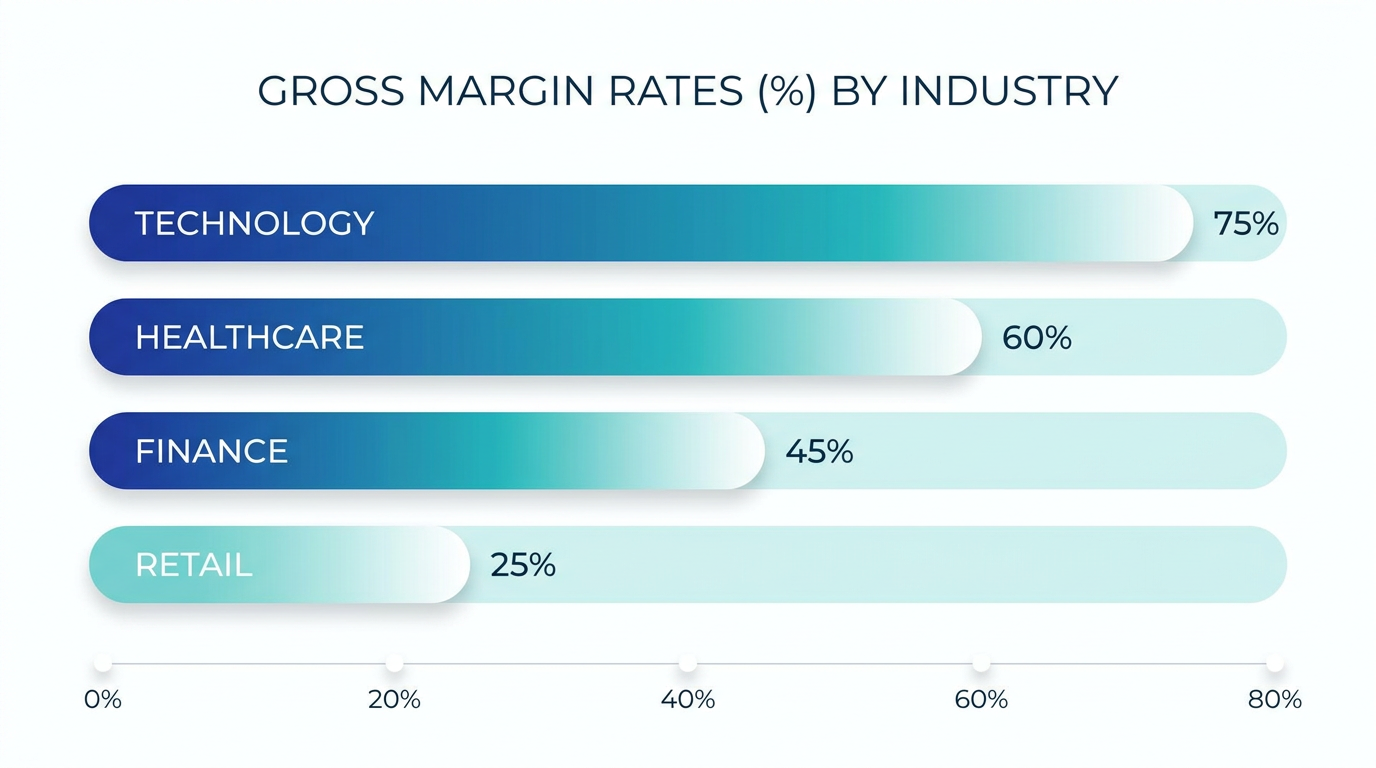
Gross margin varies greatly across industries, depending on each sector’s business model, competitive landscape, and cost structure:
- Technology & Software: Usually boasts gross margins of 60%–80% thanks to minimal incremental production costs as business scales.
- Pharmaceutical & Biotech: Generally 50%–70%. R&D investment is high, but approved drugs hold strong pricing power.
- Consumer Goods & Retail: Typically 20%–40%. High competition and product similarity limit pricing flexibility.
- Manufacturing & Industrial: Typically 10%–25%. High proportions of raw material and labor costs, and scale brings an edge.
- Restaurant & Food Service: Gross margins often 30%–50%, but high rent and labor costs usually result in much lower net margins.
What Does High Gross Margin Indicate?
A high gross margin typically reflects strong pricing power, a significant brand premium, or strengths in supply chain management.
Does Low Gross Margin Mean a Company is Weak?
Not necessarily. Some large-scale retail giants may have gross margins below 10%, but can still generate solid absolute profits due to impressive turnover rates and sales volumes. The key is a horizontal comparison with industry peers.
Gross Margin Trend Analysis: Dynamics Matter More
Looking at gross margin at a single point in time has limited meaning—tracking its trend tells you much more. You can use Longbridge’s market data tool to observe a company’s performance over multiple quarters.
Rising Gross Margin
May reflect successful price increases, optimization of product mix, or improved purchasing power.
Stable Gross Margin
In highly competitive industries, stable gross margin indicates a company has a "moat" that helps withstand competitive pressures.
Declining Gross Margin
Investors should be alert—it may result from soaring raw material costs, forced price wars, or lost market share in high-margin products.
Tip: A short-term drop in gross margin isn’t always negative; if coupled with rapid market share gains, it may signal a strategy to sacrifice short-term profit for long-term growth.
Comparing Gross Margin to Other Profitability Metrics
Gross margin is only the first layer of profit analysis. To fully evaluate a company, other profitability ratios should also be considered. You can use Longbridge’s analytical tools to review multiple financial indicators at once.
The Hierarchy of Three Key Profit Margins
Think of these three indicators as filters, each removing different costs:
| Metric | Calculation | Focus of Analysis |
|---|---|---|
| Gross Margin | Gross Profit ÷ Revenue | Product-level profitability |
| Operating Margin | Operating Profit ÷ Revenue | Overall operating efficiency |
| Net Margin | Net Income ÷ Revenue | Comprehensive profitability post-tax |
Special Note for Service Industries
For IT, consulting, and financial service companies, labor is the main cost, and labor expenses are usually listed under "operating expenses," not "cost of goods sold." These companies often show high gross margins, but their true competitive strength lies in operating and net profit margins.
How Can Companies Improve Their Gross Margin?
From a management perspective, there are two main ways to improve gross margin:
Boosting Revenue (Numerator)
- Strengthen brand positioning to achieve a higher brand premium
- Invest in R&D to launch high-value products with technological barriers to entry
- Optimize product mix to increase the share of high-margin products or services
Reducing Costs (Denominator)
- Increase purchasing scale to enhance bargaining power with suppliers
- Streamline production and incorporate automation to lower direct labor costs
- Improve supply chain management to reduce waste and inventory backlog
Tip: For investors, it’s more meaningful to analyze how a company achieves revenue growth while maintaining or improving gross margin than to focus only on gross margin as an absolute value.
Limitations of Gross Margin
Gross margin is a powerful analysis tool, but it has its limits.
Doesn’t Cover All Expenses
Gross margin only reflects the deduction of direct costs, not indirect expenses such as non-production staff salaries, rent, advertising, or R&D. A company with a 60% gross margin could still have a single-digit net margin if its R&D and marketing spending is high.
Impact of Accounting Methods
Different companies may classify COGS differently. For instance, some might include warehousing in COGS, while others treat it as operating expense. When comparing companies, review the accounting policies in the financial statement notes.
Doesn’t Show Cash Flow Health
A company might report a high gross margin, but if receivables are slow to collect, real-life cash flow could still be tight. Always view gross margin alongside the cash flow statement for a more accurate financial assessment.
To further your financial analysis skills, check out the educational resources at Longbridge Academy, which cover topics from introductory to advanced and help you build a systematic investment analysis framework.
Frequently Asked Questions
What’s the Difference Between Gross Margin and Net Margin?
Gross margin deducts only direct costs of sales, reflecting the profitability of the products themselves. Net margin, on top of gross profit, deducts all operating expenses, non-operational gains/losses, and taxes, showing the final profit ratio. The greater the gap between the two, the higher the company’s indirect expenses (such as management, R&D, and advertising).
What Gross Margin is Considered Reasonable?
There’s no universal standard. Tech and software can reach above 60%; manufacturing may only have 10–20%—both can be normal. Always use the industry average for peer comparison, not direct cross-sector comparisons.
Does a Declining Gross Margin Always Signal Company Trouble?
Not always. Short-term drops might result from proactive price cuts to capture market share, higher early production costs for new products, or strategic investment in new markets. Judge using company explanations, revenue trends, and peer performance in the same period.
What Other Metrics Should Accompany Gross Margin Analysis?
It’s recommended to also check: Operating Margin (excluding one-off effects), Net Margin (final profitability), Return on Equity (ROE, measuring capital efficiency), and Free Cash Flow (true cash-generating ability).
How Can Investors Find a Company’s Gross Margin Data?
The income statement lists revenue and cost of goods sold, allowing calculation of gross margin. HK-listed firms must periodically disclose financial results per HKEX requirements. You can find these through the HKEX website or major financial platforms.
Conclusion
Gross margin is an essential starting point for assessing a company’s profitability, rapidly revealing product competitiveness, cost control, and pricing power. But remember: trends are more valuable than single values, peer comparison is more meaningful than cross-industry comparison, and gross margin should always be interpreted alongside operating margin, net margin, and cash flow for a complete evaluation.
For Hong Kong investors, mastering gross margin analysis is an efficient way to quickly screen for competitive companies among many financial metrics and lays a solid foundation for deeper research.
Choosing analytical tools and investment approaches should depend on your personal goals, risk tolerance, market perspective, and experience. Whatever tool you select, always be sure you fully understand how it works, its risk characteristics, and trading rules, and establish a suitable risk management plan. Learn more about investing at Longbridge Academy or by downloading the Longbridge App.