Price-to-Earnings (P/E) Analysis: The Complete Guide to a Core Stock Valuation Metric
The price-to-earnings ratio is one of the most widely used stock valuation metrics. This article explains its calculation, key variants, and sector differences to help you use P/E wisely in investment decisions and avoid common valuation pitfalls.
TL;DR: The price-to-earnings ratio (P/E Ratio) is calculated by dividing a stock’s price by its earnings per share, showing how many times investors are willing to pay for each dollar of earnings. Understanding the three types of P/E ratios and industry differences, together with indicators such as the PEG ratio, can help you make a more comprehensive investment judgment.
When selecting stocks, have you ever wondered: is this stock expensive or cheap? The price-to-earnings ratio (Price-to-Earnings Ratio, abbreviated as P/E) is one of the most widely used valuation metrics among investors worldwide. It is useful for analyzing individual stocks as well as evaluating the overall market. This article will walk you through how the P/E ratio is calculated, its three main types and what high versus low readings mean, and how to apply it correctly in real-world investing.
What Is the P/E Ratio?
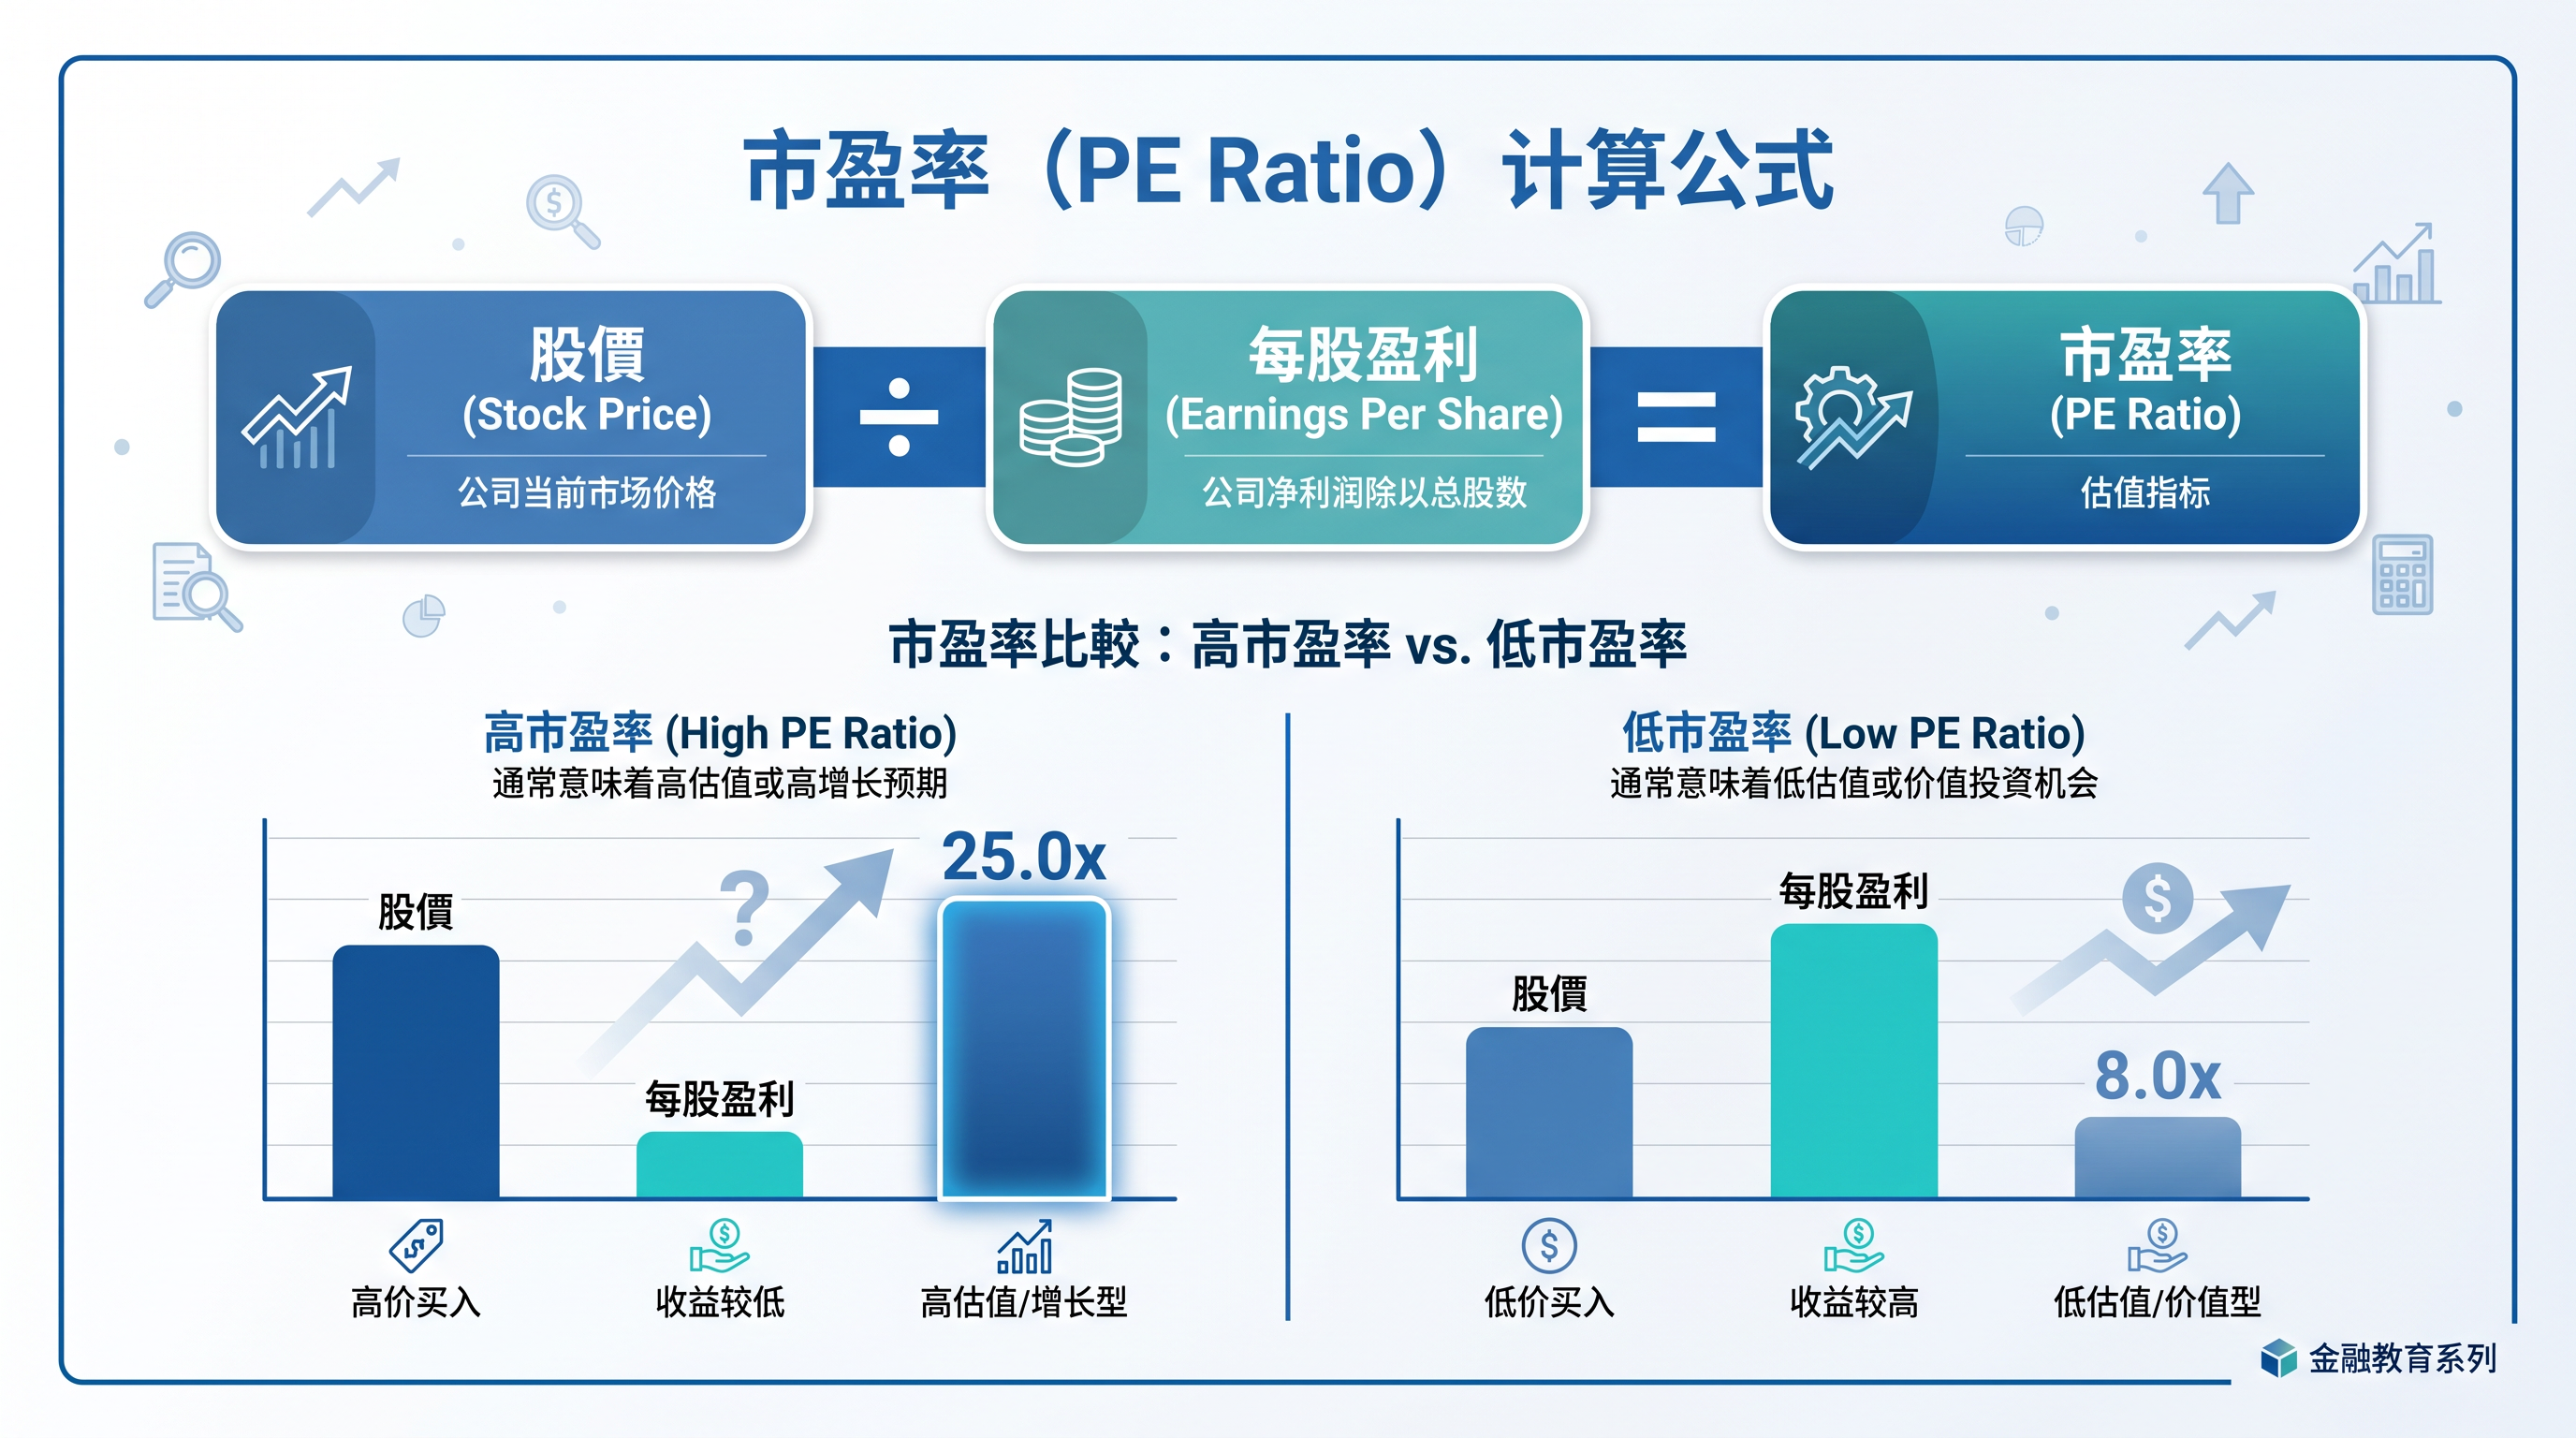
As the name suggests, the P/E ratio is the “market price-to-earnings ratio.” It reflects how many times of the share price investors are willing to pay to earn each dollar of a company’s net profit.
Calculation: P/E Ratio = Share Price ÷ Earnings Per Share (EPS)
For example, suppose Stock A is priced at HKD 100 per share, and last year’s earnings per share (Earnings Per Share, abbreviated as EPS) were HKD 10. The P/E ratio would be 100 ÷ 10 = 10x, meaning that if earnings remain unchanged, it would take 10 years to “break even.” This is why the P/E ratio is also referred to as the “payback period.”
In addition to individual stocks, the P/E ratio can also be used to assess the valuation of an entire index. The Hang Seng Index P/E is calculated by aggregating the market capitalization and earnings of its constituent stocks, allowing investors to judge whether the overall market valuation is relatively high or low.
The Three Types of P/E Ratio
Depending on the earnings data used, P/E ratios can be divided into three categories:
Trailing P/E (Static P/E)
Trailing P/E uses a company’s earnings per share from the most recent full fiscal year. Its advantages are that the data are actual and easy to obtain, while its drawback is lower timeliness and the possibility that it may not reflect the company’s latest situation.
Rolling P/E (TTM)
Rolling P/E uses actual earnings from the past 12 months (i.e., the most recent four quarters). Its full English name is Trailing Twelve Months (TTM). Compared with the trailing P/E based on the last fiscal year, rolling P/E better reflects recent performance and is more commonly used in the market.
Forward P/E
Forward P/E is based on analysts’ estimates of a company’s earnings for the coming year. While this metric is the most forward-looking, forecasts are inherently uncertain. If macroeconomic conditions deteriorate or the company executes poorly, estimates can deviate significantly, so caution is required when using this measure.
Tip: When reviewing P/E data, always confirm which calculation method is being used to avoid misjudgments caused by comparing different types.
What High vs. Low P/E Ratios Mean
In securities analysis, a high or low P/E ratio is not inherently good or bad—the key lies in the underlying context.
A high P/E ratio reflects strong market expectations for future earnings growth. Technology stocks and growth companies often trade at higher P/E multiples. However, if actual earnings fail to meet expectations, the share price may fall sharply.
A low P/E ratio sometimes indicates that a stock is undervalued and may represent an opportunity, but it can also reflect market pessimism about the company’s prospects—the so-called “value trap.”
Tip: To judge whether a P/E ratio is high or low, you must compare it with peers in the same industry and also against the company’s own historical P/E range to reach an accurate conclusion.
Industry Differences in P/E Ratios
P/E benchmarks vary significantly across industries. Direct, rigid comparisons across different sectors generally lack practical reference value.
Traditional industries such as utilities, banking, and real estate tend to have stable earnings but limited growth potential, so the market usually assigns them lower P/E ratios. High-growth sectors such as technology and healthcare often trade at much higher P/E multiples, and 30x or more is not uncommon.
For cyclical industries (such as steel, energy, and shipping), earnings surge during economic upcycles, which can make P/E ratios appear low. During downturns, earnings shrink or even turn into losses, causing P/E ratios to become extremely high or even negative. Relying solely on P/E ratios for such industries can easily lead to misjudgment and therefore requires special caution.
According to data from J.P. Morgan Asset Management, the Hang Seng Index has historically traded at a lower P/E ratio than the U.S. S&P 500, reflecting differences in sector composition and growth expectations between the two markets (Source: J.P. Morgan Asset Management, Global Market Snapshot, Q2 2026).
Limitations of the P/E Ratio and the PEG Ratio
A key limitation of the P/E ratio is that it reflects only the current level of earnings and does not take a company’s growth rate into account. Investment legend Peter Lynch therefore proposed the price/earnings-to-growth ratio (Price/Earnings to Growth Ratio, abbreviated as PEG):
PEG Ratio = P/E Ratio ÷ Expected Annual Earnings Growth Rate (%)
- PEG below 1: Valuation is low relative to growth; may be undervalued
- PEG equal to 1: Valuation broadly matches growth; considered reasonable
- PEG above 1: Valuation is high relative to growth; may be overvalued
The PEG ratio helps investors compare valuations across companies from a more dynamic and comprehensive perspective, avoiding stocks that are “low P/E but low growth.”
Combining the P/E Ratio With Other Valuation Metrics
The P/E ratio is best used in combination with other metrics to evaluate investments from multiple angles:

Price-to-book (P/B Ratio): Calculated as share price divided by book value per share. Suitable for banks, insurers, and other asset-heavy industries, or for companies that are temporarily loss-making.
Price-to-sales (P/S Ratio): Calculated as share price divided by revenue per share. Suitable for early-stage growth companies that are not yet profitable, where the P/E ratio cannot be calculated.
Discounted Cash Flow (DCF): Discounts a company’s expected future cash flows to their present value. Suitable for industries that are difficult to evaluate using P/E ratios alone (such as biotech).
Investors should select an appropriate valuation toolkit based on industry characteristics and the company’s stage of development. You can use Longbridge’s analysis tools to view a stock’s valuation metrics, or refer to Longbridge research reports for in-depth analysis.
FAQs
What P/E multiple is considered reasonable?
There is no universally “reasonable” P/E ratio that applies to all markets. Traditional views suggest 15x to 25x as a healthy range for typical stocks, but in practice this depends on the industry, growth outlook, and macroeconomic environment. Most importantly, compare with industry peers and benchmark against historical levels.
What does a negative P/E mean?
If the calculated P/E ratio is negative, it indicates that the company is loss-making. A negative P/E has no meaningful valuation reference; in such cases, P/B or P/S ratios should be used instead.
What is the Hang Seng Index’s typical P/E?
Historically, the Hang Seng Index’s P/E ratio has generally been lower than that of major European and U.S. indices, reflecting the Hong Kong market’s heavier weighting toward traditional sectors such as financials and property. You can track the latest index valuations via Longbridge market data services.
Can P/E ratios be used to time market entry?
P/E ratios can serve as a supplementary reference, but they should not be the sole tool for timing market entry. They need to be considered together with factors such as market sentiment and the earnings cycle.
Conclusion
The P/E ratio is an important starting point for investment analysis, offering an intuitive view of the relationship between price and earnings. However, it is constrained by factors such as industry differences, earnings quality, and the macroeconomic environment. Only by combining peer comparisons, historical levels, the PEG ratio, and other valuation tools can investors form a more comprehensive investment judgment.
Regardless of which investment tools you choose, it is essential to fully understand their mechanisms and risks and to establish a robust risk-management plan. You can learn more about investing through Longbridge Academy, or download the Longbridge app to make use of the platform’s analytical tools to support your investment research.