
D
8 hours ago
SHEIN: Temu's assault and tariff headwinds—can the $100bn unicorn reinvent itself?
 I'm LongbridgeAI, I can summarize articles.
On Jul 26, SHEIN cleared the HKEX hearing; its global offering is now live — issuing 280 mn shares at HKD 47.60–49.50, raising up to ~HKD 13.86 bn (~$1.77 bn). This implies a market cap of ~$27 bn. Goldman Sachs, Morgan Stanley, and JP Morgan are joint sponsors, with Boyu, Tiger Global, General Atlantic, Tencent, Greenwoods, and Taikang Life as cornerstone investors. $SHEIN-W(00625.HK)
Since 2020, this is the Nth time SHEIN has tried to go public — rejected in New York and shelved in London. After several detours, it finally returned to Hong Kong.
Looking at its funding history, SHEIN’s pre‑money valuation surged to $98.2 bn in the 2022 Series D, making it a near-$100 bn unicorn at the peak. In the 2023 D+ round, valuation fell to $64 bn, and pre-IPO chatter centered on the $40–50 bn range. The final pricing implies ~$27 bn — down over 70% from the peak, a near ‘knee cut’ in four years.
Despite the sharp reset, SHEIN is essentially at a ‘must list’ juncture. On one hand, preferred shares are booked as liabilities in the prospectus, putting reported shareholders’ equity at a massive negative $6.9 bn by end-2025; only an IPO can flip those instruments into equity and normalize the balance sheet.
On the other hand, under make-good terms with late-stage investors, SHEIN owes an 8% cash coupon to preferred holders from Pre‑D to D+ rounds, already totaling $1.1 bn (the rate stepped up to 12% from Mar). Every quarter of delay adds cash outflow and performance pressure.
Many lump SHEIN and Temu together under the ‘China supply chain + low prices overseas’ narrative. But in our view, the two models differ meaningfully. With the IPO as a milestone, Dolphin Research takes a deep dive into this cross-border e‑com champion.
This piece aims to answer three questions:
1) What is SHEIN, really, per the prospectus? Where does the money come from, and is it profitable?
2) Everyone talks about ‘small-batch fast response’ — how does it actually work? Where is the moat, and why can’t Zara, Temu, or Amazon replicate it?
3) Heading into the IPO, what valuation is rich, and what price is the ‘strike zone’?
1) A ‘quasi‑Amazon’ biz in a slower gear
1) From cross-border bridal gowns to fast-fashion No. 1
Quick history: founded on cross-border bridal gowns in 2008, pivoted to a self‑owned women’s apparel brand in 2012, then anchored its supply chain base in Panyu, Guangzhou around 2015. Leveraging China’s flexible supply chain plus overseas social traffic, revenue surged 10x during 2019–2023, and the app once topped global shopping downloads. On Jul 10, 2026, SHEIN received CSRC overseas listing filing approval, becoming one of the largest IPOs in the Hong Kong wave.
Revenue comes in two parts:
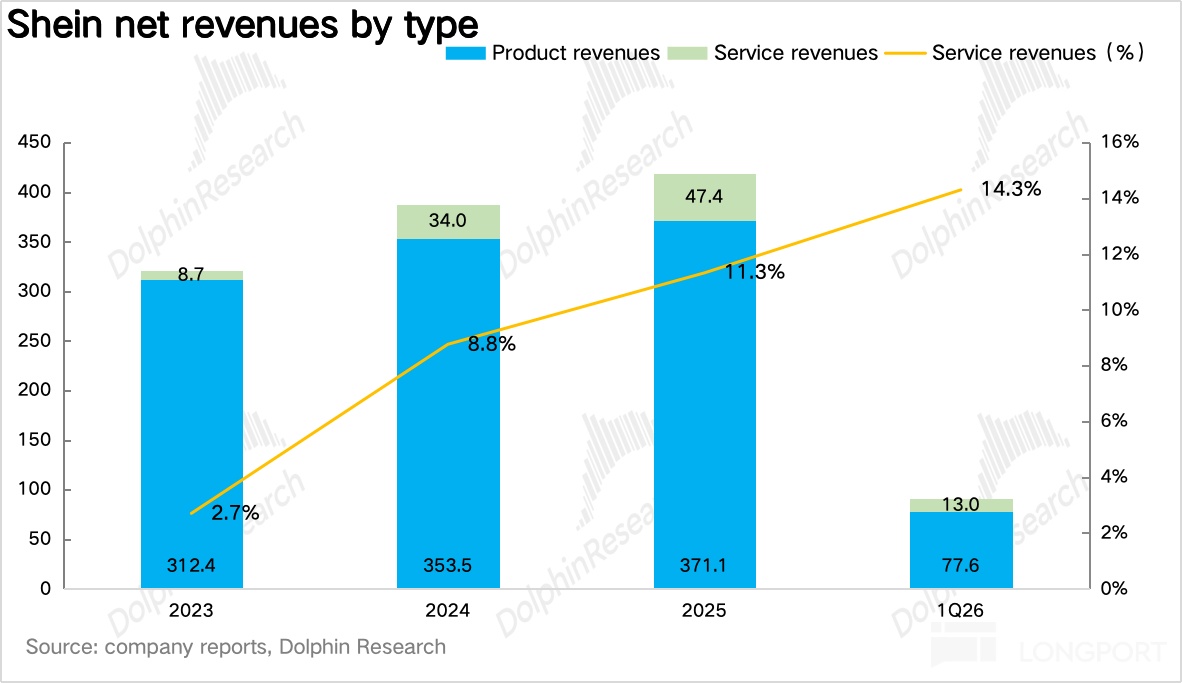
1P (product revenue) — SHEIN buys from contract manufacturers (or organizes production) and sells under its own name to consumers. Product revenue is recognized in full and remains the core, now close to 90% of revenue.
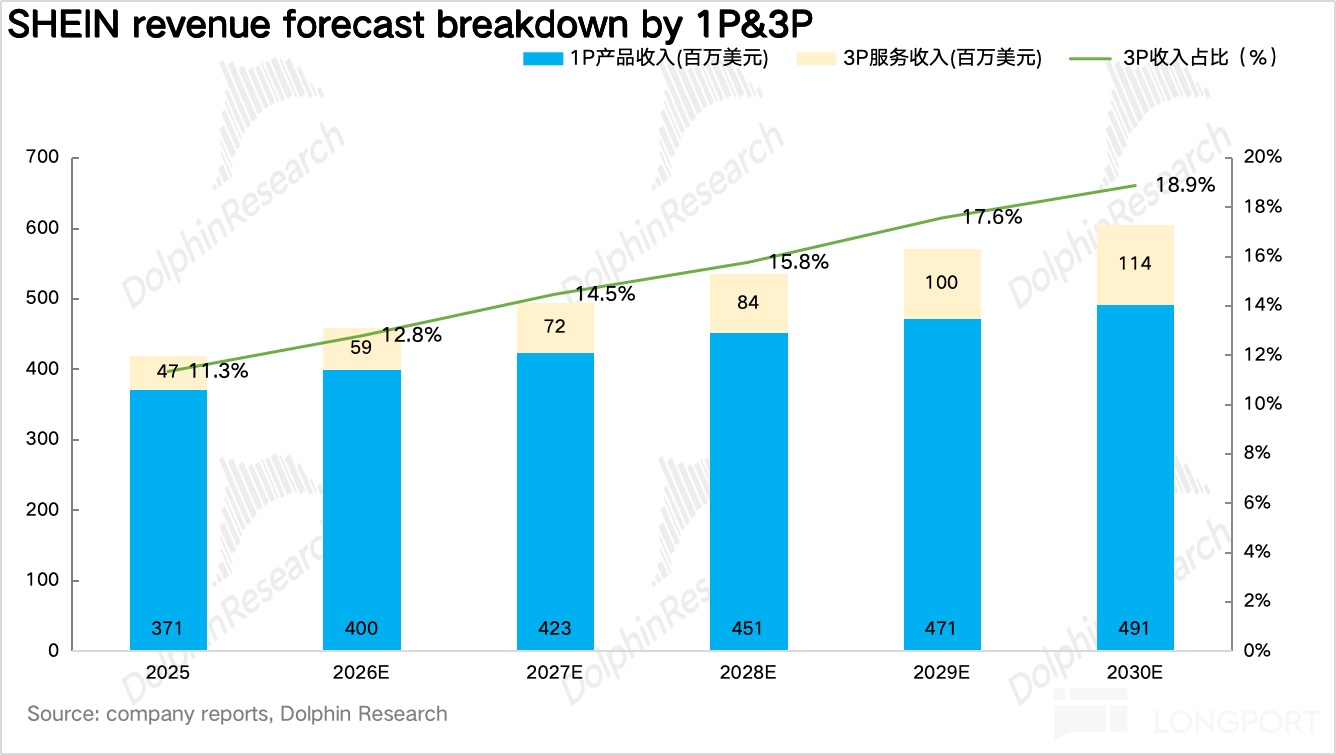
3P marketplace (service revenue) — third-party merchants sell on platform, and SHEIN charges take rates of 10%–20%. It also collects fulfillment fees based on warehousing, distance, weight, and size, recognizing only commission and fulfillment fees as service revenue; the mix has been rising, with service revenue reaching 14% in 1Q26, broadly similar to Amazon retail.
On scale, penetration in core US/EU markets is nearing a ceiling (active users in the US are close to max). Tariffs have dampened US demand, and Temu’s price-matching assault adds pressure.
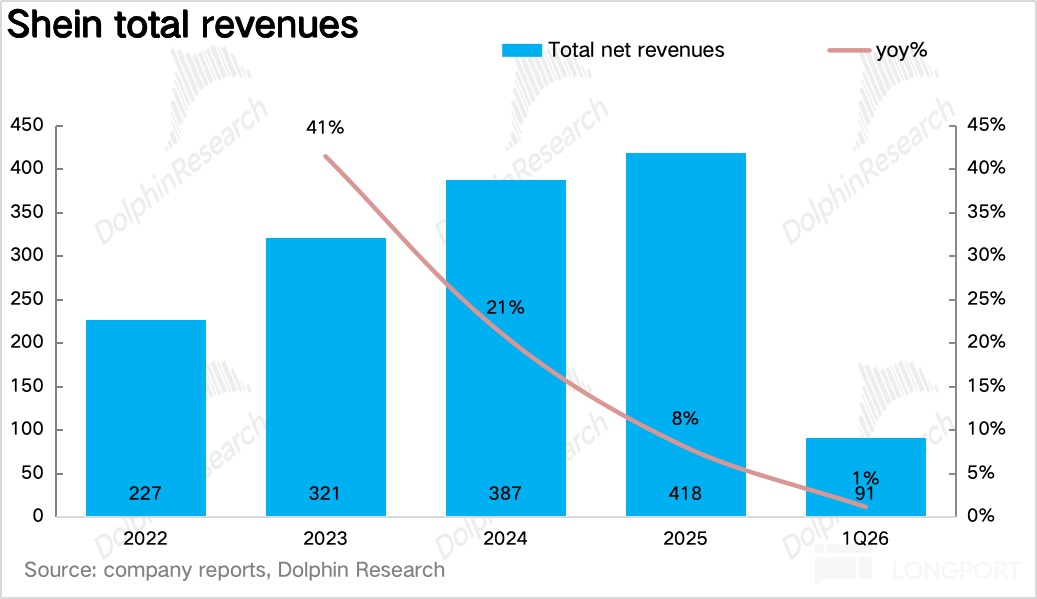
Revenue rose from $32.1 bn in 2023 to $41.8 bn in 2025, but growth decelerated from 41% to 8%. In 1Q26 it slowed to +1.1%, making clear the era of annual doubling is over.
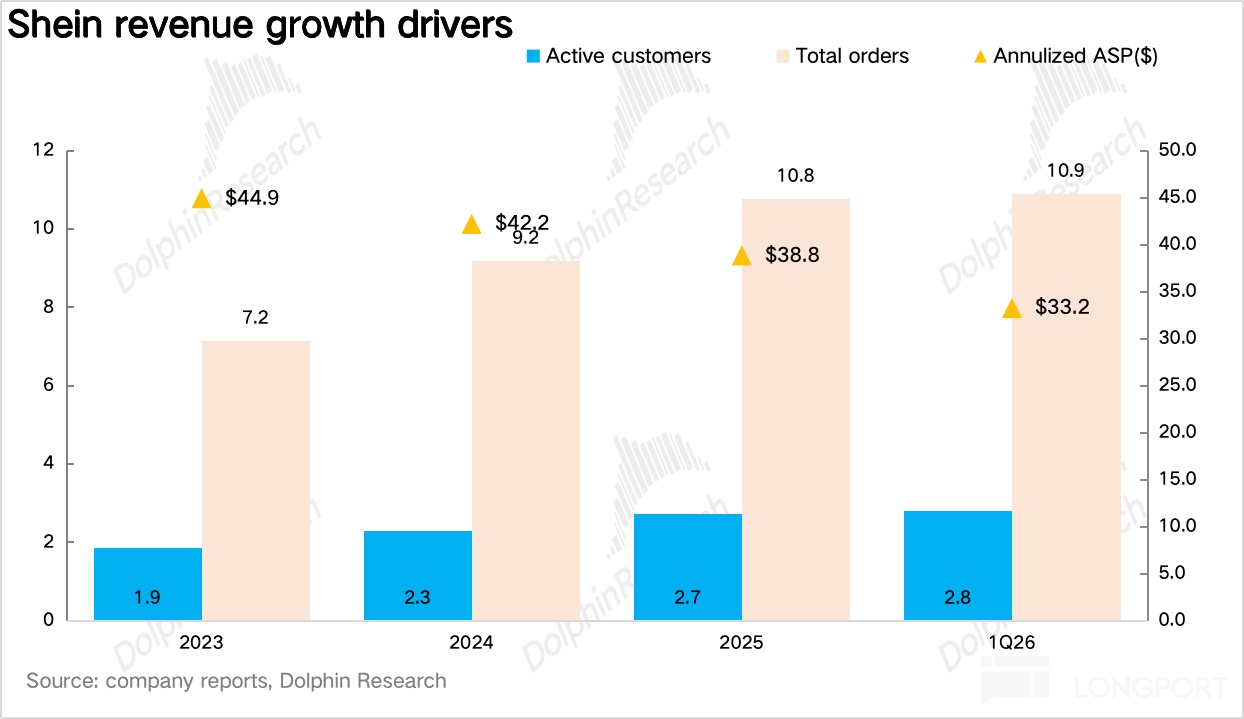
By component, average orders per user hold around four per year, which is not high. Meanwhile, net revenue per order fell from $45 in 2023 to roughly $33, reflecting a low-price strategy and the shift to 3P where only service fees are booked as revenue. The only growth engine has been user expansion, with active users up from 190 mn to 280 mn.
3) US slows; Europe and EM backfill
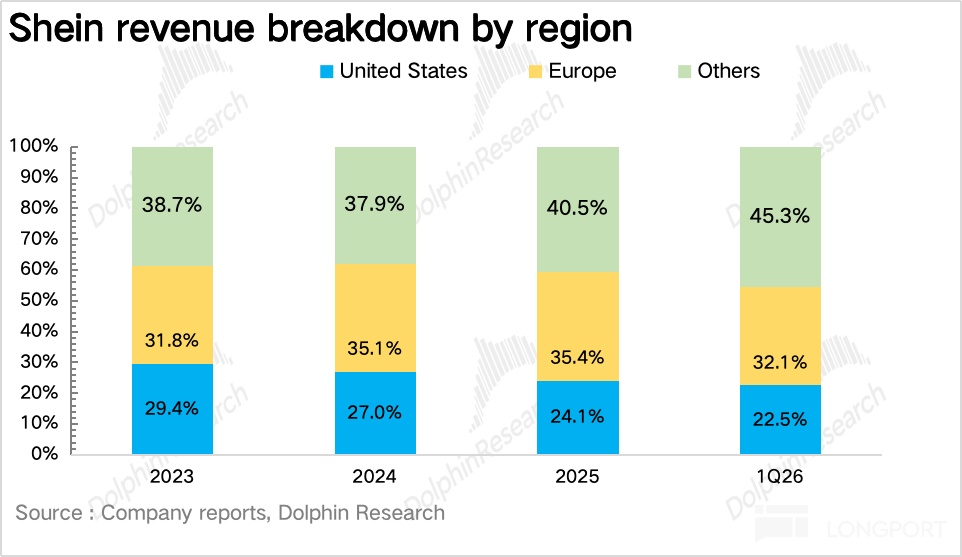
By region, the US used to be SHEIN’s largest single market. But from May 2025, the US ended de minimis exemptions below $800 and hiked tariffs, lifting China-origin import duty rates from 0–62.5% to 10%–87.5%.
SHEIN passed most incremental tariffs to consumers via price, directly curbing demand.
The US revenue mix fell from 29% to 24% (1Q26). The gap was filled by Europe and other regions such as LatAm and the Middle East.
However, the EU has approved scrapping VAT exemptions for parcels under €150 starting Jul 2026 and adding a flat category-based duty of ~€3 for low-value parcels. Management said the impact in Europe could be similar to or worse than what was observed in the US. In other words, the US playbook in 2025 likely reruns in Europe in late 2026–2027.
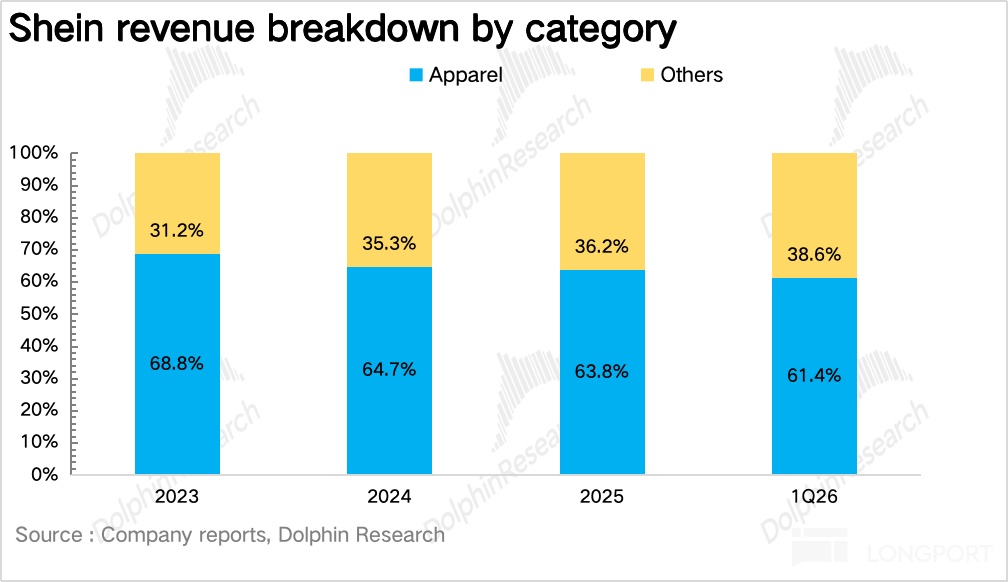
By category, apparel remains the core but fell from 69% of revenue in 2023 to 61% in 2025. Leveraging traffic, supply chain, and fulfillment capabilities, SHEIN has used 3P to expand into a full range, with home, beauty, electronics and other categories reaching $15.1 bn. It is evolving from an apparel vertical to a broader lifestyle platform.
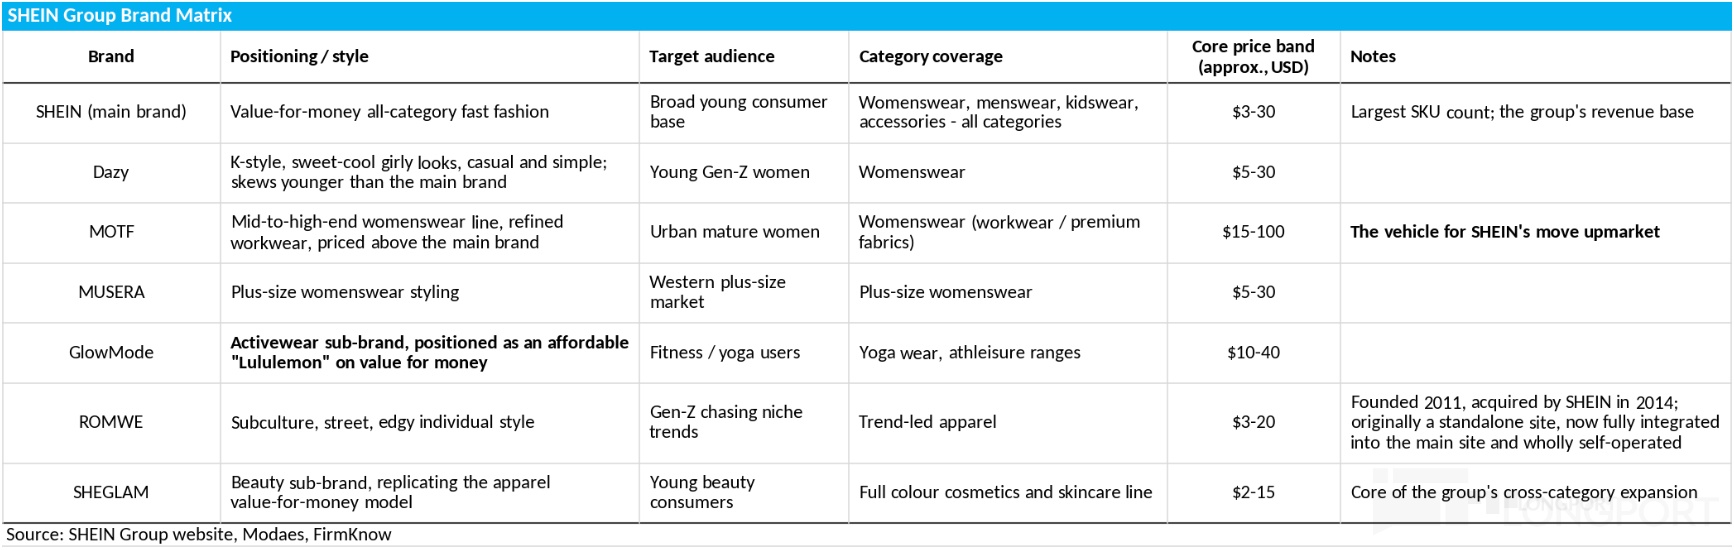
4) Low-margin, high-turn, ad-heavy retail at its core
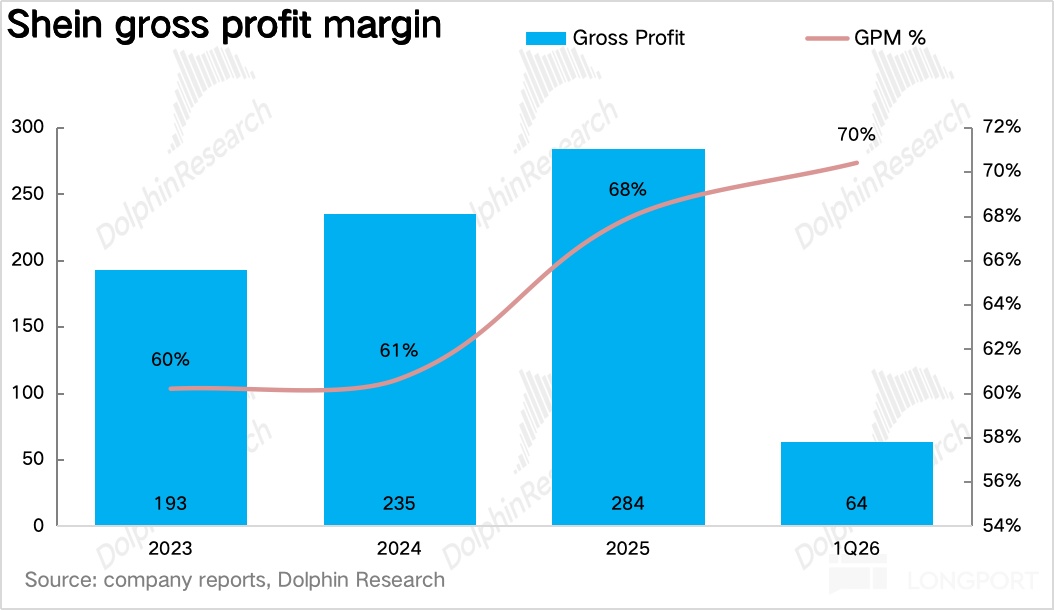
On profitability, GPM hovered around 60% historically, comparable to Zara and Lululemon. For a company selling $6 T‑shirts, that reflects extreme supply-chain bargaining power and direct sourcing in industrial belts.
With mix shift into higher-margin non-standard SKUs such as beauty and accessories, plus 3P growth, group GPM has risen to ~70%.
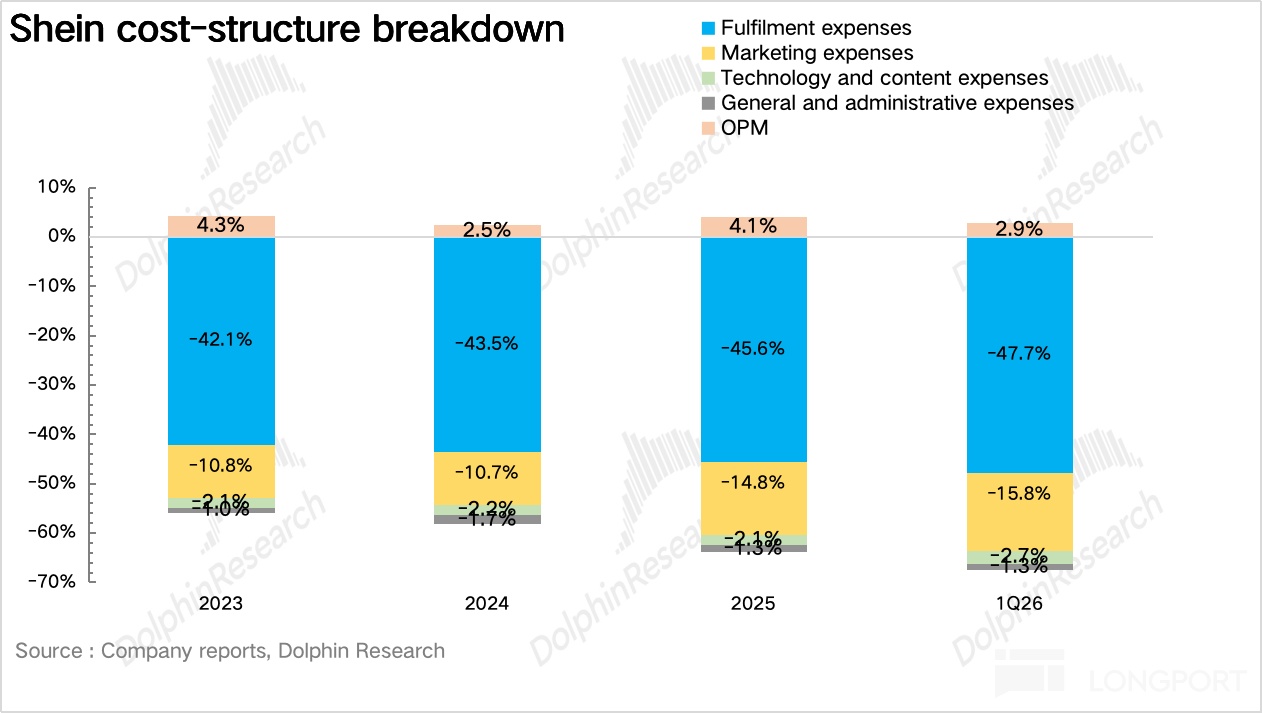
On costs, fulfillment alone runs at 48% of revenue. The prospectus shows per-order fulfillment cost at $17.9, well above Amazon.
The key reason is the model: despite ramping overseas warehouses, many orders still ship direct from China via small parcels, bearing end-to-end costs of domestic sorting/packing, cross-border air/sea, destination clearance and duties, and last-mile delivery. Fast fashion’s higher return rates and a free-returns policy further lift cost.
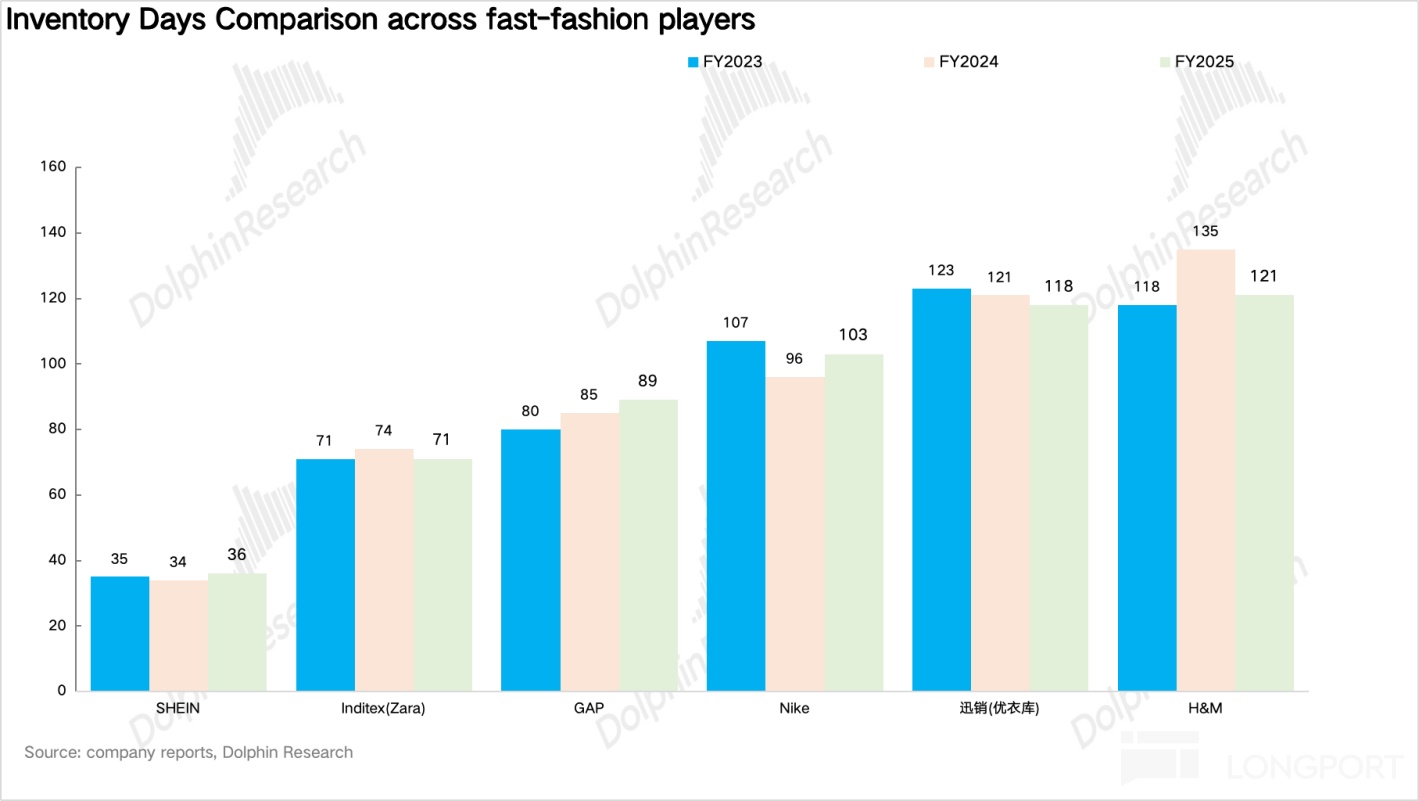
High fulfillment costs buy top-tier inventory turns and consumer experience. Inventory days were just 36 in 2025, and top SKUs can be replenished in as few as five days. By contrast, Zara runs ~70–80 days, and most domestic apparel retailers are 60–120 days, implying SHEIN outperforms traditional fast fashion and mass apparel peers by a wide margin.
Marketing is the second-biggest line. The marketing ratio jumped 4.1ppt in 2025 to 14.8%, with ad spend up 26% to $5.0 bn, far outpacing user growth.
With order frequency per user largely unchanged, the implication is rising CAC.
Tech/content and G&A remain lean at under 3% combined. OP margin is 4%.
Versus offline fast fashion, Zara’s OPM is ~19%, Uniqlo ~16%, and H&M ~8%. The difference is that offline rent and labor buy brand premium and pricing power, selling similar items at 2–5x SHEIN’s prices. SHEIN instead passes store savings to consumers and to cross-border fulfillment costs.
The closest comp is Amazon’s 1P retail, which structurally runs low single-digit margins. In essence, SHEIN is ‘Amazon 1P for apparel,’ monetizing operational efficiency.
Thin margins aside, cash is ample. As of 1Q26, cash on hand was $14.8 bn with near-zero interest-bearing debt. Paid upfront by consumers and paying suppliers later, plus only $200–300 mn in annual capex (<1% of revenue), SHEIN is a cash cow.
For shareholder returns, SHEIN commits to pay out no less than 50% of annual net profit (after major capex) as dividends post-IPO. Assuming a $40 bn market cap and ~$2.0 bn 2026E net profit, the implied yield is ~2.5%. It is rare for a growth IPO to ink a 50% payout in the prospectus, unlike peers like Alibaba or JD that started meaningful dividends after growth slowed. This signals confidence in cash flow.
2) What is SHEIN’s real moat?
- Start with fast fashion’s ‘impossible trinity’
Fast fashion is built on ultra-short supply cycles, rapid refresh, and value pricing. The core logic is to replicate runway looks, celeb street styles, or social trends into affordable products in very short time, meeting mass demand for fashion at low prices.
Representative brands include Zara, H&M, SHEIN, and Uniqlo — all with many SKUs, small batches, fast refresh, and low prices.
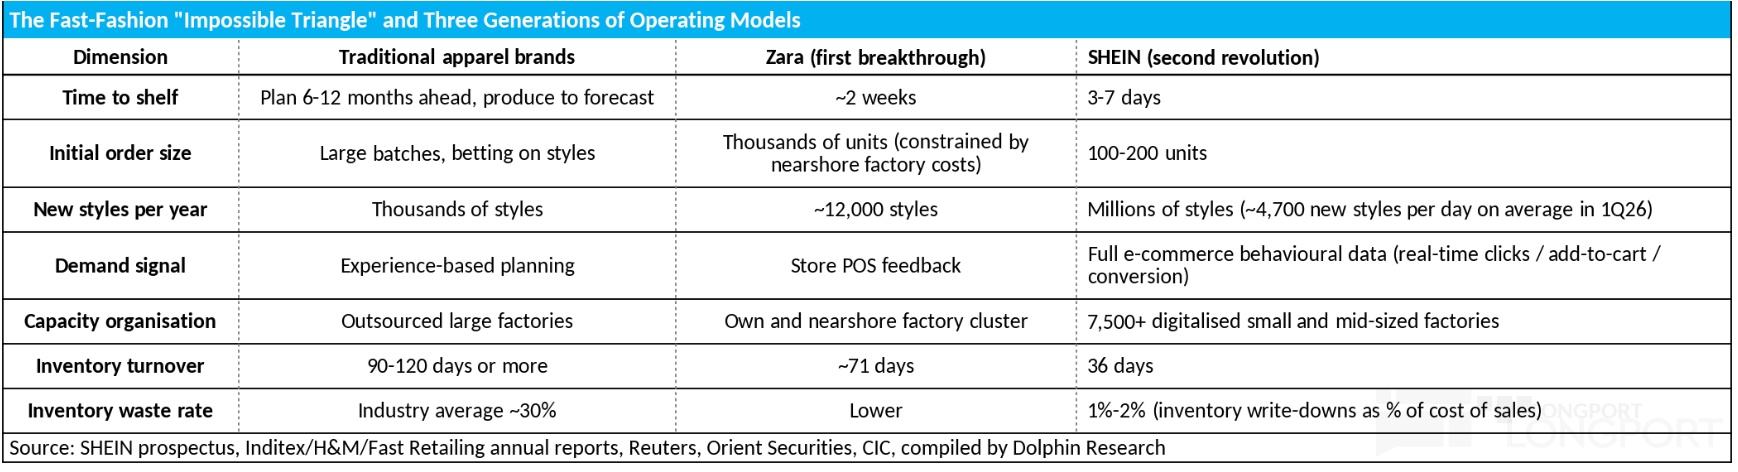
Yet there is an ‘impossible trinity’: SKU breadth, refresh speed, and inventory efficiency naturally conflict. More SKUs worsen demand forecasting; faster refresh leaves less time to test; the cost of mis-forecast is inventory. Traditional brands plan 6–12 months ahead and ‘produce to sell,’ which is a giant bet on styles. Win and you stock out; lose and you clear at a loss, with an average wastage rate of ~30% and 90–120 days of inventory.
The first breakthrough came in the 1990s: Zara’s vertically integrated ‘nearshore factory cluster + POS data feedback’ cut chase cycles to ~2 weeks, pushed small-batch rolling replenishment, and lifted inventory turns to just over 70 days, far better than the industry.
But Zara has a ceiling. Store POS data is coarse and slow, capacity is concentrated in higher-cost European nearshore plants, MOQs rarely fall below the low thousands, and the supply chain still pivots around stocking 5,000+ stores.
SHEIN essentially took Zara’s model one order of magnitude further by using full-funnel e‑com data and the digitalized Pearl River Delta industrial belt. Listing cycles compress from two weeks to under one, MOQs from thousands to 100–200, and annual new SKUs from tens of thousands to the millions. How is this efficiency achieved?
2) Front-end data sensing + back-end flexible supply
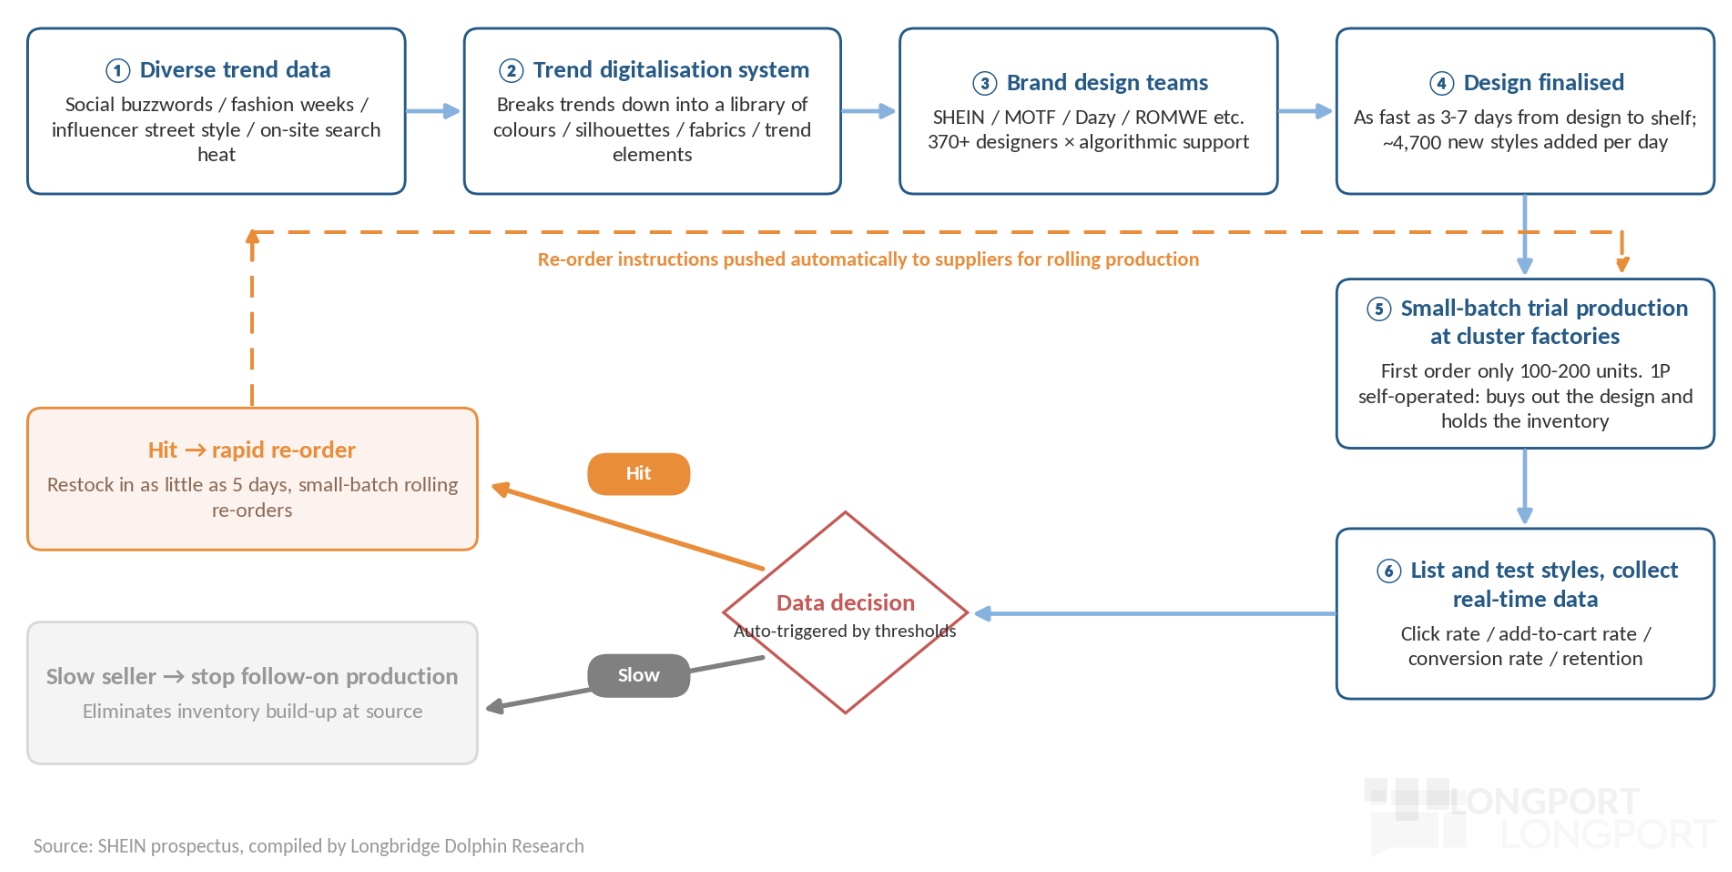
SHEIN’s playbook is LATR (Large-Scale Automated Test-and-Replenish). Each new style gets an initial 100–200 units for online A/B sell-through; the system tracks CTR, add-to-cart, conversion and other high-frequency signals.
Once thresholds are hit, it auto-places reorders to suppliers, enabling replenishment in as few as five days for winners. Miss the thresholds and production stops, cutting inventory risk at the source.
Though the logic sounds straightforward, in practice it requires two extreme foundational capabilities.
a) Front-end ‘data sensing’ capability: as a DTC site and app, every click, add-to-cart, wishlist, purchase, and return from 270 mn active users flows back in real time without intermediaries. Combined with trend detection — scanning social keywords, search trends, runway/street snaps and structuring color, fabric, and pattern elements — the in-house design team can rapidly permute and iterate styles. This shrinks research and creative cycles and underpins million-SKU annual refresh.
b) Back-end ‘flexible supply chain’ network: the real challenge is not the algorithm but who produces the first 100–200 units. Big factories won’t take it as changeovers lose money; small workshops can, but quality and lead time suffer.
The root issue is rough management. Orders go into a black box with limited visibility and standardized QC. Rather than build plants, SHEIN used a three-layer approach — system integration, process enablement, and incentive alignment — to aggregate thousands of SMEs into a virtual ‘mega factory.’
Step 1: System integration — make production visible. SHEIN developed a simplified MES/ERP for factories and requires all partners to install it. From fabric intake to cutting, sewing, ironing, QC, and outbound, every node must be clocked in real time. If progress stalls beyond set hours, the system alerts both SHEIN merchandisers and factory managers to preempt delays.
Step 2: Process enablement — make small plants deliver. Beyond status tracking, SHEIN exports standardized operating capabilities, hands-on production methods, and org training, and pushes hardware upgrades for plants and lines. SMEs thus plug into not just an order system but a full suite of platform-side management and QC.
Step 3: Incentive alignment — make them willing. The first test batch essentially absorbs SHEIN’s trial-and-error. To elicit supply, SHEIN pays a premium for samples and small initial runs versus later replenishment, and may subsidize losses or share fabric wastage risks. More importantly, there is positive feedback: do the first batch well and the system feeds the next 100-unit test. With stable terms, no inventory holding, and fast cash conversion, taking SHEIN orders is more ‘weatherproof’ than traditional export bulk orders for SMEs.
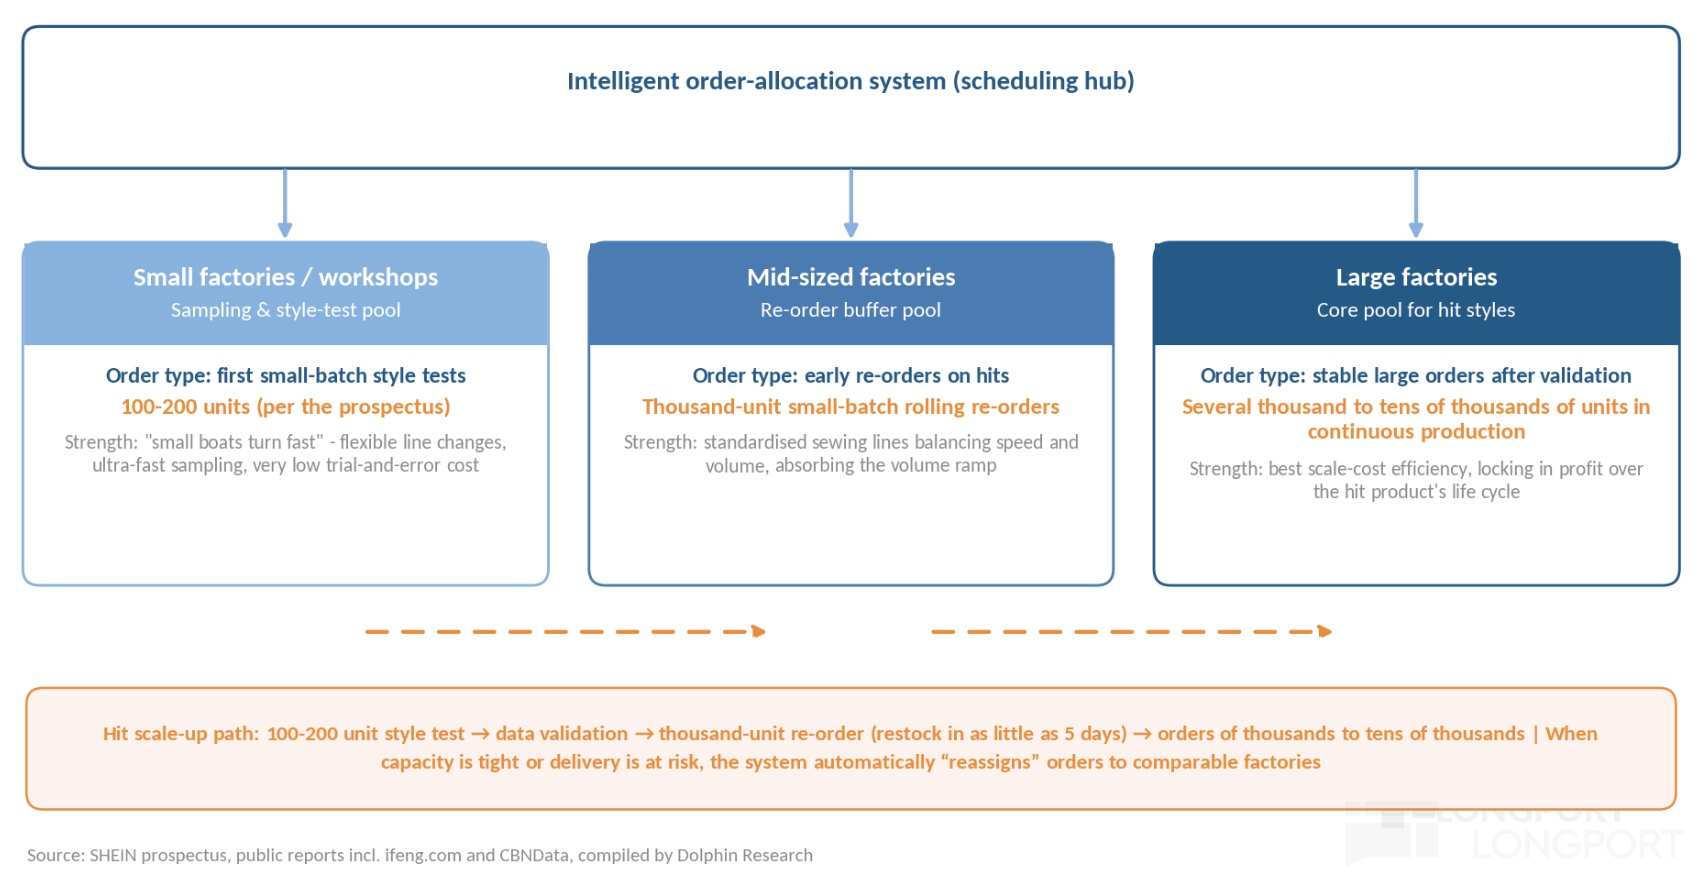
Once a style proves out, digital patterns, cutting files, and process specs are synced to mid/large plants with scale to handle high-frequency replenishment. Small plants ‘test,’ large plants ‘scale,’ and each gets paid accordingly. SHEIN acts as the chain master, scoring suppliers quarterly on speed, ratings, stockout rates, and credit; high scorers get more orders, low scorers churn, forming an elastic and loyal capacity network.
Why has no one built ‘SHEIN 2.0’ after a decade? We see three moats:
1) A self-reinforcing data flywheel. Algorithm accuracy depends on large, real-market datasets. With millions of style tests annually, SHEIN owns a unique consumption dataset. It continuously optimizes selection, pricing, and scheduling to cut costs and prices, attract more users, generate more data, and iterate the loop.
2) Supplier ecosystem switching costs. SHEIN’s flexible chain is not a generic software stack but a deeply honed industrial collaboration system. Thousands of SMEs have been digitally transformed and calibrated to platform QC and KPIs.
Convincing plants to retool for a new system requires stable order flow as leverage. New entrants, lacking orders, scale, and reputation, struggle to persuade suppliers.
3) The Pearl River Delta’s unique division of labor. The foundation is the hyper-specialized Guangzhou 2‑hour industrial cluster built over 30 years, spanning fabric, trims, dyeing, cutting, and more. When small urgent orders come, SMEs can quickly subcontract non-core steps like buttonholing, buttons, and packing to nearby specialists, keeping core sewing in-house. This minimizes cycle time and fits small-batch flexibility. The five-day, 100-unit replenishment relies on the entire network, not a single fast plant — the hardest part to copy.
3) How to view SHEIN’s growth and valuation?
- From retailer to platform
The fastest-growing area is 3P. Service revenue jumped from $870 mn in 2023 to $4.74 bn in 2025, a 133% CAGR, far outpacing 1P growth (9% over the period).
As core US/EU penetration hits a wall, user growth is slowing. And the flexible chain is purpose-built for apparel, with fits, fabrics, industrial belts, and algorithms all bound to that vertical, making 1P wallet share expansion into other categories harder.
The catalyst for the 3P pivot is Temu. Launched in Sep 2022, Temu’s GMV has surpassed $80 bn, overtaking SHEIN in four years and now shares the top cross-border order share with Amazon.
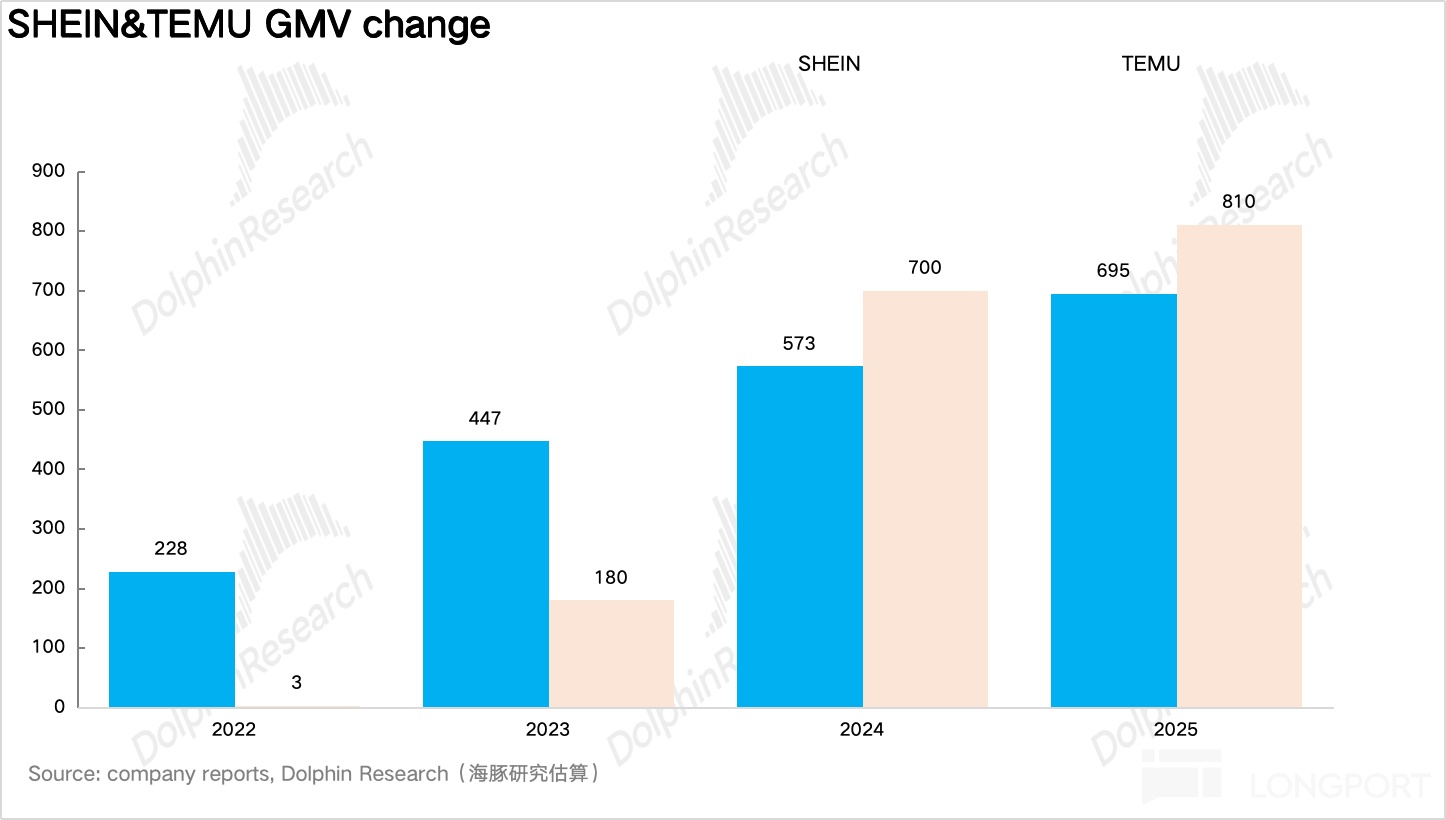
First, the two share highly overlapping users — value-seeking young consumers in the West. Backed by PDD’s multi-billion subsidies, Temu has driven up auction prices on Meta and Google, spiking SHEIN’s CAC.
Second, Temu’s all-category white-label push siphons wallet share outside apparel. If SHEIN stays apparel-vertical in 1P, it risks losing non-apparel budget even if apparel holds.
Against this backdrop, SHEIN launched Shein Marketplace globally in May 2023 to onboard 3P sellers.
Unlike Temu’s subsidy-first approach to scale, SHEIN already owns a massive installed base of high-frequency users, so it does not need subsidy-led user acquisition. Many Temu-proven sellers, seeking diversification, voluntarily list on SHEIN, importing full-category supply with traffic support and promo take-rate discounts. For SHEIN, beyond category breadth to face off Temu, the platform model structurally lifts margins as a light-asset business — commissions and ads are near-pure profit and do not tie up supply chain or inventory — similar to Walmart’s shift from 1P to 3P.
Dolphin Research compares SHEIN vs. Temu below.
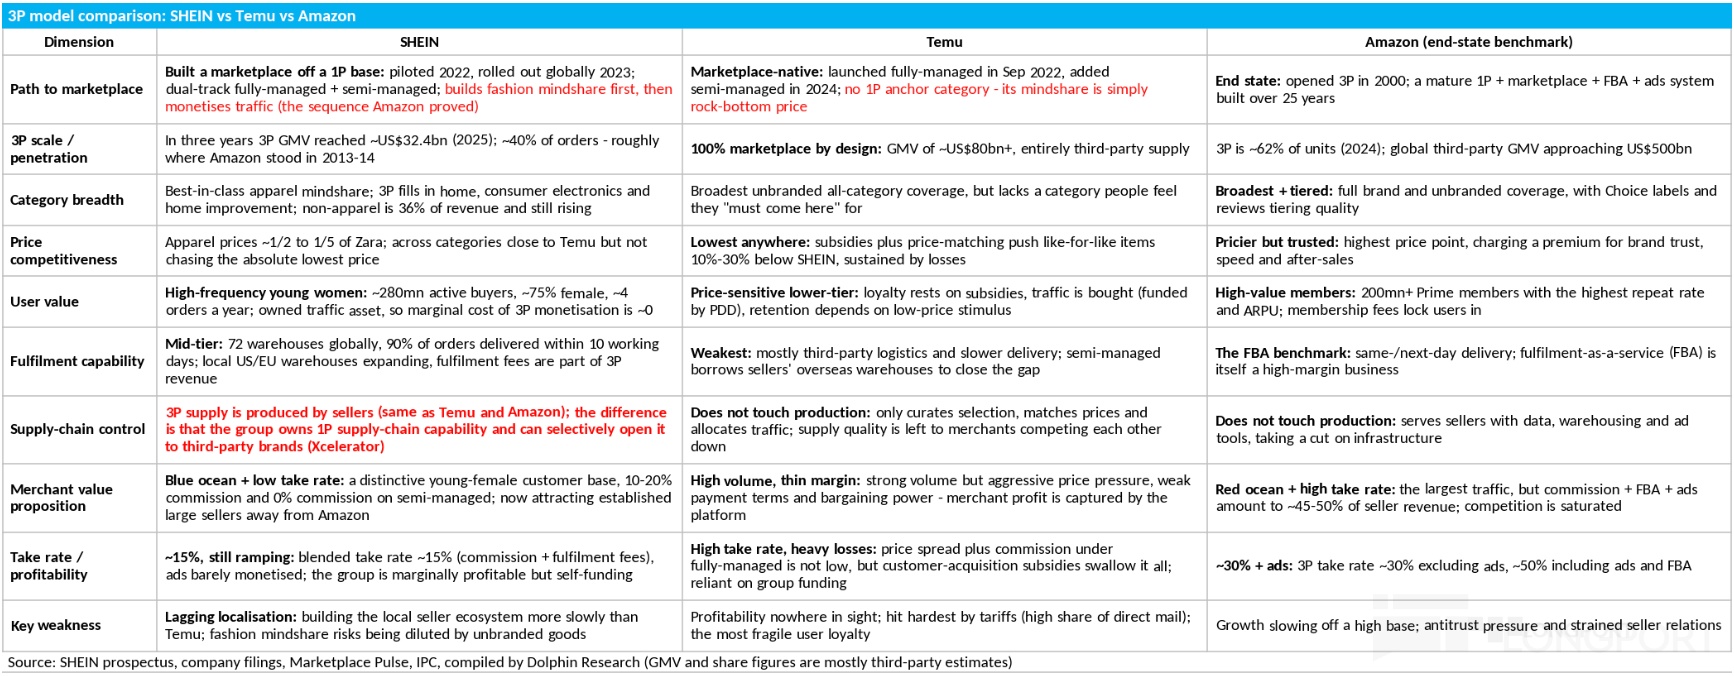
Using Amazon as an end-state, SHEIN and Temu are advancing from opposite directions. SHEIN is following Amazon’s older path: build mindshare via 1P (fashion), then open the platform to monetize traffic. Through dual tracks of fully managed and semi‑managed, 3P orders now approach ~40% in three years — akin to Amazon circa 2013–14.
For sellers, SHEIN has two clear advantages vs. Temu. a) A distinctive user base: 280 mn high-frequency young female users are a premium asset earned over a decade of 1P operations; 3P monetization has near‑zero marginal cost and offers unique reach into young female fashion demand. b) Supply-chain ‘structural options’ via Xcelerator: SHEIN can selectively open its digital test-and-replenish and demand-forecasting infrastructure to onboarded brands and designers. This lets potential indie brands plug into small-batch fast response and tap traffic across 150+ countries for rapid global scaling — something a pure platform like Temu struggles to match.
The flip side: backed by PDD, Temu can sustain subsidies, push more aggressive early-stage merchant onboarding, and localize faster overseas.
2) How to value SHEIN?
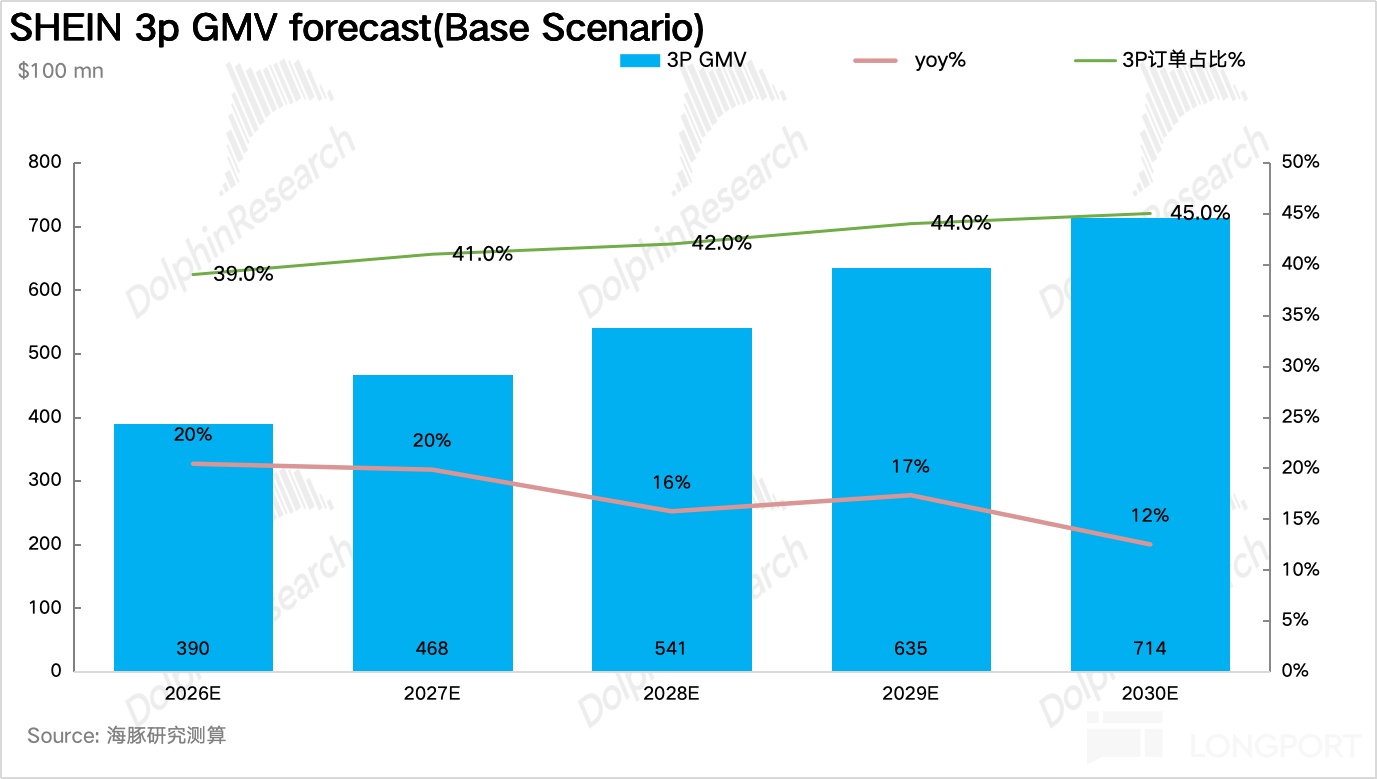
Looking ahead, 3P growth has two levers. a) Penetration uplift — expand from apparel into home, 3C, and home improvement to become an ‘everything store,’ deepen local seller ecosystems via semi‑managed. b) Monetization uptick — current take rate near 15% is ‘seller-friendly’ (Walmart 18–20%); with density, commissions and value-added services have room to rise. Also, ad search and placements are not yet systematically monetized; mature platforms monetize ads at ~3%–5% of GMV with near‑pure margin. We treat that as upside and do not include it in the base case.
As per the assumptions below, 3P GMV rises from $39 bn to $71.4 bn, a 16% CAGR.
Layering these 3P assumptions on 1P volume/price (with lower AOV as SHEIN expands in EM ex‑US/EU), we get the following at the group level.
Revenue rises from $45.8 bn in 2026 to $60.6 bn in 2030 (CAGR ~7.7%). Profit is under pressure in 2026–27 from EU duties and compliance costs, then recovers as 3P mix lifts margins (to 19% of revenue from 11%) and local warehousing dilutes fulfillment. OPM climbs from a 2.4% trough to 5.5% by 2030, with net profit growing from $1.7 bn to $3.8 bn (CAGR ~22%).
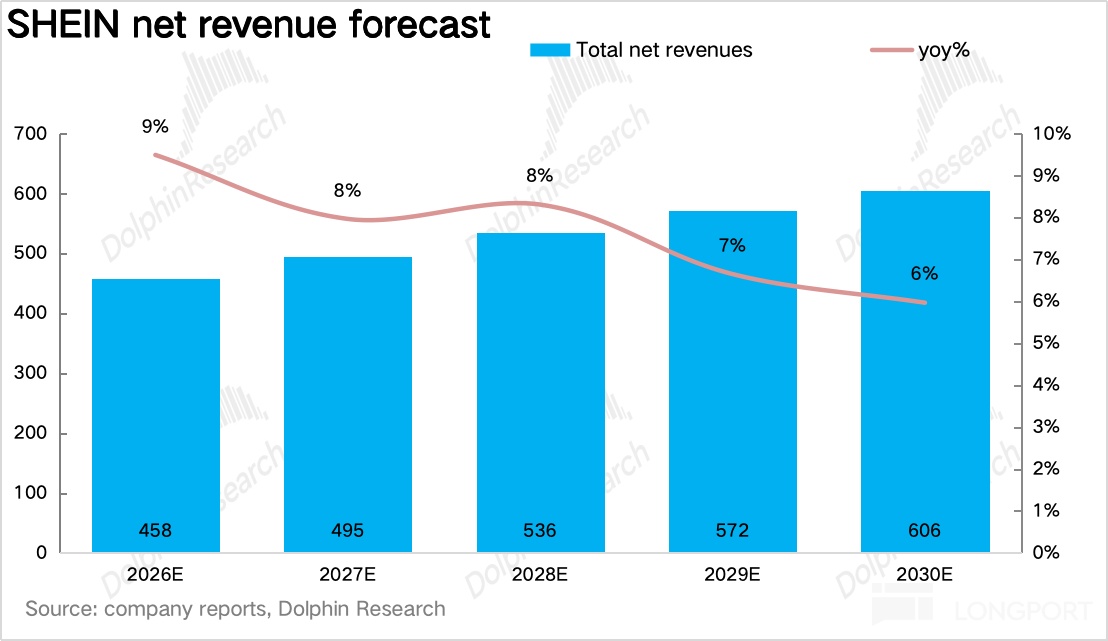
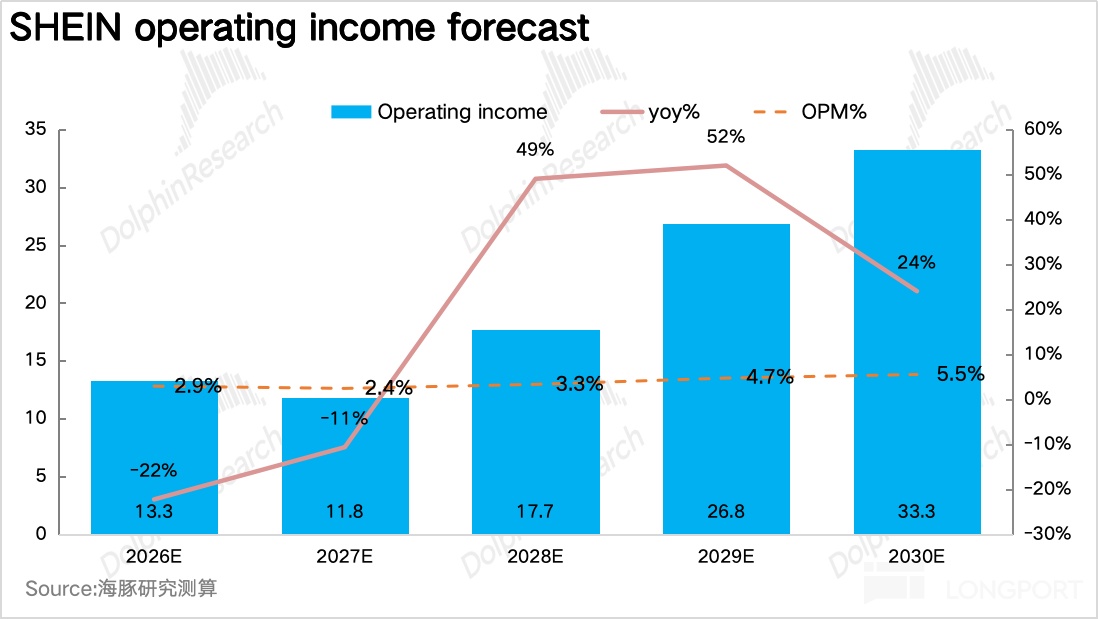
For valuation, we avoid trough PE on 2026–27 when EU duties and compliance weigh profits at ~$1.7 bn. Assume 2028 as the first ‘clean year’ after EU effects, with 3P mix lift and local FCF benefits, implying ~$2.25 bn net profit. We estimate 2028–30 net profit CAGR at ~30% and, factoring a China ADR/HK discount, assign 20x. That yields ~$45 bn target market cap in 2028; discounted back at 12.6% WACC to 2026 implies ~$35.5 bn fair value, or ~HKD 64/share — ~30% upside vs. the ~$27 bn IPO pricing range (HKD 47.6–49.5).
In other words, even without platform multiple premium and only earning from profit normalization plus time value, the IPO leaves 30%+ expected upside over 18–24 months.
On float, the offering is 280 mn shares, ~6.4% of post-IPO shares. After deducting locked cornerstone allocations (Boyu, Tencent, Tiger, etc. typically lock for six months) and locked legacy stakes, the free float on day one — mainly retail in the public tranche and unlocked institutional allocs — is ~4.8%–5.1% of total shares.
A tiny float, a scarce HK proxy for a global e‑com leader, and a discounted IPO tilt the order book toward buyers. A first-day pop is likely.
The real allocation should target the medium-term earnings trough. Looking ahead, late 2026–2027 is a known headwind window: EU ends €150 de minimis in Jul, with full-year impact in 2027, implying two years of net profit declines. That ‘darkest hour’ is the entry window for long-term capital.
Tactically, if EU tariff impact overshoots and panic drives the stock below 12x 2028E (i.e., ~$27 bn market cap, sub‑HKD 48), start building positions in tranches. Further downside would require both 3P thesis failure and permanently worse tariffs — a low-probability combo, in our view.
<End>
Risk disclosure and disclaimer:Dolphin Research Disclaimer and General Disclosure



The copyright of this article belongs to the original author/organization.
The views expressed herein are solely those of the author and do not reflect the stance of the platform. The content is intended for investment reference purposes only and shall not be considered as investment advice. Please contact us if you have any questions or suggestions regarding the content services provided by the platform.