Balance Sheet Analysis: Reading Company Financials
Discover how to read balance sheets like a professional investor. This comprehensive guide breaks down assets, liabilities, and equity to help you evaluate company financial health.
TL;DR: A balance sheet is a financial snapshot showing what a company owns (assets), owes (liabilities), and its net worth (equity) at a specific point in time. Learning to read balance sheets helps investors evaluate company financial health, liquidity, and solvency before making investment decisions.
When you consider investing in a company, understanding its financial health is essential. While stock prices and earnings reports grab headlines, the balance sheet provides the foundation for evaluating whether a company stands on solid ground or shaky footing. For investors trading across Singapore, US, and Hong Kong markets, mastering balance sheet analysis is a fundamental skill that informs smarter investment decisions.
This guide breaks down the components of a balance sheet, explains how to interpret key metrics, and shows you how to use this financial statement to assess company stability and growth potential.
What Is a Balance Sheet?
A balance sheet is one of the three primary financial statements companies prepare, alongside the income statement and cash flow statement. It presents a snapshot of a company's financial position at a specific date—typically the end of a fiscal quarter or year.
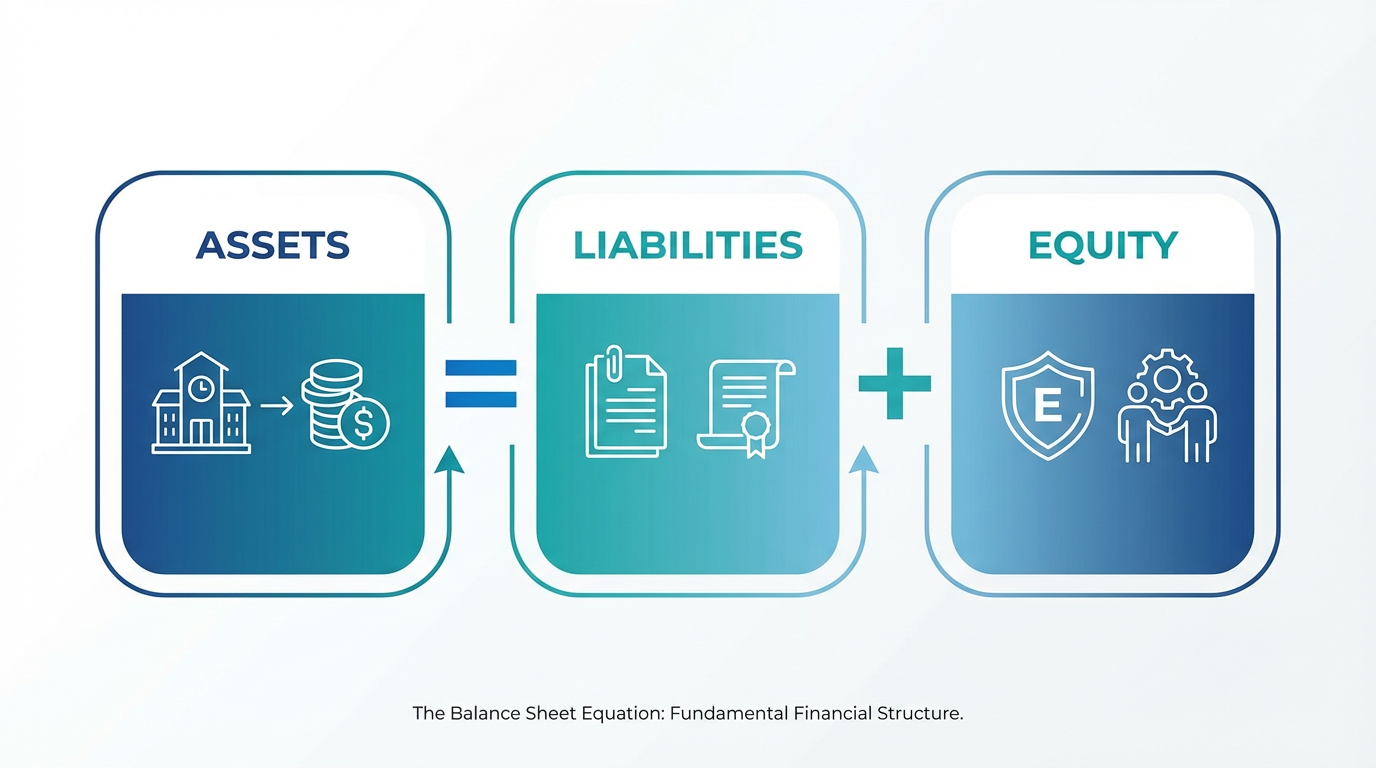
The name "balance sheet" comes from the fundamental accounting equation that must always balance:
Assets = Liabilities + Equity
This equation means that everything a company owns (assets) is financed either by borrowing money (liabilities) or by shareholder investments and retained earnings (equity). Think of it like your personal finances: if you own a home worth SGD 500,000 but have a mortgage of SGD 300,000, your equity in that home is SGD 200,000.
Unlike an income statement that shows performance over a period, the balance sheet provides a single moment in time—like taking a photograph of the company's financial position on December 31st. This temporal specificity matters because balance sheet items can fluctuate significantly throughout the year, especially for seasonal businesses.
Understanding the Balance Sheet Equation
Assets: What the Company Owns
Assets represent resources the company controls that have economic value, classified into two categories:
Current Assets (convertible to cash within one year):
-
Cash and cash equivalents
-
Marketable securities
-
Accounts receivable
-
Inventory
Non-Current Assets (providing value beyond one year):
-
Property, plant, and equipment (PP&E, that is Property, Plant, and Equipment)
-
Intangible assets like patents and goodwill
-
Long-term investments
Asset quality matters—cash holds more value than uncollected receivables, while stagnant inventory ties up capital.
Liabilities: What the Company Owes
Liabilities are obligations the company must settle, divided by timing:
Current Liabilities (due within one year):
-
Accounts payable
-
Short-term debt
-
Accrued expenses
Non-Current Liabilities (beyond one year):
-
Long-term debt
-
Pension obligations
-
Lease obligations
Companies with primarily long-term debt have more flexibility than those facing immediate obligations, though excessive debt burdens future profitability.
Equity: The Owners' Stake
Equity represents the residual interest after deducting liabilities, including share capital, retained earnings, and additional paid-in capital. Retained earnings reveal whether the company has been profitable and how management allocates profits.
Key Balance Sheet Metrics
Working Capital
Working capital (current assets minus current liabilities) measures short-term financial health. While positive working capital indicates ability to cover immediate obligations, context matters—some business models operate efficiently with negative working capital. For companies trading across diverse investment products including stocks, REITs, and ETFs, comparing ratios within industries provides meaningful insights.
Debt Analysis
The debt-to-equity ratio reveals how heavily companies rely on borrowed money. High ratios mean significant leverage, amplifying both gains and losses. While excessive debt increases risk during downturns, moderate debt enables growth without diluting ownership.
Asset Composition
Asset mix reveals business strategy. Technology companies hold more intangible assets like intellectual property, while manufacturers require substantial physical equipment. Watch for aggressive depreciation policies that can artificially inflate short-term profits.
How to Read a Balance Sheet
Follow this systematic approach when analyzing balance sheets:
Step 1: Verify Basics - Check the reporting date and currency (SGD, USD, or HKD for international stocks).
Step 2: Review Assets - Calculate cash as a percentage of total assets. Strong cash positions provide flexibility. Watch for receivables or inventory growing faster than sales.
Step 3: Assess Liabilities - Compare current to non-current liabilities. High current liabilities relative to current assets signal potential liquidity issues.
Step 4: Examine Equity - Growing retained earnings demonstrate sustained profitability. Declining equity with rising debt indicates financial stress.
Essential Financial Ratios
Current Ratio = Current Assets ÷ Current Liabilities
Measures liquidity. Above 1.0 indicates ability to cover short-term obligations.
Quick Ratio = (Current Assets - Inventory) ÷ Current Liabilities
More conservative liquidity measure excluding inventory.
Debt-to-Equity Ratio = Total Liabilities ÷ Shareholders' Equity
Reveals financial leverage. Compare to industry peers for context.
Return on Equity (ROE) = Net Income ÷ Shareholders' Equity
Shows how effectively the company generates profits from shareholder investments.
Using Balance Sheets for Investment Decisions

Evaluating Financial Strength
Companies with strong balance sheets weather economic downturns better. During the 2008 financial crisis and 2020 pandemic, firms with substantial cash reserves and manageable debt survived while heavily indebted competitors faced bankruptcy. Assess whether companies maintain adequate liquidity—essential for dividend-focused investors, as dividend payments require sufficient cash and stable finances.
Spotting Red Flags
Warning signs from balance sheet analysis include:
-
Declining cash with increasing debt
-
Receivables growing faster than revenue
-
Rising inventory relative to sales
-
Frequent asset write-downs
-
High intangible assets relative to tangible assets
These indicators warrant deeper investigation before committing capital.
Comparing Companies
Balance sheet analysis becomes most powerful when comparing similar companies. Calculate the same ratios for competitors to identify superior financial positions. When evaluating Singapore REITs (that is, Real Estate Investment Trusts), compare debt-to-equity ratios since real estate companies typically carry substantial debt.
Where to Find Balance Sheets
Public companies file financial statements regularly with regulators:
Singapore-listed companies: Singapore Exchange (SGX, that is the Singapore Exchange) provides annual reports with audited statements and quarterly reports.
US-listed companies: Securities and Exchange Commission (SEC, that is the Securities and Exchange Commission) maintains the EDGAR (that is the Electronic Data Gathering, Analysis, and Retrieval) database with Form 10-K (annual) and Form 10-Q (quarterly) reports.
Hong Kong-listed companies: Hong Kong Stock Exchange (HKEX, that is the Hong Kong Stock Exchange) provides company announcements and financial reports.
You can also track real-time financial data through comprehensive platforms that aggregate financial statements for efficient comparison.
Important Considerations
Accounting Variability
Companies have discretion in accounting treatments. Different depreciation methods, inventory valuation, and revenue recognition policies significantly impact figures. International Financial Reporting Standards (IFRS, that is International Financial Reporting Standards) and Generally Accepted Accounting Principles (GAAP, that is Generally Accepted Accounting Principles) allow flexibility, meaning identical companies might report different figures based on accounting choices.
Historical Cost Limitations
Balance sheets report assets at historical cost, not current market value. Land purchased decades ago appears at original price, potentially understating true worth.
Read the Complete Picture
Balance sheets tell only part of the story. Always review alongside income statements (profitability) and cash flow statements (cash generation). Read footnotes for details on accounting policies, contingencies, and off-balance-sheet arrangements.
Frequently Asked Questions
What is the difference between a balance sheet and an income statement?
A balance sheet shows a company's financial position at a specific point in time, listing assets, liabilities, and equity. An income statement shows financial performance over a period, reporting revenue, expenses, and profit or loss. Think of the balance sheet as a snapshot and the income statement as a video recording of financial activity.
How often should I review a company's balance sheet?
For active investors, review balance sheets quarterly when companies release earnings reports. For long-term investors, annual reviews may suffice unless significant events (acquisitions, restructurings, economic shocks) warrant more frequent examination. Regular monitoring helps you spot developing trends before they become serious problems.
What is a good current ratio?
A current ratio between 1.5 and 3.0 generally indicates healthy liquidity for most industries. Below 1.0 suggests potential liquidity challenges, while above 3.0 might indicate inefficient use of assets. However, appropriate ratios vary significantly by industry—compare companies within the same sector for meaningful benchmarks.
Can a company have negative equity?
Yes, though it signals financial distress. Negative equity (liabilities exceeding assets) typically results from sustained losses that deplete retained earnings. While not an immediate bankruptcy signal, negative equity indicates the company is technically insolvent on a balance sheet basis and faces heightened financial risk.
Conclusion
Balance sheet analysis forms the foundation of fundamental investment research. By understanding what a company owns, what it owes, and what belongs to shareholders, you gain essential insights into financial stability, growth capacity, and risk exposure.
Start by mastering the basic equation—assets equal liabilities plus equity—then progress to analyzing key ratios, comparing competitors, and identifying warning signs. Remember that the balance sheet works best when reviewed alongside income statements and cash flow statements, providing a complete picture of company financial health.
As you develop your investment skills, consistent practice with real company balance sheets sharpens your analytical abilities. Whether you invest in Singapore, US, or Hong Kong markets, these fundamental principles remain constant across borders and industries.
Ready to put your balance sheet knowledge into practice? Explore the Longbridge app to access financial data for stocks across multiple markets, or learn more through our educational resources designed for Singapore investors.