Income Statement Guide: Understanding Profit and Loss
Master income statement analysis with this comprehensive guide covering key components, analysis techniques, and practical tips for Singapore investors.
TL;DR: An income statement (also called a profit and loss statement or P&L) is a financial report showing a company's revenues, expenses, and net profit or loss over a specific period. It helps investors, business owners, and stakeholders assess financial performance and make informed decisions about profitability and growth.
Whether you are a seasoned investor or just starting your trading journey, understanding financial statements is crucial for making sound investment decisions. The income statement stands as one of the most important financial documents you will encounter when evaluating stocks, assessing business health, or managing your own investment portfolio.
This comprehensive guide will walk you through everything you need to know about income statements—from basic definitions to practical analysis techniques—so you can confidently interpret these essential financial reports and make better-informed investment choices.
What is an Income Statement?
An income statement, also known as a profit and loss statement (P&L) or statement of operations, is a financial report that summarizes a company's revenues, expenses, and profits or losses during a specific accounting period. This period could be a quarter (three months), a fiscal year, or any other designated timeframe.
The income statement is an essential financial document that details the company's income and expenses over a specific period and communicates a wealth of information to those reading it—from key executives and stakeholders to investors and employees.
Unlike the balance sheet, which provides a snapshot of financial position at a single point in time, the income statement shows financial performance over a period. This makes it particularly valuable for tracking business trends, comparing performance across different periods, and identifying areas of strength or concern.
Why Income Statements Matter for Investors
Income statements provide critical insights into a company's ability to generate profit for investors. When you are evaluating whether to buy Singapore stocks, United States (US) equities, or Exchange-Traded Funds (ETFs), the income statement helps you:
Assess profitability trends over time
Compare performance against competitors
Identify potential red flags or growth opportunities
Make data-driven investment decisions
Understand how efficiently a company converts revenue into profit
Key Components of an Income Statement
Understanding the structure of an income statement is essential for proper analysis. While formats may vary slightly between companies and industries, most income statements follow a standard structure with these core components.
Revenue (The Top Line)
Revenue represents the total money a company earns from its primary business activities before any expenses are deducted. This "top line" figure includes product sales, service fees, subscription income, and licensing revenue. For example, a technology company's revenue might come from software subscriptions, hardware sales, and cloud services.
Cost of Goods Sold (COGS)
Cost of Goods Sold (COGS) represents the direct costs associated with producing or delivering goods and services. This includes raw materials, direct labour, manufacturing overhead, and logistics. COGS varies significantly across industries—manufacturing companies have higher COGS than software companies.
Gross Profit
Gross profit is calculated by subtracting COGS from revenue:
Gross Profit = Revenue - COGS
This metric shows how efficiently a company produces its goods or services before accounting for operating expenses. The gross profit margin (gross profit divided by revenue) helps investors compare profitability across companies of different sizes.
Operating Expenses
Operating expenses are the costs required to run the business that are not directly tied to production. These typically include:
Selling, general, and administrative expenses (SG&A)
Marketing and advertising costs
Research and development (R&D)
Rent and utilities
Salaries for non-production staff
When evaluating stocks, pay attention to how operating expenses trend relative to revenue growth. Rising expenses that outpace revenue growth can signal efficiency problems.
Operating Income
Operating income (also called operating profit or Earnings Before Interest and Taxes, or EBIT) is calculated as:
Operating Income = Gross Profit - Operating Expenses
This figure represents profit from core business operations, excluding financing costs and taxes. It is a key indicator of operational efficiency and business performance.
Other Income and Expenses
This section includes financial activities outside core operations:
Interest expense (cost of debt)
Interest income (earnings from investments)
Gains or losses from asset sales
Foreign exchange gains or losses
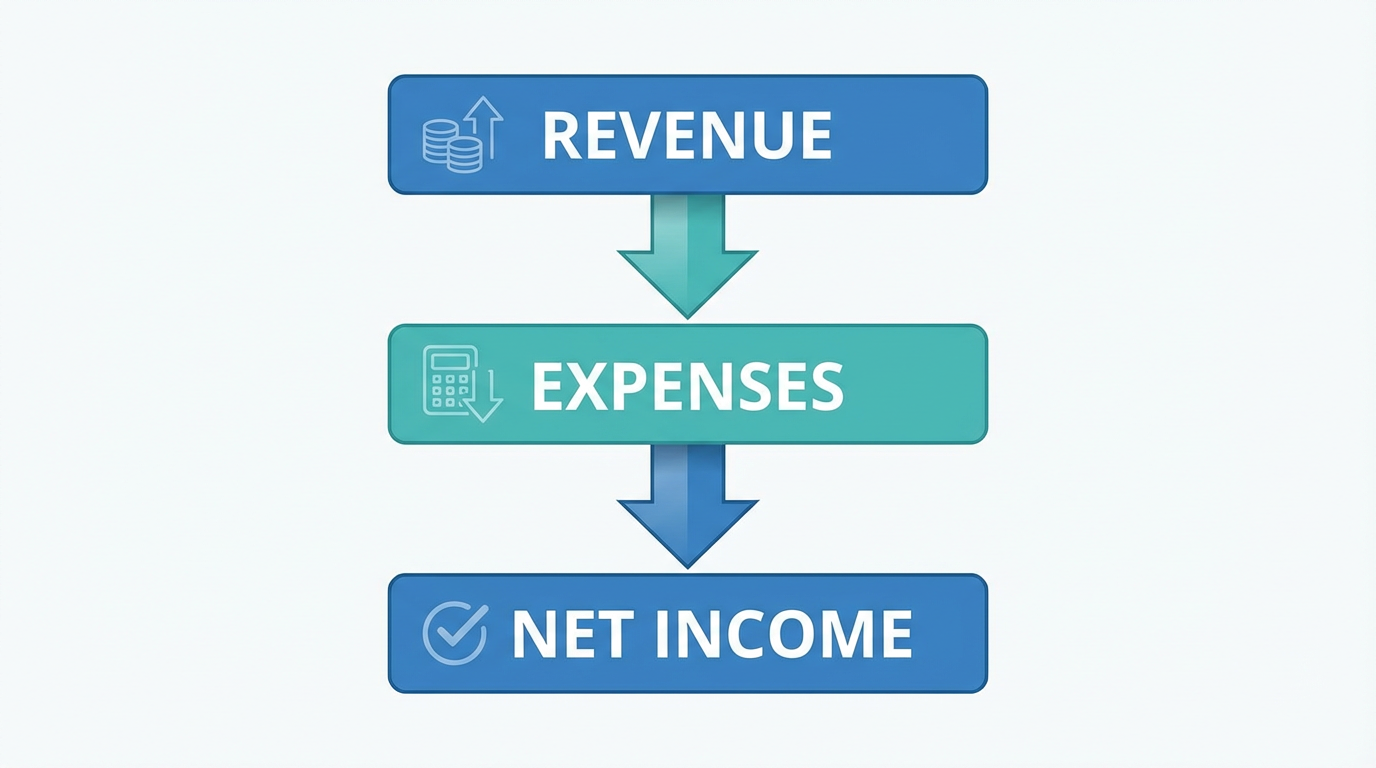
Net Income (The Bottom Line)
Net income, often called "the bottom line," represents the company's total profit or loss after all revenues, expenses, interest, and taxes have been accounted for:
Net Income = Operating Income + Other Income - Other Expenses - Taxes
This is the figure that directly impacts shareholder value and is widely used to calculate key metrics like earnings per share (EPS). When you are researching stocks, net income trends over multiple quarters provide valuable insight into long-term profitability.
How to Read and Analyse an Income Statement
Reading an income statement goes beyond simply locating the net income figure. Effective analysis requires understanding the relationships between different line items and identifying meaningful trends.

Vertical Analysis
Vertical analysis expresses each line item as a percentage of revenue, allowing you to compare companies of different sizes and identify expense patterns. For example, if COGS rises from 60 per cent to 65 per cent of revenue, this signals decreasing gross margins.
Horizontal Analysis
Horizontal analysis compares financial data across multiple periods to identify trends. This method helps investors understand whether a company is growing or declining. Look for consistent revenue growth, expense trends relative to revenue, and margin improvements or deterioration.
Key Ratios and Metrics
Several important ratios derived from the income statement help investors evaluate performance:
Gross Profit Margin: (Gross Profit ÷ Revenue) × 100
This shows what percentage of revenue remains after direct production costs. Higher margins indicate pricing power and production efficiency.
Operating Profit Margin: (Operating Income ÷ Revenue) × 100
This reveals how much profit the company generates from operations before financing costs and taxes.
Net Profit Margin: (Net Income ÷ Revenue) × 100
This shows the overall profitability after all expenses. Comparing net margins across competitors helps identify industry leaders.
Common Income Statement Red Flags
When evaluating potential investments, watch for these warning signs:
Declining Revenue
Consistent revenue decline over multiple quarters may indicate competitive pressures or operational problems. Sustained downward trends deserve careful scrutiny.
Margin Compression
If gross or operating margins are shrinking while competitors maintain stable margins, this could signal pricing pressure or operational inefficiencies.
Unsustainable Expense Growth
Operating expenses growing faster than revenue is unsustainable long-term. Companies must align expense growth with revenue growth to maintain profitability.
Unusual One-Time Items
Large gains from asset sales can inflate net income temporarily. Focus on sustainable operating income rather than one-time windfalls.
Income Statement vs Other Financial Statements
The income statement shows profitability over a period, while the balance sheet shows financial position at a specific point, and the cash flow statement tracks actual cash movements. All three work together to provide a complete financial picture.
Practical Tips for Singapore Investors
Compare Within Industries
Financial metrics vary significantly across sectors. Compare a Singapore Real Estate Investment Trust (REIT) only with other REITs, not with technology companies.
Review Multiple Periods
Analyse at least three to five quarters of income statements to identify genuine trends. Longbridge's research articles provide historical context for many listed companies.
Read the Notes
Financial statement footnotes contain crucial details about accounting policies, one-time charges, and segment performance that raw numbers alone cannot convey.
Stay Updated
Use Longbridge's news services to stay informed about earnings releases and material developments that might impact future income statements.
Frequently Asked Questions
What is the difference between an income statement and a profit and loss statement?
There is no technical difference. They are two names for the same financial report. "Income statement" is commonly used in formal corporate reporting, while "profit and loss statement" is frequently used in small business contexts.
How often are income statements prepared?
Public companies typically prepare income statements quarterly and annually. Quarterly statements are released as part of earnings reports, while annual statements provide a complete fiscal year overview.
What is a good net profit margin?
A "good" net profit margin varies by industry. Software companies might achieve 20 to 30 per cent margins, while grocery retailers might operate on 2 to 3 per cent. Compare against industry peers rather than universal standards.
Can a company have positive net income but negative cash flow?
Yes. Accounting rules recognise revenue when earned, not when cash is received. A company might record sales but not collect payment for months. Non-cash expenses like depreciation also reduce net income without affecting cash.
Where can I find income statements for companies I want to invest in?
For Singapore-listed companies, income statements are available through Singapore Exchange (SGX) announcements. For US and Hong Kong stocks, companies file with regulatory authorities. Longbridge's platform provides access to financial data across multiple markets.
Conclusion
Understanding income statements is a fundamental skill for anyone serious about investing in stocks, ETFs, or other securities. This financial document provides transparent insight into a company's ability to generate revenue, manage expenses, and deliver profit to shareholders.
By learning to read and analyse income statements effectively, you gain the ability to identify strong investment opportunities, avoid potential pitfalls, and make decisions based on financial reality rather than speculation. Whether you are evaluating Singapore stocks, US stocks, or Hong Kong equities, the income statement serves as your window into business performance. You can learn more about investment strategies through the Longbridge Academy or by downloading the Longbridge App.