ETF Expense Ratios: Comparing Costs Across Markets
Understand how ETF expense ratios vary across market segments and learn practical strategies for comparing fund costs to help manage your investment expenses.
TL;DR: An Exchange-Traded Fund (ETF) expense ratio is the annual fee you pay to own a fund, expressed as a percentage of your investment. Comparing expense ratios across ETF categories helps you identify cost-efficient funds, as even small fee differences compound significantly over time and directly reduce your returns.
When building an investment portfolio, the fees you pay matter just as much as the returns you earn. Every dollar spent on fund expenses is a dollar that cannot compound in your favour. For ETF investors, understanding how to conduct an ETF expense ratio comparison across different market categories is essential for making informed decisions that align with your financial goals.
This guide breaks down what expense ratios are, how they vary across ETF types, and practical strategies for evaluating costs when selecting funds for your portfolio.
What Is an ETF Expense Ratio?
An ETF expense ratio represents the annual cost of owning a fund, expressed as a percentage of your total investment. This fee covers the fund's operating expenses, including management fees, administrative costs, legal fees, and auditing services.
How Expense Ratios Work
The expense ratio is not billed to you directly. Instead, the fund deducts it from its assets on a daily basis, which reduces the fund's Net Asset Value (NAV) and, consequently, your returns.
For example, if you invest USD 10,000 in an ETF with a 0.10% expense ratio, you pay USD 10 annually. If the same ETF had a 0.50% expense ratio, you would pay USD 50 per year for the same exposure. (This example is for illustration purposes only and does not constitute investment advice.)
Components of an Expense Ratio
Management fees typically constitute the largest portion of an ETF's expense ratio. These fees compensate portfolio managers for their day-to-day decision-making and fund oversight.
Administrative costs cover operational aspects such as investor relations, record keeping, regulatory compliance, and accounting services. While often smaller than management fees, these costs vary based on fund complexity and size.
Typical Expense Ratio Ranges by ETF Category
Understanding what constitutes a reasonable expense ratio requires context. Different ETF categories carry different cost structures based on their complexity, management style, and underlying assets.
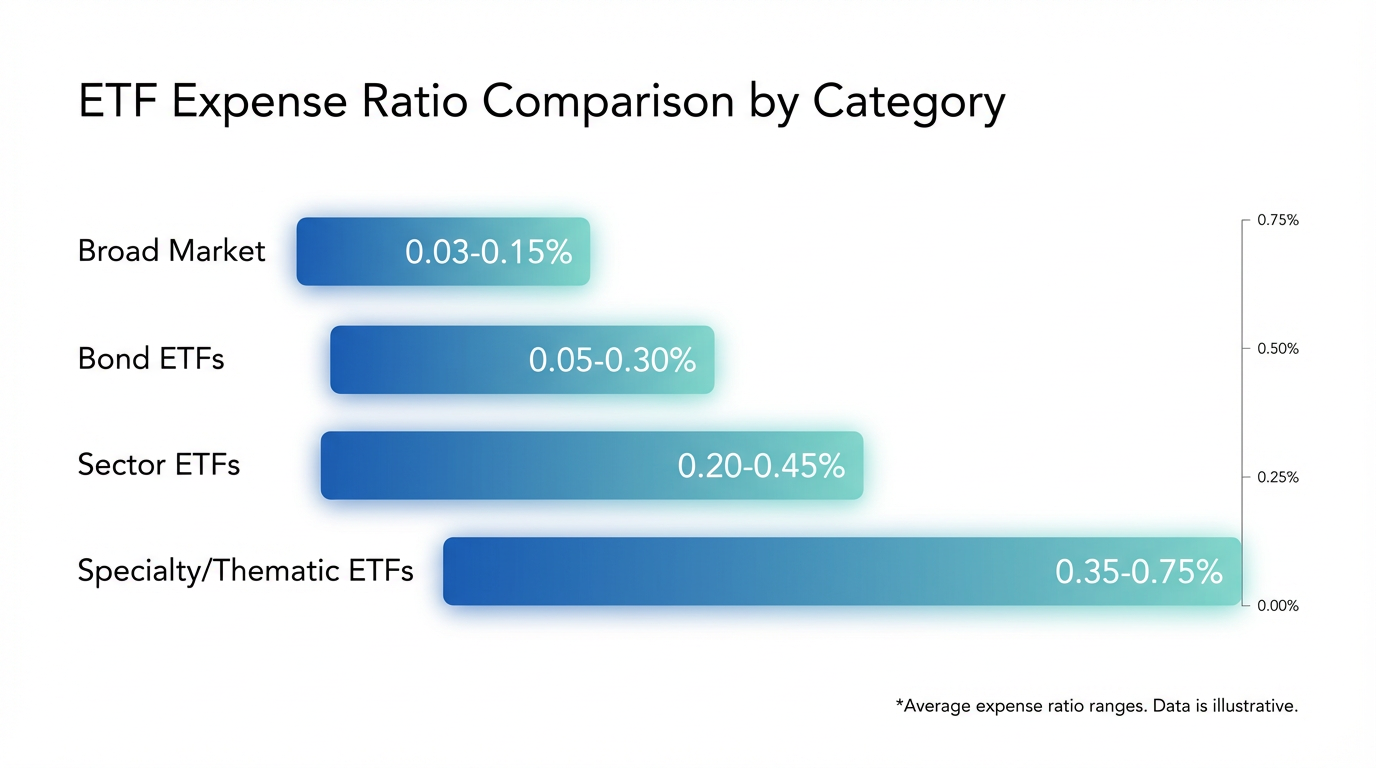
Broad Market Index ETFs
Broad market equity ETFs that track major indices typically have expense ratios between 0.03% and 0.15%. These funds benefit from economies of scale, straightforward replication strategies, and intense competition among providers. A plain-vanilla S&P 500 tracker can sit at 0.03%, making these highly cost-efficient investment vehicles.
Sector and Thematic ETFs
Sector-specific and thematic ETFs usually charge between 0.20% and 0.45%. The higher costs reflect more specialized research requirements, smaller fund sizes, and less direct competition. Funds focused on emerging technologies, Environmental, Social, and Governance (ESG) criteria, or niche market segments often fall into this range.
Bond ETFs
Bond ETFs typically range from 0.05% to 0.30%, with government bond funds on the lower end and corporate or high-yield bond funds toward the higher end. The variation reflects differences in portfolio complexity and credit research requirements.
Active and Specialty ETFs
Actively managed ETFs and specialty products such as leveraged or inverse ETFs often have expense ratios between 0.50% and 1.00% or higher. These funds require more intensive management, frequent trading, and complex replication mechanics that drive up operating costs.
Active Versus Passive ETF Costs
One of the most significant factors affecting expense ratios is whether a fund employs active or passive management.
Passive Index Tracking
Passively managed ETFs aim to replicate the performance of a specific market index. Because they follow predetermined rules rather than making discretionary investment decisions, they require less research and trading activity. According to Morningstar data, the average expense ratio for index equity ETFs was approximately 0.40% in 2024, continuing a multi-year declining trend.
Active Management Premium
Actively managed ETFs employ portfolio managers who attempt to outperform their benchmarks through security selection and market timing. This approach requires additional research staff, more frequent trading, and greater operational oversight. The average expense ratio for actively managed ETFs was approximately 0.69% in 2024, according to Morningstar.
The key question for investors is whether the potential for outperformance justifies the additional cost. According to the S&P SPIVA scorecards, a majority of actively managed funds have historically underperformed their benchmarks over longer time periods, making the fee differential particularly important.
The Long-Term Impact of Expense Ratios
Small differences in expense ratios may seem insignificant in any single year. However, because fees reduce the amount of capital available for compounding, their impact grows substantially over time.

A Practical Example
Consider investing USD 10,000 in an ETF with an assumed 6% gross annual return before fees and holding it for five years.
With a 0.10% expense ratio, your net annual return is approximately 5.90%, leaving you with roughly USD 13,400 after five years.
With a 0.50% expense ratio, your net annual return drops to approximately 5.50%, resulting in roughly USD 12,800. That USD 600 difference represents the pure fee impact over just five years. (This example is for illustration purposes only and does not constitute investment advice.)
Scaling the Impact
On a USD 100,000 portfolio over 30 years with 7% annual growth, the difference between a 0.10% and 1.00% expense ratio can reduce your final portfolio value by over USD 170,000 (based on hypothetical calculations). This figure represents not just fees paid, but the total opportunity cost of lost compound growth. (This example is for illustration purposes only and does not constitute investment advice.)
Tip: When comparing ETFs, always calculate the absolute dollar cost of the expense ratio based on your expected investment amount and holding period, not just the percentage difference.
Total Cost of Ownership Beyond Expense Ratios
While the expense ratio is crucial, it represents only one component of what you actually pay to own an ETF.
Trading Costs
The bid-ask spread represents the difference between what buyers pay and sellers receive when trading ETF shares. For heavily traded ETFs, this spread may be just a few cents per share. For less liquid funds, the spread can be significantly wider, adding meaningful costs for investors who trade frequently.
Tracking Difference
For index ETFs, tracking difference measures how closely a fund follows its benchmark index. A fund with a low expense ratio but poor tracking may actually deliver worse net returns than a slightly more expensive fund with tighter tracking.
Tax Efficiency
ETFs are generally more tax-efficient than mutual funds due to their unique creation and redemption mechanism. However, tax efficiency varies among ETFs, and investors should consider potential capital gains distributions when evaluating total cost.
How to Compare ETF Expense Ratios Effectively
Conducting a meaningful ETF expense ratio comparison requires a systematic approach that accounts for multiple factors.
Compare Within Categories
Always compare expense ratios among funds that track similar indices or pursue similar strategies. Comparing a broad market index ETF to an actively managed sector fund provides no useful insight. Use ETF screeners that allow filtering by category, asset class, and investment objective.
Evaluate the Full Picture
Consider expense ratio alongside historical performance, tracking error, fund size, and liquidity. A slightly higher expense ratio may be justified if a fund offers better tracking, higher liquidity, or exposure to a unique market segment that aligns with your investment objectives.
Check for Fee Trends
Many ETF providers have reduced fees over time in response to competition. When evaluating funds, check whether the expense ratio has changed recently and whether the provider has a history of fee reductions.
Practical Steps for Comparing ETF Costs
Building a cost-conscious ETF portfolio requires attention to detail and the right tools.
Use Screening Tools
ETF screeners allow you to filter funds by expense ratio, asset class, and other criteria. These tools enable side-by-side comparisons of funds with similar objectives. Platforms like Longbridge provide access to a stock screener that can help you identify and compare investment options across markets.
Document Your Criteria
Before selecting ETFs, establish clear criteria for acceptable expense ratios based on the fund category. Some investors may use thresholds such as 0.20% for broad market index funds or 0.75% for specialty and actively managed funds as starting points for evaluation.
Review Periodically
Expense ratios change over time, and new lower-cost alternatives regularly enter the market. Review your holdings periodically to ensure you are not paying more than necessary for similar exposure.
Frequently Asked Questions
What is considered a good expense ratio for an ETF?
For broad market index ETFs, expense ratios below 0.20% are generally considered good, with many large index funds charging between 0.03% and 0.10%. For actively managed or specialty ETFs, ratios below 0.75% are reasonable, though this depends on the specific strategy and market segment.
How do ETF expense ratios compare to mutual fund fees?
ETFs typically have lower expense ratios than comparable mutual funds. According to Morningstar data, the average expense ratio for index ETFs is approximately 0.40% compared to 0.60% for index mutual funds. This difference reflects the operational efficiencies inherent in the ETF structure.
Do expense ratios affect ETF performance directly?
Yes. The expense ratio is deducted from fund assets daily, which directly reduces the fund's NAV and your investment returns. Two funds tracking the same index will have performance differences approximately equal to their expense ratio differential over time.
Should I always choose the ETF with the lowest expense ratio?
Not necessarily. While lower costs are generally preferable, you should also consider tracking accuracy, liquidity, fund size, and whether the ETF provides the specific exposure you need. A slightly higher expense ratio may be acceptable for a fund with better tracking or unique market access.
Conclusion
Understanding how to compare ETF expense ratios is fundamental to building a cost-efficient investment portfolio. By recognizing typical fee ranges across different ETF categories, calculating the long-term impact of costs, and evaluating total cost of ownership beyond the expense ratio alone, you can make more informed decisions that preserve more of your returns over time.
The choice of financial instruments depends on your investment objectives, risk tolerance, market outlook, and experience level. Regardless of the method selected, it is essential to fully understand its mechanics, risk characteristics, and execution rules, while maintaining a robust risk management plan. You can learn more about investment strategies through the Longbridge Academy or by downloading the Longbridge App.