P/E Ratio Explained: Valuation Metric for Investors
The P/E ratio compares stock price to earnings per share, helping investors assess valuation. Learn how to calculate, interpret, and use this essential metric effectively.
TL;DR: The Price-to-Earnings ratio (P/E ratio) compares a company's stock price to its earnings per share, helping investors assess whether a stock is fairly valued. While useful for comparing companies within the same industry, the P/E ratio works best when combined with other financial metrics and context about growth expectations, industry norms, and market conditions.
Understanding valuation metrics is essential for making informed investment decisions. The Price-to-Earnings ratio stands as one of the most widely used tools in an investor's toolkit, offering a quick snapshot of how the market values a company's earnings.
This guide breaks down what the P/E ratio means, how to calculate and interpret it, and how to use it effectively in your investment research. This guide explains how investors interpret the metric and common considerations when using it.
What is the P/E Ratio?
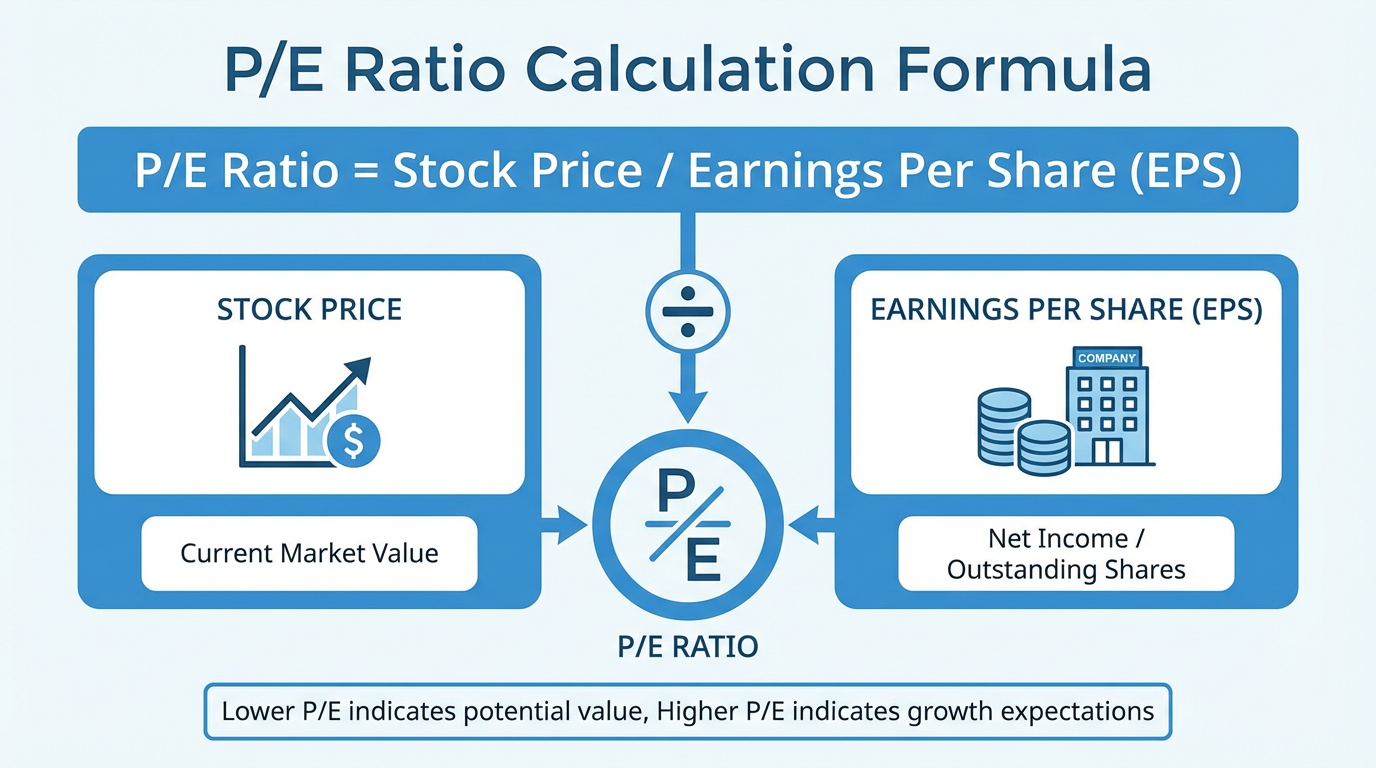
The Price-to-Earnings ratio, commonly known as the P/E ratio, measures the relationship between a company's current stock price and its earnings per share (EPS). This metric tells you how much investors are willing to pay for each dollar of a company's earnings.
Think of it this way: if a stock trades at $100 per share and the company earned $5 per share over the past year, the P/E ratio would be 20. This means investors are paying 20 times the company's annual earnings to own the stock.
The formula is straightforward:
P/E Ratio = Current Stock Price ÷ Earnings Per Share
This simple calculation provides valuable context about market sentiment and valuation levels. A company with strong growth prospects typically commands a higher P/E ratio, as investors anticipate future earnings increases that will justify today's premium price.
Types of P/E Ratios: Trailing vs. Forward
Not all P/E ratios are calculated the same way. Understanding the difference between trailing and forward P/E ratios helps you choose the right metric for your analysis.
Trailing P/E Ratio
The trailing P/E ratio uses actual earnings from the previous 12 months. This backward-looking measure provides a concrete snapshot based on verified financial data. You'll often see this labeled as "TTM" (trailing twelve months) in financial reports.
The advantage of trailing P/E lies in its factual foundation—no estimates or projections involved. However, past performance doesn't always predict future results, especially for companies experiencing rapid change or operating in volatile industries.
Forward P/E Ratio
The forward P/E ratio relies on analysts' earnings estimates for the next 12 months. This forward-looking approach attempts to capture growth expectations and anticipated changes in profitability.
While forward P/E ratios can better reflect a company's trajectory, they depend on the accuracy of analyst projections. These estimates can prove overly optimistic or pessimistic, particularly during periods of economic uncertainty or significant business transitions.
Trailing P/E ratios work well for stable companies with predictable earnings, while forward P/E ratios suit growth companies or businesses undergoing transformation. Many investors review both for a complete picture.
How to Calculate the P/E Ratio
Calculating a P/E ratio requires just two pieces of information: the current stock price and the earnings per share.
The current stock price is readily available on financial market platforms and updates throughout trading hours. Earnings per share represents a company's net income divided by outstanding shares, found in quarterly and annual reports.
Example: Stock A trades at $150 per share with earnings of $7.50 per share:
P/E Ratio = $150 ÷ $7.50 = 20
This means investors are paying 20 times Stock A's annual earnings for each share.
Interpreting P/E Ratios: High vs. Low
Understanding P/E ratios requires context and comparison rather than absolute judgments.
What a High P/E Ratio Suggests
A higher P/E ratio relative to industry peers often indicates investors expect strong earnings growth ahead. Growth companies in technology or biotechnology frequently trade at elevated P/E ratios as markets anticipate expanding margins and market share.
However, high P/E ratios can also signal overvaluation. If earnings don't materialize as expected, stocks trading at premium valuations face significant downside risk.
What a Low P/E Ratio Suggests
Lower P/E ratios might indicate undervaluation—attractive for value investors. Alternatively, a low ratio could reflect genuine concerns about future prospects or industry headwinds. Mature companies in stable industries typically maintain lower P/E ratios than high-growth firms.
Industry Context Matters
A P/E ratio of 30 might be reasonable for a rapidly scaling software company but excessive for an established utility provider. It is generally more meaningful to compare a company's P/E ratio against its industry peers rather than applying universal standards. For example, technology companies often trade at P/E ratios above 25, while financial services firms might average between 10 and 15.

Using P/E Ratios for Investment Decisions
The P/E ratio is often used strategically as part of comprehensive investment research.
Compare Within Industries
Benchmark a company's P/E ratio against direct competitors in the same sector. If Stock A has a P/E ratio of 25 while competitors average 18, investigate why—it might reflect superior growth prospects or indicate the stock has run ahead of fundamentals.
Examine Historical Trends
Review how a company's current P/E ratio compares to its historical range over the past 5-10 years. A ratio significantly below historical averages might signal undervaluation—assuming fundamentals remain solid.
Consider the PEG Ratio
The Price/Earnings to Growth (PEG) ratio enhances P/E analysis by incorporating expected earnings growth rates:
PEG Ratio = P/E Ratio ÷ Annual Earnings Growth Rate
Some market participants use a PEG ratio near or below 1.0 as one reference point when evaluating valuation relative to growth, though this is not a definitive indicator of value. This metric helps distinguish between expensive growth stocks and genuinely overvalued ones.
Integrate with Other Metrics
Use the P/E ratio alongside complementary metrics for well-rounded analysis:
-
Price-to-Book (P/B) Ratio: Compares stock price to book value per share
-
Debt-to-Equity Ratio: Reveals financial leverage and risk
-
Return on Equity (ROE): Measures profitability efficiency
-
Dividend Yield: Indicates income generation potential
Platforms like Longbridge provide comprehensive market data and analytical tools to help you evaluate these metrics efficiently.
Limitations of the P/E Ratio
While useful, the P/E ratio has important limitations:
Earnings Manipulation: Companies can employ accounting techniques that inflate earnings temporarily. Always examine cash flow statements to verify earnings quality.
Negative Earnings: When companies lose money, the P/E ratio becomes undefined and useless for valuation—common for startups and cyclical businesses during downturns.
Debt Ignored: The P/E ratio doesn't consider debt levels. Two companies with identical P/E ratios may have vastly different risk profiles based on their capital structure.
One-Time Events: Non-recurring items like asset sales or restructuring charges distort earnings temporarily and don't reflect ongoing performance.
Economic Cycles: During expansions, elevated P/E ratios may reflect broad optimism rather than individual merit. During recessions, depressed ratios might mask quality opportunities.
P/E Ratios Across Different Sectors
Different industries maintain characteristically different P/E ratio ranges based on growth expectations and business models:
-
Technology: P/E ratios between 25-40, reflecting high growth expectations
-
Financial Services: P/E ratios between 10-15 for traditional institutions
-
Consumer Staples: P/E ratios between 15-25, reflecting stable growth
-
Utilities: P/E ratios between 12-18 due to regulated models
-
REITs: Evaluate P/E alongside dividend yields and Funds From Operations (FFO) metrics
Common Mistakes to Avoid
Even experienced investors sometimes misuse the P/E ratio. Common analytical pitfalls include:
-
Comparing Across Industries: Cross-sector comparisons may be less meaningful due to structural differences.
-
Ignoring Growth Rates: High P/E isn't automatically bad with strong growth; low P/E isn't always attractive with declining prospects
-
Relying on P/E Alone: Consider competitive position, management quality, and balance sheet strength
-
Forgetting Market Context: During bubbles, elevated P/E ratios become normalized across sectors
-
Neglecting Cash Flow: Verify earnings translate into actual cash generation
Frequently Asked Questions
What is considered a good P/E ratio?
There is no universal "good" P/E ratio—context determines appropriateness. Generally, P/E ratios between 10 and 20 are considered fairly valued for many sectors, though this varies significantly by industry. Technology companies often maintain higher ratios due to growth expectations, while mature industries typically show lower multiples. Compare companies against their industry peers and historical ranges rather than applying absolute standards.
Is a high P/E ratio good or bad?
A high P/E ratio can be either positive or concerning depending on context. It's positive when justified by strong earnings growth potential, competitive advantages, or expanding market opportunities. It becomes problematic when the stock price has run ahead of fundamentals, creating overvaluation risk. Always investigate why the market assigns a premium valuation before making investment decisions.
What is the difference between trailing and forward P/E ratios?
Trailing P/E ratios use actual earnings from the past 12 months, providing factual historical data. Forward P/E ratios rely on analyst estimates for future earnings, offering insight into expected performance. Trailing P/E works better for stable companies with predictable earnings, while forward P/E can be more informative for growth companies or businesses undergoing change—though it depends on estimate accuracy.
Can P/E ratios be negative?
When a company reports losses instead of profits, the P/E ratio becomes negative or mathematically undefined. Negative P/E ratios provide no useful valuation information. For unprofitable companies, investors should focus on alternative metrics like revenue growth, cash burn rate, path to profitability, or price-to-sales ratios.
How often should I check P/E ratios?
Review P/E ratios whenever you evaluate a potential investment or reassess existing holdings. Since stock prices fluctuate daily while earnings update quarterly, the P/E ratio changes constantly. However, focus on meaningful changes rather than daily variations—quarterly earnings releases and significant price movements warrant closer examination of valuation metrics.
Conclusion
The P/E ratio serves as a valuable starting point for stock valuation, offering quick insight into how the market prices a company's earnings. However, its true power emerges when used thoughtfully alongside other financial metrics, industry context, and qualitative analysis.
Remember that no single metric tells the complete investment story. Investors typically consider business fundamentals, competitive positioning, growth prospects, and management quality—factors that numbers alone cannot fully capture.
Incorporating P/E analysis may support a more structured evaluation process about which stocks align with your investment goals and risk tolerance. The key lies in understanding what the ratio reveals, recognizing its limitations, and always maintaining perspective on the bigger picture.
Explore the Longbridge app to access market data and research tools. Learn more about financial analysis through our educational resources.