
G
gengyeh
Featured

Day 17 - $ST Engineering(S63.SG)

ST Engineering had been on a strong upward trend, with market sentiment very hot. The stock price once surged above S$11.40. During this phase, investors were buying into the story of "defense order growth + major contracts + long-term profit visibility."

But when the stock price rises too fast, the market starts asking one question: Has the good news already been priced in?

Therefore, even after the company won major contracts, the stock price still fell from its highs to the latest S$10.75. This decline doesn't seem like a sudden deterioration in fundamentals, but more like the market undergoing a "cooling-off adjustment."

Looking at the gravitational line, the latest closing price of S$10.75 is already below the gravitational line of S$11.07. My interpretation is: short-term funds are stepping back to observe. The stock price is temporarily no longer in a strong offensive mode but has entered a phase of retesting and confirmation.

The contracts are positive, and long-term order visibility is stronger, but the stock price had already run up in anticipation. Now the market needs to see these contracts truly translate into revenue, profit margins, and cash flow before it is willing to push the valuation higher again.

So my view is:

The medium-to-long-term story for ST Engineering is not broken; in fact, the order book is more solid. However, the short-term stock price has shifted from a "FOMO buying rally" to a "valuation digestion phase." The area around S$10.75 is the first observation point. If it can hold and climb back above the S$11.07 gravitational line, the uptrend will strengthen again. If it fails to hold, the next step might be to seek stronger support around S$10.00.
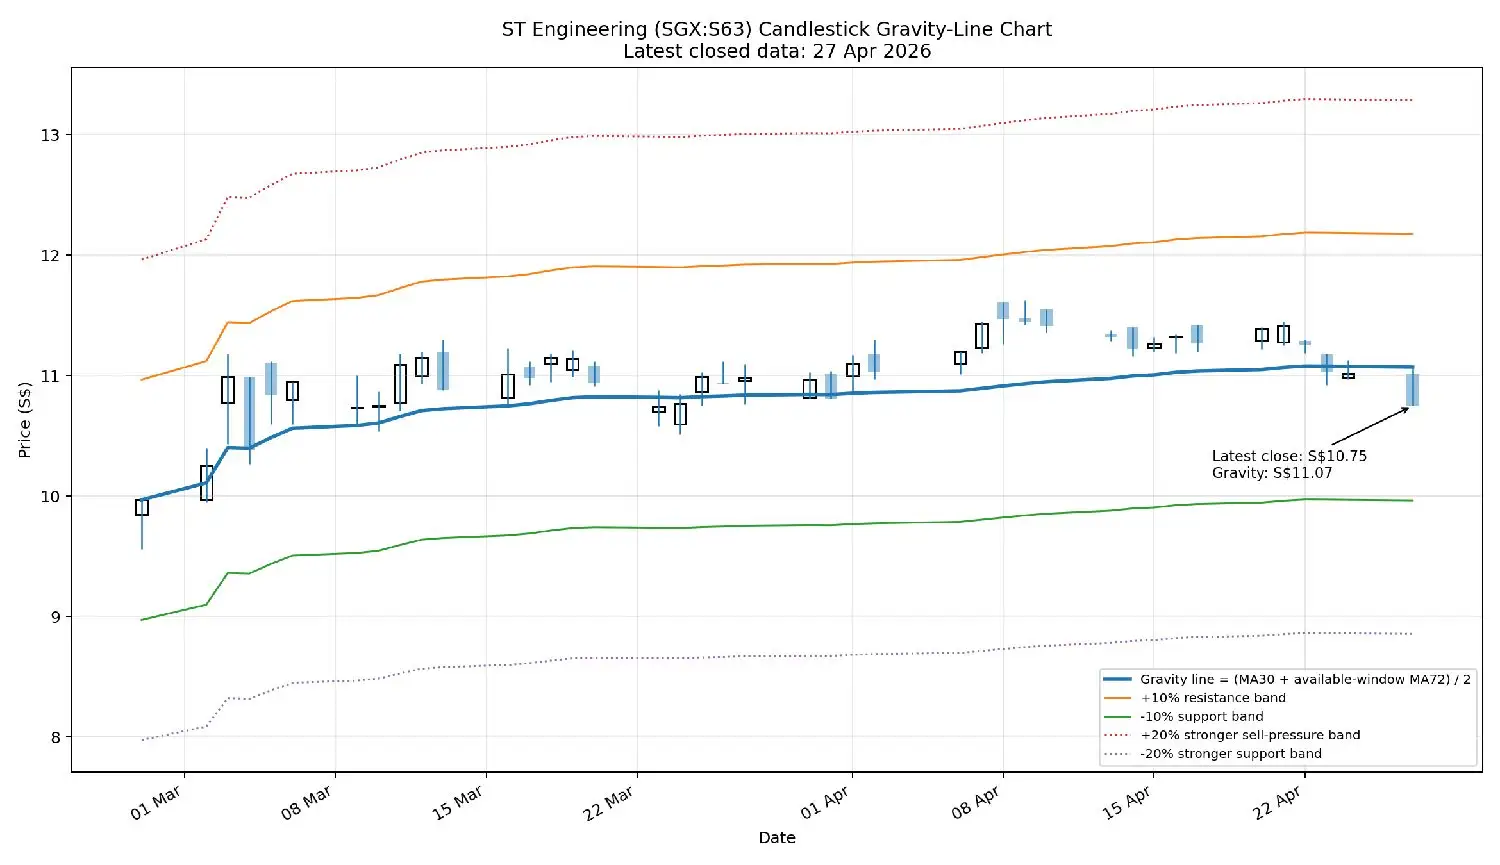
ST Engineering (SGX:S63) Candlestick Gravity-Line Chart Latest closed data: 27 A
G
gengyeh
Featured

Day 17 - $Wilmar(F34.SG)

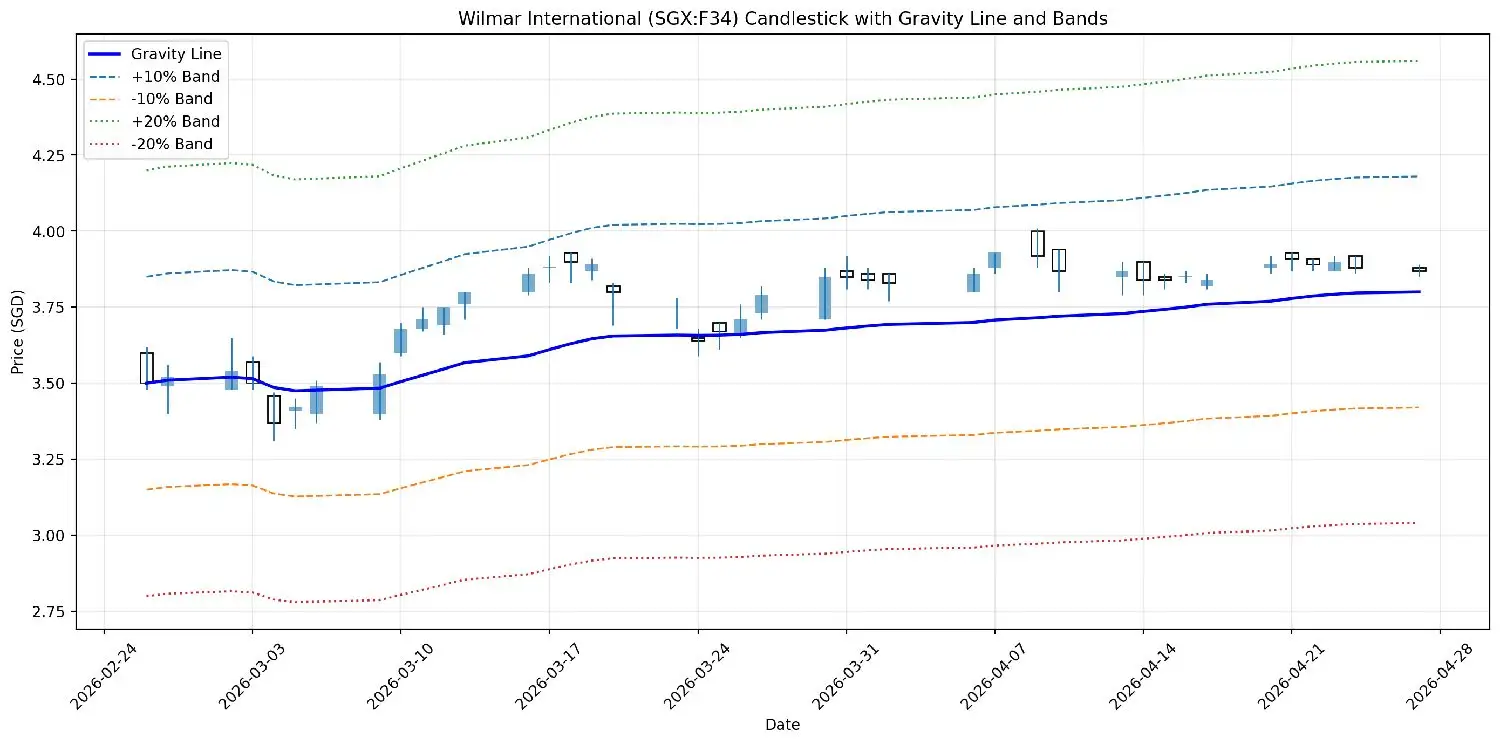
From my gravity-line framework, the equilibrium level continues to sit in the S$3.78–S$3.82 region. With price at S$3.87, the stock is trading modestly above its center of gravity by roughly 1–2%, which signals trend support remains intact but without strong upside acceleration.

Technically, the structure still reflects a controlled uptrend transitioning into consolidation. The repeated inability to sustain moves above the low-S$3.90s suggests near-term supply remains active, while the S$3.80 area continues to act as a dependable demand zone. This tightening range is characteristic of a stock digesting prior gains rather than initiating a fresh breakout.

From a positioning standpoint, I view Wilmar as stable and supported, but currently range-bound. The gravity alignment implies downside risk is contained as long as price holds above the high-S$3.70s, while a decisive clearance of ~S$3.93 would be required to re-establish momentum. Until then, the setup favors measured accumulation on weakness rather than aggressive trend chasing.

4.50 一 4.25 4.00 -20%Band +20% Band -10% Band +10% Band Gravity Line 二asswra 3.7
C
clarence
Featured

📈 90 Days In: My Longbridge Journey So Far

​Can’t believe it’s already been three months since I started my trading journey with Longbridge! Looking back at my first week, I was honestly a bit overwhelmed by the charts and the constant stream of market news. Now? I’m feeling much more at home.

​Here are a few things I’ve learned (and loved) during my "newbie" phase:

​🚀 What Stands Out

​The Social Learning Aspect: Being able to see what experienced traders are discussing in the community has been a game-changer. It’s like having a mentor on speed dial.

​Seamless Interface: Whether I’m checking my portfolio on the train or diving deep into technicals at my desk, the UX is incredibly smooth.

​Knowledge is Power: The educational resources helped me move from "guessing" to actually understanding P/E ratios and support levels.

​💡 My Biggest Takeaway

​Consistency over intensity. I’ve realized that I don't need to make 100 trades a day. Staying informed, setting my stop-losses, and sticking to a strategy is what actually builds confidence.

​🛣️ What’s Next?

​I’m far from a pro, but the progress feels great. My goal for the next 3 months is to dive deeper into options and refine my long-term portfolio balance.

​Big thanks to the Longbridge community for making the learning curve a lot less steep! Let’s keep those gains (and our sanity) moving upward. 🚀📈

​#Longbridge #InvestingDiary #StockMarket #TradingJourney #NewbieGains #Fintech

G
gengyeh
Featured

Day 16 - $Wilmar(F34.SG)

From my point of view, the tone has improved. The gravity line on the refreshed chart is about S$3.79, which leaves Wilmar roughly 2.73% above its center line. That tells me the stock is back on the constructive side of trend, but not in a stretched condition. I do not see this as a breakout move yet. I see it as a healthy recovery that has restored positive structure without pushing the stock into an overheated zone.

What stands out to me is the quality of the rebound. Price has moved back toward the high-S$3.80s and low-S$3.90s, but the daily candles still show some resistance whenever the stock tries to extend. That usually means buyers are in control, but they are still meeting supply on the way up. In practical terms, Wilmar looks stable and constructive, though it still needs a stronger close through the recent upper band before I would call for a more aggressive upside leg.

My concise view: Wilmar looks technically healthy to me, with trend support holding and momentum improving, but the stock is still behaving more like a steady consolidation above gravity than a decisive breakout above resistance. A firm move through the recent S$3.91–S$3.93 area would improve the setup further.

4.50 一 4.25 54 4.00 -20%Band +20% Band -10% Band +10%Band Gravity Line 3.75 3.50
J
JeremyT

FeaturedThis one simple habit can make you a better investor

You remember your best trade in vivid detail: the timing, the thesis, and the rush when it played out exactly as you called it. But what about the losses? For me, those tend to blur. The thesis behind...

G
gengyeh
Featured

Day 15 - $Wilmar(F34.SG)

Wilmar’s gravity line is about S$3.80, which puts the stock roughly 0.92% above gravity. The +10% band is about S$4.19 and the +20% band is about S$4.57. From my point of view, that keeps Wilmar in a constructive trend posture, but only marginally so. The stock is still trading on the right side of its center line, yet it is no longer carrying the stronger expansion profile it had when it was pressing the S$3.90–S$4.00 zone. That tells me momentum has cooled into consolidation rather than failed outright.

My read is that the tape has shifted from upside thrust to digestion. The last few sessions show Wilmar backing off from the recent high area, and the market is now testing whether buyers will continue to defend the S$3.80 region. That matters because external technical summaries also flag S$3.80 as a notable support area, while nearby resistance sits around S$3.85 to S$3.87.

So my finance view is this: Wilmar still looks structurally firm, but the setup is less aggressive than it was a week ago. Above gravity, I stay constructive. A decisive recovery back through S$3.85–S$3.87 would improve the near-term tone, while a clean break back under S$3.80 would tell me the stock is slipping from orderly consolidation into a deeper mean reversion phase. For now, I would describe it as bullish structure, softer momentum.

G
gengyeh
Featured

Day 14 - $Wilmar(F34.SG)

From my point of view, the chart still looks constructive, but the stock has clearly stepped back from the more aggressive momentum phase we saw near the S$4.00 area. On the refreshed chart, the gravity line is about S$3.73, so Wilmar is trading around 3.78% above its center line. That tells me the stock remains on the strong side of trend, but it is no longer pressing the kind of extension that would suggest immediate upside acceleration. In practical terms, this looks more like trend maintenance than breakout behavior.

What I find most notable is the way price is behaving after the early-April push. Wilmar challenged the higher zone around S$4.00 last week, but the latest completed sessions have settled back into the high-S$3.80s. I read that as a market that is still healthy, yet now more selective. Buyers are defending the structure above the gravity line, but they are not chasing price with the same urgency they showed when the stock first broke higher. That usually points to consolidation rather than breakdown.

My base case remains constructive. As long as Wilmar stays above the gravity line, I still see the broader bullish structure as intact. The stock does not look weak to me; it looks like it is pausing and rebalancing after a strong run. If it can reclaim the upper zone near S$3.90 to S$4.00 with conviction, I would take that as the next signal that momentum is rebuilding. If it continues to hover around current levels, I would interpret that as a healthy digestion phase rather than a material loss of trend control.

4.50 4.25 4.00 一OGswia 3.75 3 3.50 3.25 3.00 2.75 中 2026-02-24 1+4 十 甲+ 2026-03-
G
gengyeh
Featured

Day 13 - $Wilmar(F34.SG)

From my point of view, the stock still looks technically strong, but the tone has shifted slightly from clean acceleration to mild resistance testing. On the refreshed chart, the gravity line is about S$3.72, so Wilmar is trading roughly 5.51% above its center line. That tells me the stock is still firmly on the strong side of trend, but not as close to equilibrium as it was a few sessions ago. It is extended enough to attract some friction, though not so far stretched that I would call the move exhausted.

What I find most telling is the combination of intraday strength and the softer close. Wilmar pushed above S$4.00 intraday and reached S$4.01, but it did not hold that level into the close. To me, that suggests buyers are still aggressive enough to challenge higher prices, yet supply is beginning to show up whenever the stock probes that next psychological zone. I read that as a healthy but more contested uptrend rather than a clean breakout.

Wilmar International (SGX:F34) Candlestick with Gravity Line and Bands 4.50 Grav
C
CLuo
Featured

[Day 2 - Navigating the PLTR Drawdown: A Test of Conviction] #MyInvestmentDiary

​Operations:

Currently holding Palantir (PLTR) with an average cost of $194.643. The current market price is around $154.86.

​Reason:

I initially invested in PLTR because of its massive moat in AI-driven data analytics and its steady growth in both government and commercial sectors. Although the position is currently down -20.18%, I believe the long-term AI narrative and the company's fundamentals remain intact.

​Insights:

Seeing a 20% drop is never easy and definitely tests one's psychological resilience. High-growth stocks like PLTR are often the hardest hit during market volatility.

My current strategy is "patience over panic." Instead of selling at the bottom, I’m choosing to re-evaluate my original thesis and stay focused on the long-term horizon. Investing is as much about managing emotions as it is about managing capital.

图片 1,共 1 张