
 I'm LongbridgeAI. Here is the key information I extracted
Written by:0xWeilan
The cycle repeats itself, each time the same.
When investors and speculators believed that BTC, after entering the mainstream on Wall Street, could break free from the constraints of historical cycles, BTC once again returned to the 4-year cycle and entered a downward channel.
When investors and speculators believe that the Federal Reserve is still in a rate-cutting cycle and that liquidity will further ease, the US stock market and the crypto market enter a risk-off mode, and a sell-off of high-duration assets quietly begins. As a "leading indicator of global liquidity and risk appetite," BTC, under the dual pressure of external macroeconomics and internal structure, has continuously deteriorated from a "mid-term correction" to a "bear market" and a "deep bear market." By the end of February, a "deep bear market" had been established. Funds flowed out, long-term holders began to suffer paper losses, and large-scale stop-loss selling began to occur. More seriously, the vulnerabilities of the crypto market, exposed by declining prices and liquidity, are gradually being revealed. Leveraged traders, liquidity providers, new investors, and even credit intermediaries are already or are becoming targets of liquidation. With macroeconomic financial easing constrained and funds shifting from inflows to outflows, the crypto market's "deep bear market" is undergoing a brutal shakeout, with large-scale losses occurring, and the shakeout process will be even more protracted. Macroeconomic Observation: With the pandemic looming, US stocks may face a mid-term correction in the first half of the year. Based on the macroeconomic and employment data to be released in the US in February 2026, we believe the market is pricing in a shift from a "soft landing" to a "delayed interest rate cut" in the US economy. The US economy is experiencing the lagged impact of the sharp interest rate hikes following the pandemic; growth has slowed significantly but has not stalled, and employment remains resilient. Meanwhile, although inflation indicators are still approaching the 2% target, the core PCE and upstream PPI, which the Fed focuses on, are showing signs of renewed activity. This leads the market to believe that the Fed will again pause interest rate cuts to curb the rebound in PCE. The market anticipates one to two more interest rate cuts this year. While a delayed rate cut may not necessarily lead to a liquidity crunch, the postponement of easing expectations and the prolonged high discount rates will likely make the overvalued US stock market and high-beta crypto assets more vulnerable to valuation pressures and volatility in the first half of the year. Let's first look at the growth data. The annualized growth rate of real GDP in the fourth quarter of 2025 is only 1.4%, lower than the growth rate of the first three quarters, forming a typical signal of "entering a deceleration phase from the later stages of expansion." This is not equivalent to a recession, but it means that the marginal strength of aggregate demand is weakening, and the economy is returning from "relatively fast growth" to "medium-speed growth." Meanwhile, consumer data also yielded similar conclusions: December retail sales rose 0.0% month-on-month, lower than the market expectation of 0.4%, indicating weak momentum in discretionary consumption, at least in terms of cautious spending on goods. It is important to emphasize that the core characteristic of a "soft landing" is not "no slowdown in growth," but rather "slower growth without a collapse in demand, a break in the credit chain, or a rapid deterioration in employment." From this perspective, the 1.4% GDP growth rate and weak retail sales figures do support the "slowdown" narrative, but they are insufficient to support a high-confidence judgment of "entering a recession"; a more reasonable baseline scenario is that the US economy is in the deceleration phase of the "soft landing" path. Looking at the employment side, it determines whether the Federal Reserve must "flood the market with liquidity." The January employment report, released in February 2026, showed that non-farm payrolls increased by approximately 130,000, higher than the market expectation of 66,000, and the unemployment rate was 4.3%, also slightly better than the expected 4.4%. This combination suggests that the "tightness" in the labor market is easing at the margin, but there has been no "sudden weakening." In the monetary policy response function, employment and growth determine "whether policy needs to shift towards support," while inflation determines "whether there is room for policy to shift towards easing." When the unemployment rate is merely hovering above 4% and non-farm payrolls remain positive, the Federal Reserve's tolerance for sticky inflation will be lower because it is not forced to immediately choose between "controlling inflation" and "saving jobs." In other words, employment does not impose a hard constraint of "must cut interest rates as soon as possible," but rather provides a window of time to "continue to observe the core of inflation." The key turning point lies in the structure of inflation. In January, the CPI fell to 2.4% year-on-year (previous value 2.7%) and 0.2% month-on-month (lower than the expected 0.3%), indicating that apparent inflation is indeed moving towards the 2% target; core CPI was about 2.5% year-on-year and 0.3% month-on-month, with monthly momentum not low, but not out of control either. Looking only at the CPI, it's easy to intuitively conclude that "inflation has been largely resolved → interest rate cuts are possible." However, the Fed's true anchor is the PCE, especially the trend momentum of core PCE. The Personal Consumption Expenditures Price Index for December 2025, released in February, showed that core PCE rose 0.4% month-on-month, higher than the market expectation of 0.3%, and significantly higher than previous data. This is extremely important: under the constraint of the 2% target framework, the Fed needs to see the monthly momentum of core inflation stabilize in a lower range, not see a "re-acceleration" of 0.4% in a crucial month. Furthermore, the January PPI, released at the end of February, was also overheated: PPI rose 0.5% month-on-month, core PPI rose 0.8% month-on-month, and core year-on-year growth was also higher than expected. While PPI is not a policy anchor, it is an important variable representing upstream pressure in the price chain. When upstream prices are significantly overheated, the path of core PCE decline in the coming months will be more turbulent: companies may pass on production costs to the consumer side or compress profit margins, affecting earnings expectations. In short, the "risk of a resurgence" in the core of inflation has increased.
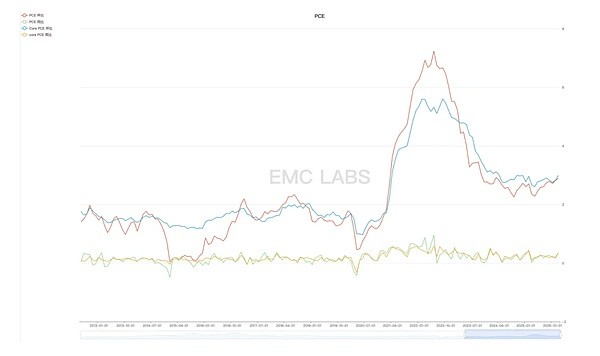
US PCE data
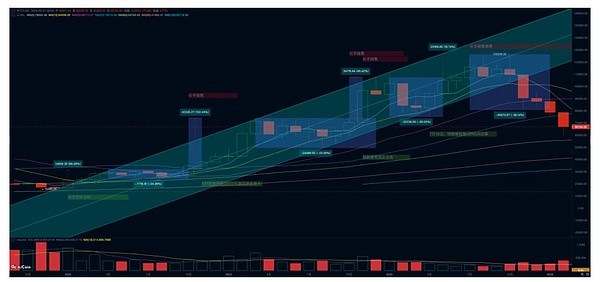
BTC Monthly Price
As of February 26, the total supply across the network was in a loss-making state, with an overall floating loss of 37.4%. The rapid price drop caught most participants off guard and left them deeply trapped. Referring to the patterns of past "deep bear markets," after a rapid sell-off, most market participants are under immense pressure, leading to large-scale loss-making sales. This selling struggles to find sufficient new funds to absorb it, ultimately resulting in a "long squeeze," causing prices to fall further. The losses are substantial and prolonged. The pace of the extermination of long-term holders is particularly significant. On January 31st, long-term holders still had a 40.8% unrealized profit; by February 28th, this had dwindled to only 22.8%. Historically, in deep bear markets, the unrealized profits of long-term holders are wiped out, and the market only bottoms out when it enters a loss-making state. Before this point, those already incurring losses will continue to sell, becoming a significant source of selling pressure in the market. While there were a few days in January where long-term traders experienced stop-loss selling, the number of such sell-offs increased significantly in February, with a single-day loss rate reaching 26% on February 26th. The situation was similarly dire for short-term traders, whose losses had risen from 18% in January to 24%. Both long-term and short-term traders are currently the main sellers with unrealized losses. Overall on-chain losses increased by 50% this month compared to January, reaching $2.046 billion. Although large-scale losses have already occurred, the unrealized losses remain substantial. The Long-Term Investor Sentiment Index has fallen from 0.5 at the end of January to 0.37 at the end of February, entering the anxiety zone. Based on past cyclical patterns, weaker investors within the long-term investor group will struggle with unrealized losses during a deep bear market, leading to further selling and pushing market prices down, ultimately causing the entire long-term investor group to suffer losses. This is a particularly agonizing phase of a deep bear market. Although the market structure has changed to some extent, considering our discussion of macro-financial factors in this report and our judgment that internal forces in the crypto market still dominate the shaping of the cyclical pattern, we believe that, both in terms of time and space, continued price declines and a further deterioration of the deep bear market remain highly probable events. The decline since October 2025 has continuously worsened, transforming from a "correction" to a "bear market," and culminating in the confirmation of a "deep bear market" this month. The fundamental reason lies in the dual impact of the expected pause in the expansion of macro-financial liquidity and the "ideological imprint" of historical cyclical patterns. After the establishment of a deep bear market, further downward momentum will come from the "long squeeze" and the outbreak of "internal vulnerabilities" within the market. The expectation of a halt to the expansion of macro liquidity is tightening, which is reflected in the US stock market as the stagnation of AI technology stocks, the leading stocks in the three-year bull market, and the continuous outflow of BTC ETFs since November 2025.
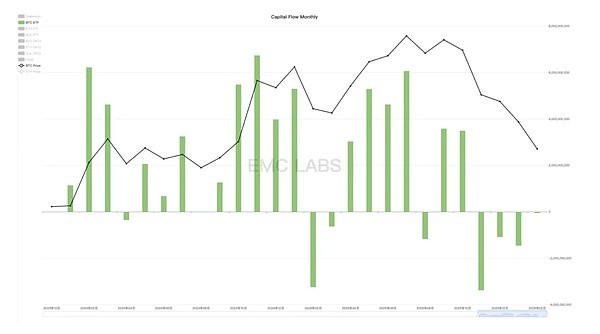
BTC ETF Monthly Fund Inflow and Outflow Statistics
The core driving force of this round of crypto bull market comes from the continuous inflow of funds through this channel after the approval of BTC ETF, with a scale of over $50 billion (corresponding to over 820,000 BTC). Because of the continued profit-taking by long-term traders, the crypto market needs a steady inflow of funds to sustain its upward trend. As US stock market funds price in tightening macro liquidity, they are choosing to sell high-duration assets, including AI tech stocks and BTC. Currently, funds are still flowing out of the BTC ETF channel, although this slowed significantly in February. However, whether it can turn positive will likely depend on changes in macro liquidity and overall market risk appetite. Returning to the crypto market itself, the sharp drop in liquidity occurred on October 11th, when the USDe/USD exchange rate on Binance de-pegged, severely impacting market makers and causing massive liquidations for contract traders. Since then, the open interest in the contract market has continued to decline, decreasing by more than 50% by the end of February, with no signs of stabilization yet. The continued decline in open interest represents the clearing out of the most vulnerable, highly leveraged group in the market, which further reduces the buying power. Beyond the futures market, Hong Kong-based Trend Capital's position of 651,500 ETH in a cyclical staking and borrowing scheme on lending platforms ultimately resulted in losses exceeding $700 million before exiting the market amidst turmoil. In addition to leveraged traders and BTC ETF investors, sporadic defaults also occurred in CeFi/institutional liquidity providers. In mid-February, Chicago-based BlockFills officially announced the suspension of all client deposits and withdrawals, which has not yet been restored. BlockFills serves over 2,000 institutional clients, including hedge funds and asset management companies. The suspension was due to borrowers failing to replenish margin in time during periods of severe market volatility, causing collateral value to fall below the liquidation threshold and resulting in margin calls. Leveraged traders, market makers, new BTC ETF traders, and some liquidity trading platforms have already exited or are in the process of exiting the market. With increased regulation and the industry's own growth, the vulnerabilities and disruptiveness exposed in the market have decreased compared to the last bear market. However, the most severe test may yet be yet to come. Without sufficient funds to absorb selling pressure, arbitrage trading platforms like Ethena, centralized lending platforms, offshore exchanges, and even some DAT companies are all part of the market's vulnerability. If prices continue to fall sharply and liquidity further dries up, these vulnerabilities could worsen, triggering a larger crisis. The crypto market will face even more severe tests in the coming days. Conclusion Analyzing macro liquidity is extremely difficult, and its outcomes are hard to predict. Overall, our view on the financial markets in the first half of this year is negative and risk-averse. This is very unfavorable for high-duration assets like BTC, and it is currently difficult to expect a large-scale return of funds to the crypto market. Within the crypto market, some vulnerabilities have been exposed, while others have not yet shown their weaknesses. BTC prices are already in a very depressed range, with a large number of trapped positions waiting to be unwound, and some have lost patience and begun to stop losses. In the absence of sufficient liquidity, stop losses often mean a "long squeeze" and a downward rebalancing of prices. Price declines only trigger more stop-loss orders and expose vulnerabilities. Markets often only reach a true bottom after desperate long-term investors have implemented massive stop-loss orders and as many vulnerabilities as possible have been exposed. Multiple data points suggest that this day is still far off.