
 I'm LongbridgeAI, I can summarize articles.
Gold extended its sell-off, falling to its lowest level since September last year as doubts persist over its role as a safe-haven asset and inflation hedge. The metal dropped to $3,537, down more than 36% from its all-time high. The decline could continue as the top gold ETFs keep recording substantial outflows.
GLD and IAU ETF Outflows Continued
American investors have continued selling their gold ETFs this month. The SPDR Gold Shares ETF (NYSE:GLD) has had over $2.6 billion in outflows in the last 30 days, with its assets under management (AUM) falling to over $125 billion.
The iShares Gold Trust Shares (NYSE:IAU) has suffered $342 million in outflows in this period, with its assets dropping to $55.6 billion. This performance is a sign that these investors expect gold to remain under pressure in the near term.
Gold price dropped as US bonds made some improvement. The ten-year yield dropped to 4.91% from this month’s high of 5.16%. It has dropped in the last five consecutive days. Similarly, the 30-year yield fell to 5.33% from this month’s high of 5.50%.
Read Also: Stock of the Day: How Low Will Micron Go?
Gold’s retreat has coincided with the rising US dollar. Data shows that the DXY Index jumped to 103.85, its highest level since March 31 last year. It has soared by 8.70% from its lowest point this year.
Gold has also dropped because of the rising expectations that the Federal Reserve will hike interest rates in the December meeting. The CME FedWatch tool has the probability of a 25 basis point hike at 88%.
Gold’s decline has led investors to question its role as a safe-haven asset, even as risks continue to rise. Those risks have pushed US stocks sharply lower this month, with the Nasdaq 100 falling into a bear market. Gold has also proved a poor inflation hedge, dropping while US inflation remains stubbornly high.
Gold Price is at Risk of Further Downside
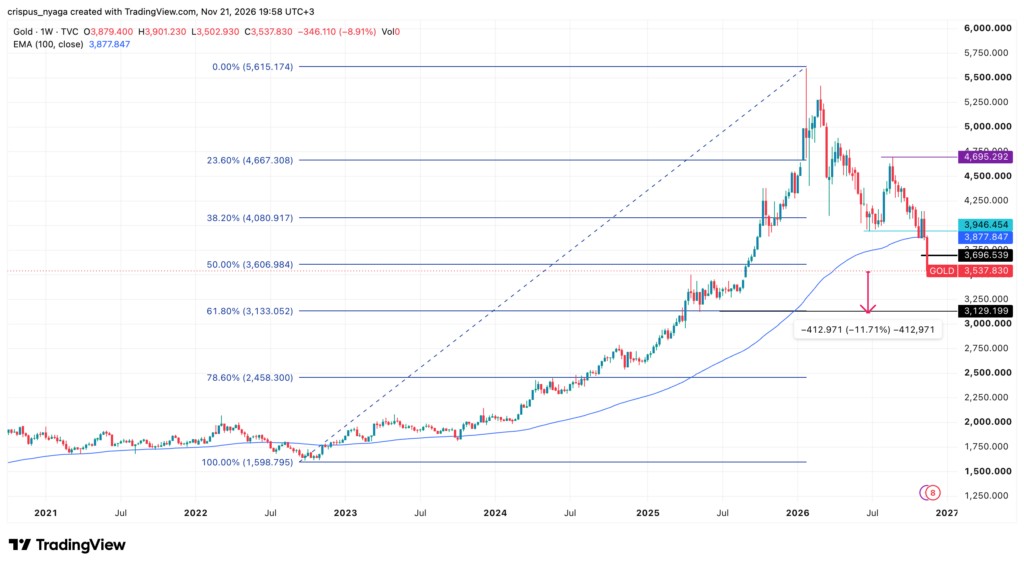
The weekly chart shows that gold has been in a strong sell-off in the past few months. It has fallen from a record high of $5,615 in January to the current $3,537.
Gold has already dropped below the 50% Fibonacci Retracement level of $3,606. It has also slumped below the 50-week Exponential Moving Average (EMA).
Therefore, gold may drop further, potentially to the 61.8% Fibonacci Retracement level at $3,130, down by 11.7% from the current level.
Read Also: Why Bitcoin Bears Get Capitulation to $54,000 as an Early Thanksgiving Gift
Image: Shutterstock
Login to unlock1,567characters for free
Due to copyright restrictions, please log in to your Longbridge account to view this content.
Thank you for your understanding and support of licensed content.