Company Encyclopedia
View More

CK ASSET
01113.HK
CK Asset Holdings Limited operates as a property developer in Hong Kong, the Mainland, Singapore, the United Kingdom, continental Europe, Australia, and Canada. It is involved in the leasing of office, industrial, retail, residential, and other properties; property investment and development activities; and pub, and hotel and serviced suite operation businesses. The company also offers property and project management, finance, and property agency services, as well as invests in infrastructure and utility asset operation. The company was formerly known as Cheung Kong Property Holdings Limited and changed its name to CK Asset Holdings Limited in September 2017.
1.148 T
01113.HKMarket value -Rank by Market Cap -/-
Valuation analysis

P/E
1Y
3Y
5Y
10Y
P/E
-
Industry Ranking
-/-
- P/E
- Price
- High
- Median
- Low
P/B
1Y
3Y
5Y
10Y
P/B
-
Industry Ranking
-/-
- P/B
- Price
- High
- Median
- Low
P/S
1Y
3Y
5Y
10Y
P/S
-
Industry Ranking
-/-
- P/S
- Price
- High
- Median
- Low
Dividend Yield
1Y
3Y
5Y
10Y
Dividend Yield
-
Industry Ranking
-/-
- Dividend Yield
- Price
- High
- Median
- Low
Institutional View & Shareholder
Analyst Ratings
- Price--
- Highest--
- Lowest--
News
View More
Posts
View More
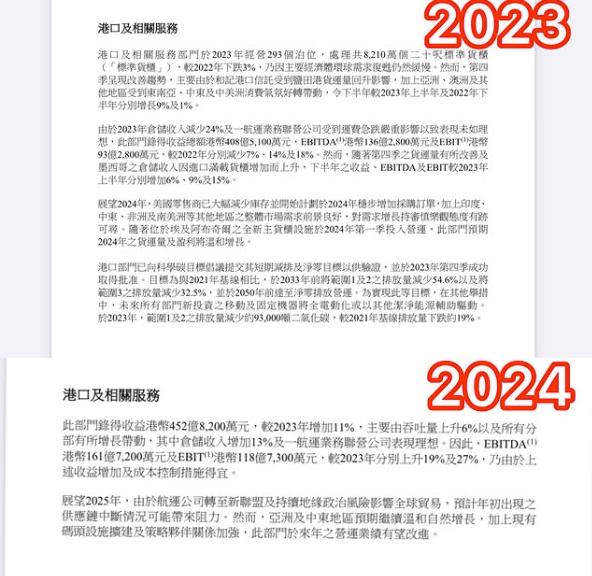
$CKH HOLDINGS(00001.HK) Comparison of CK Hutchison Holdings' performance in 2023 and 2024: The chairman's report significantly reduced the text coverage of port retail and infrastructure businesses co...