


$Hang Seng TECH Index(STECH.HK)
Hang Seng TECH Index vs. Fundamentals
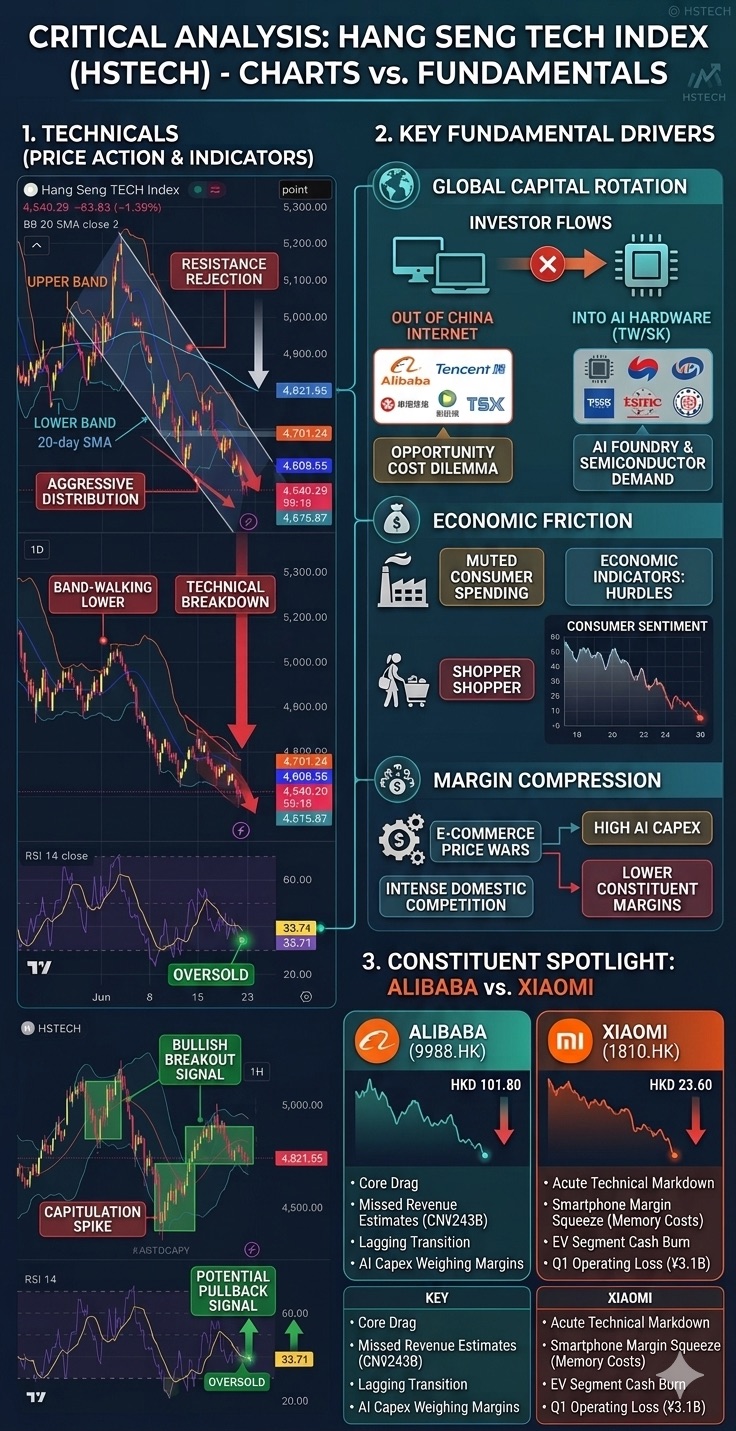
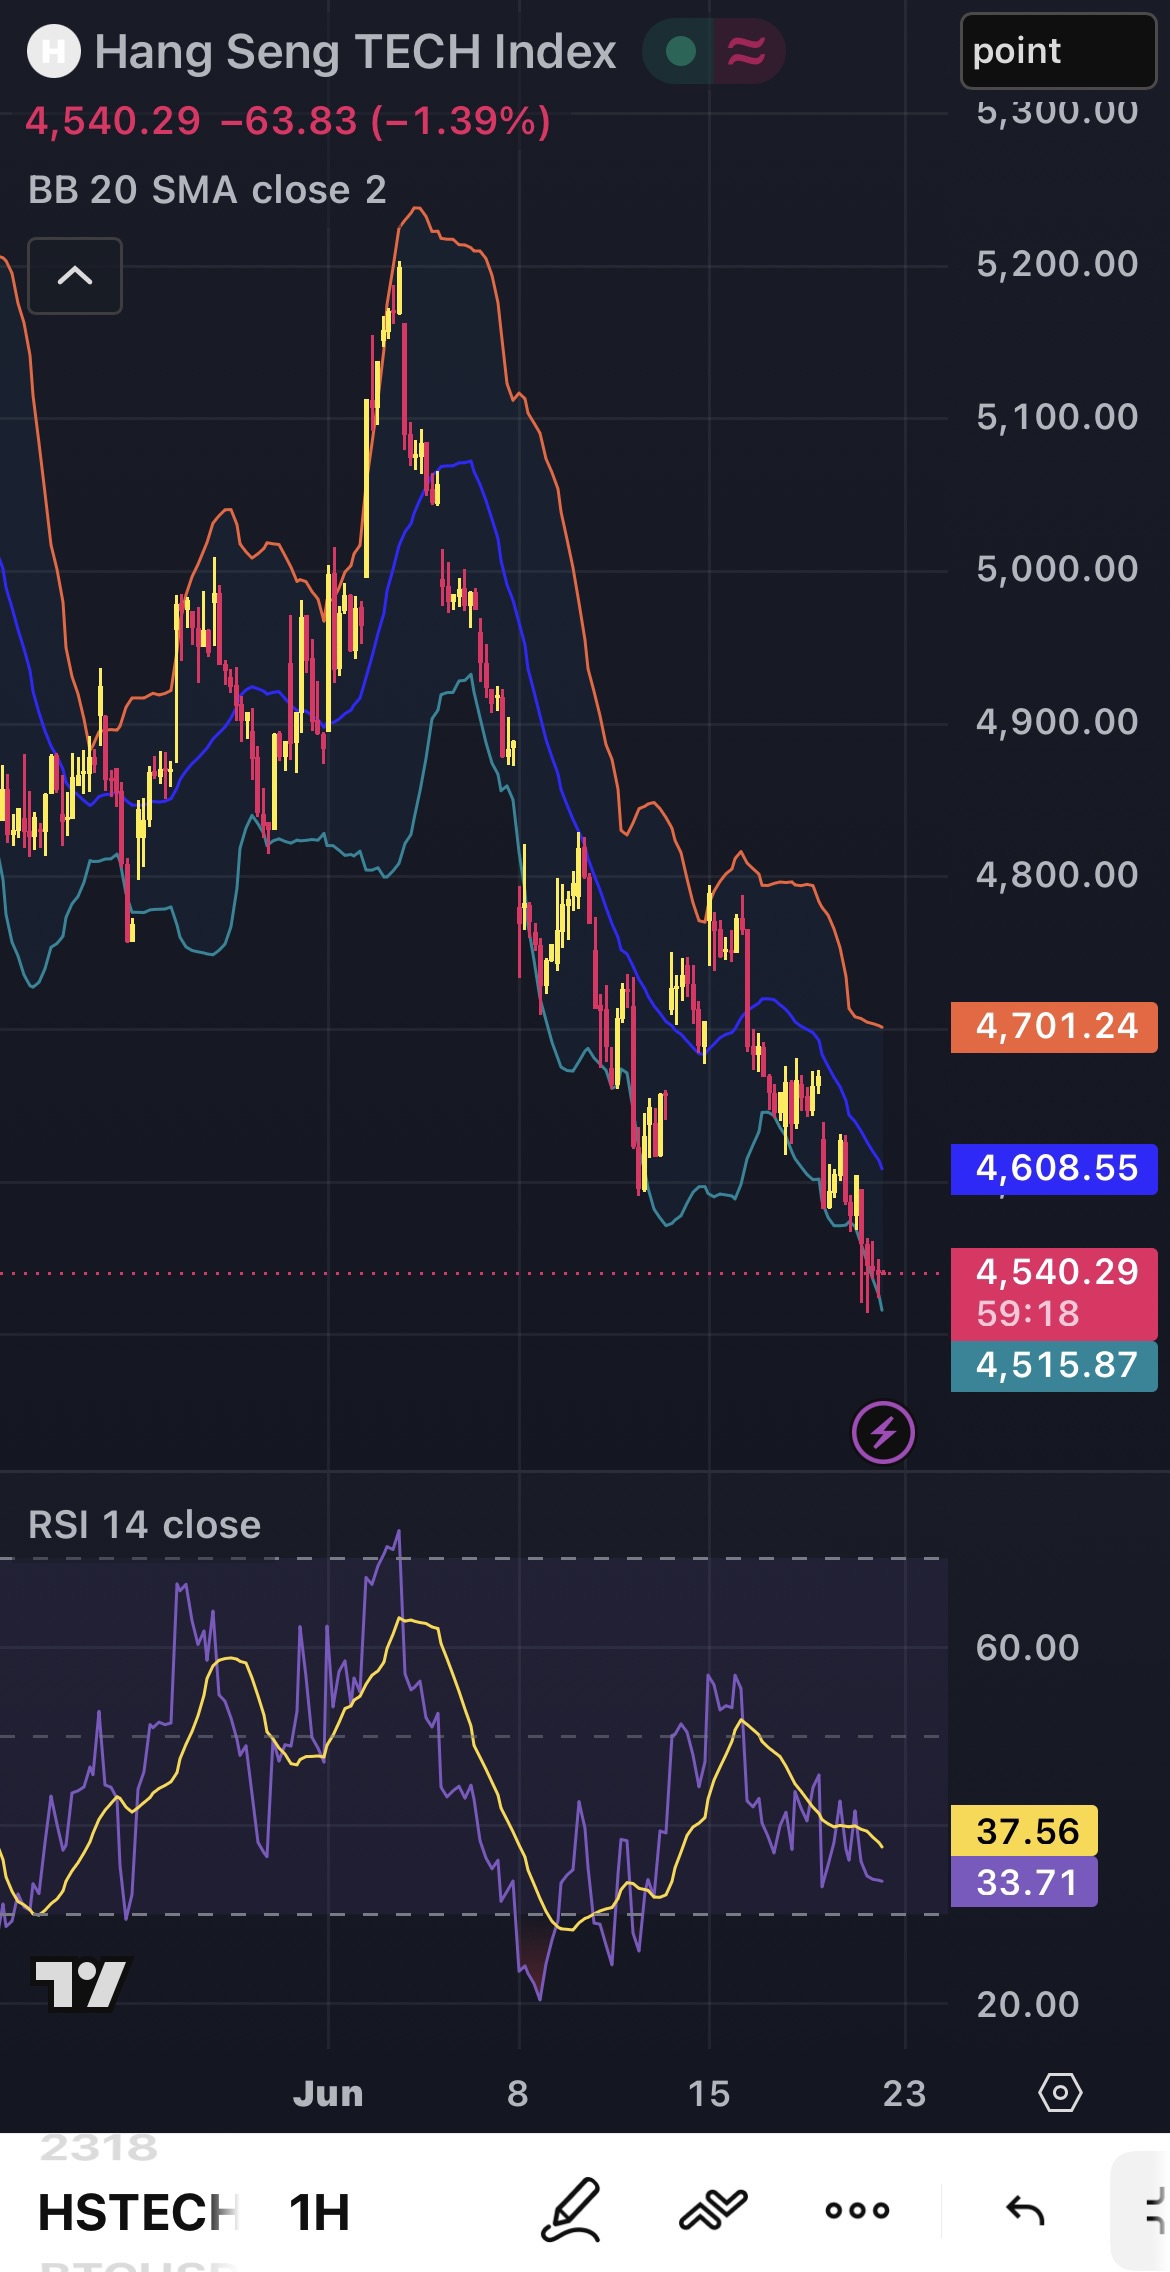
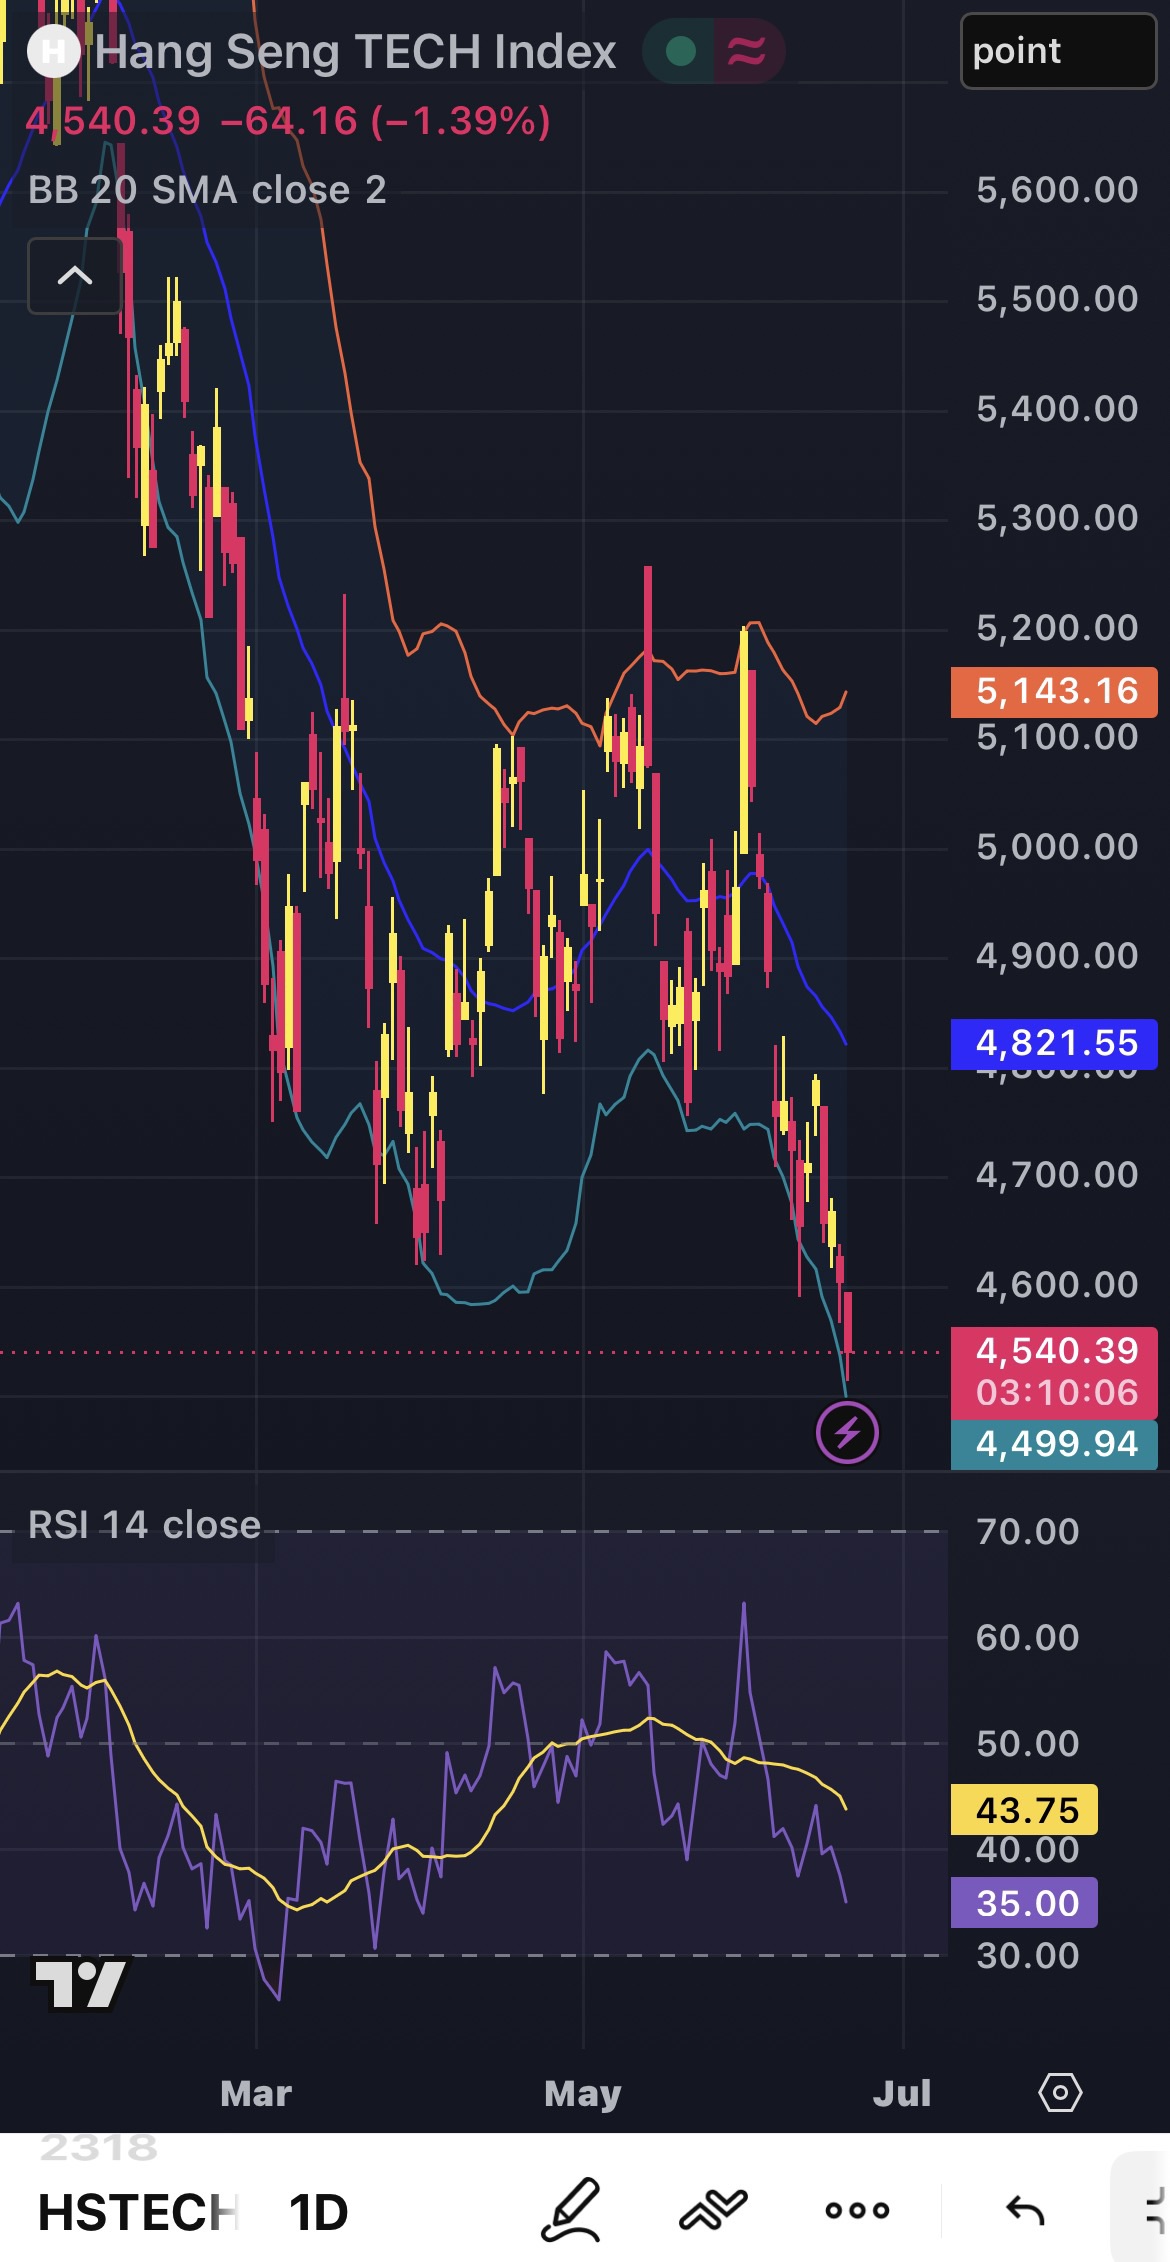
The technical charts for the Hang Seng TECH Index (HSTECH) tell a clear story: bears are firmly in control. The index has broken down to 4,540.39, with price “band-walking” lower along its daily Bollinger Bands.
While a low RSI of 33.71 on the hourly chart hints at a potential short-term oversold pullback signal, the broader macro picture explains why institutional investors are staying cautious.
3 fundamental realities may be the likely possible culprits :
1️⃣Global Capital Rotation: Global funds are rotating out of China’s software-centric internet platforms and moving into hardware and AI semiconductor powerhouses across Taiwan and South Korea.
2️⃣Economic Friction: Slowing domestic retail spending and weak consumer sentiment continue to act as major structural hurdles for consumer-facing tech platforms.
3️⃣Margin Compression: Intensive e-commerce price wars and massive capital expenditures (Capex) on AI development are heavily squeezing operational margins.
Constituent Spotlight: Alibaba vs. Xiaomi
Alibaba (9988.HK): Hovering near critical multi-month support at HKD 101.80. Heavy AI infrastructure investments and lower marketplace monetization mean the former HKD 130 support has now hardened into tough overhead resistance.
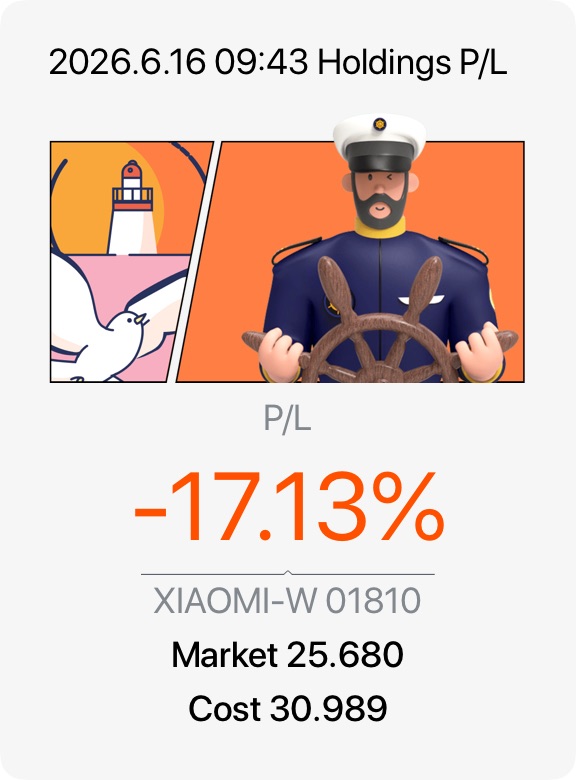
Xiaomi (1810.HK): Facing a severe markdown to HKD 23.60. The company is caught in a margin squeeze from 100% soaring chip costs and sharp Q1 operating losses (¥3.1B) within its scaling EV division.
Until consumer growth metrics stabilise or regional capital flows reverse, technical bounces may face heavy resistance.
What’s your move on HSTECH? Let’s discuss.