Valuation analysis

- P/E
- Price
- High
- Median
- Low
- P/B
- Price
- High
- Median
- Low
- P/S
- Price
- High
- Median
- Low
- Dividend Yield
- Price
- High
- Median
- Low
Institutional View & Shareholder
Analyst Ratings
- Price--
- Highest--
- Lowest--
$JD-SW(09618.HK)Do you have the conviction to buy and hold JD.com for mid term investment?
Both Citigroup (花旗银行) and Goldman Sachs (高盛) have issued a “Buy” rating on JD.com’s Hong Kong–listed shares, c...
Li Auto releases AI glasses Livis; Micron exits retail storage business to focus on AI | Today's Important News Recap
1204 | Dolphin Research Focus: 🐬 Macro/Industry 1. The Beijing Consumer Association, in collaboration with eight major e-commerce platforms including JD.com, Meituan, Pinduoduo, Vipshop, Douyin, Kuai...

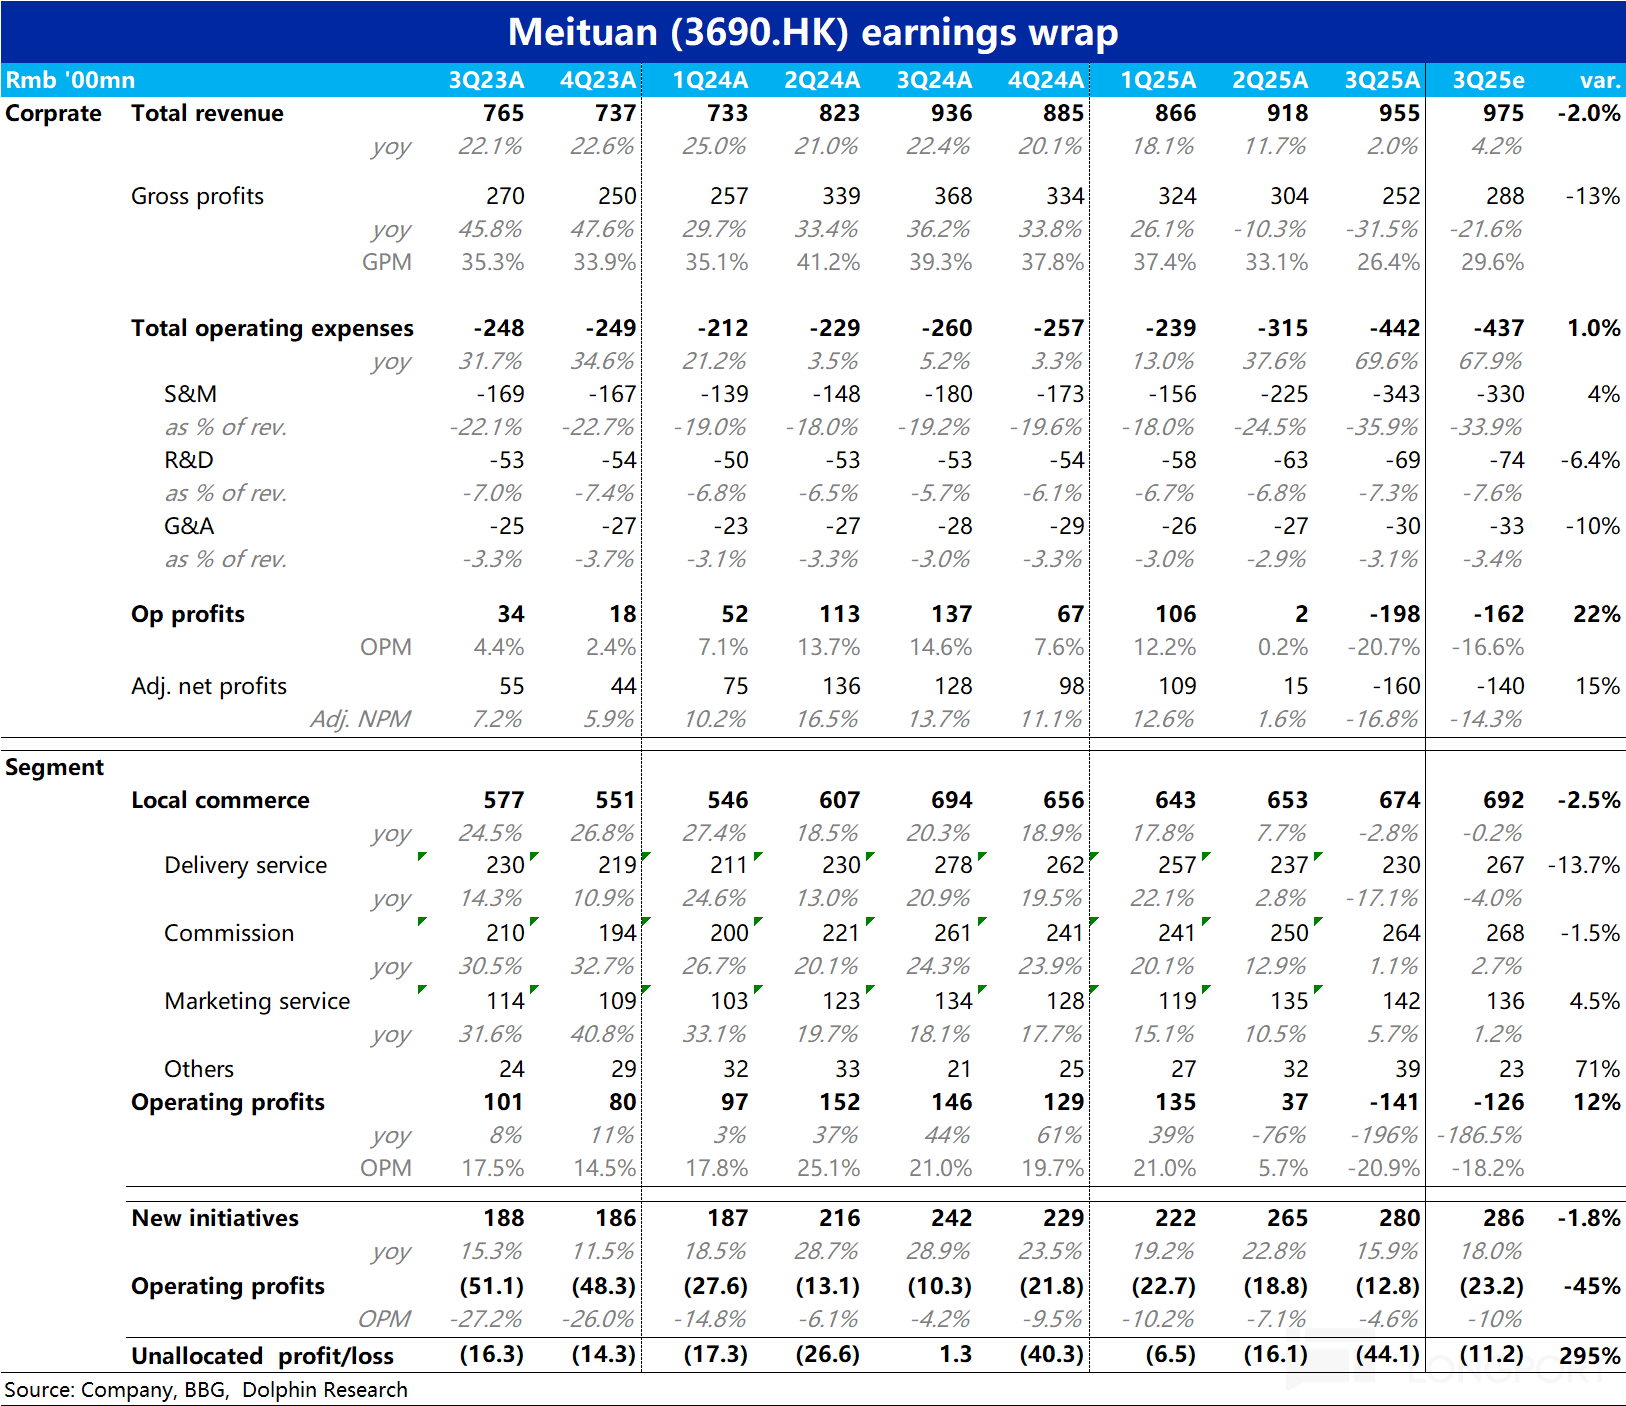
$MEITUAN(03690.HK) released its Q3 earnings after the Hong Kong stock market closed on November 28th, being the last among the 'Three Fools' in the food delivery battle. During the summer quarter, whi...

 +6
+6
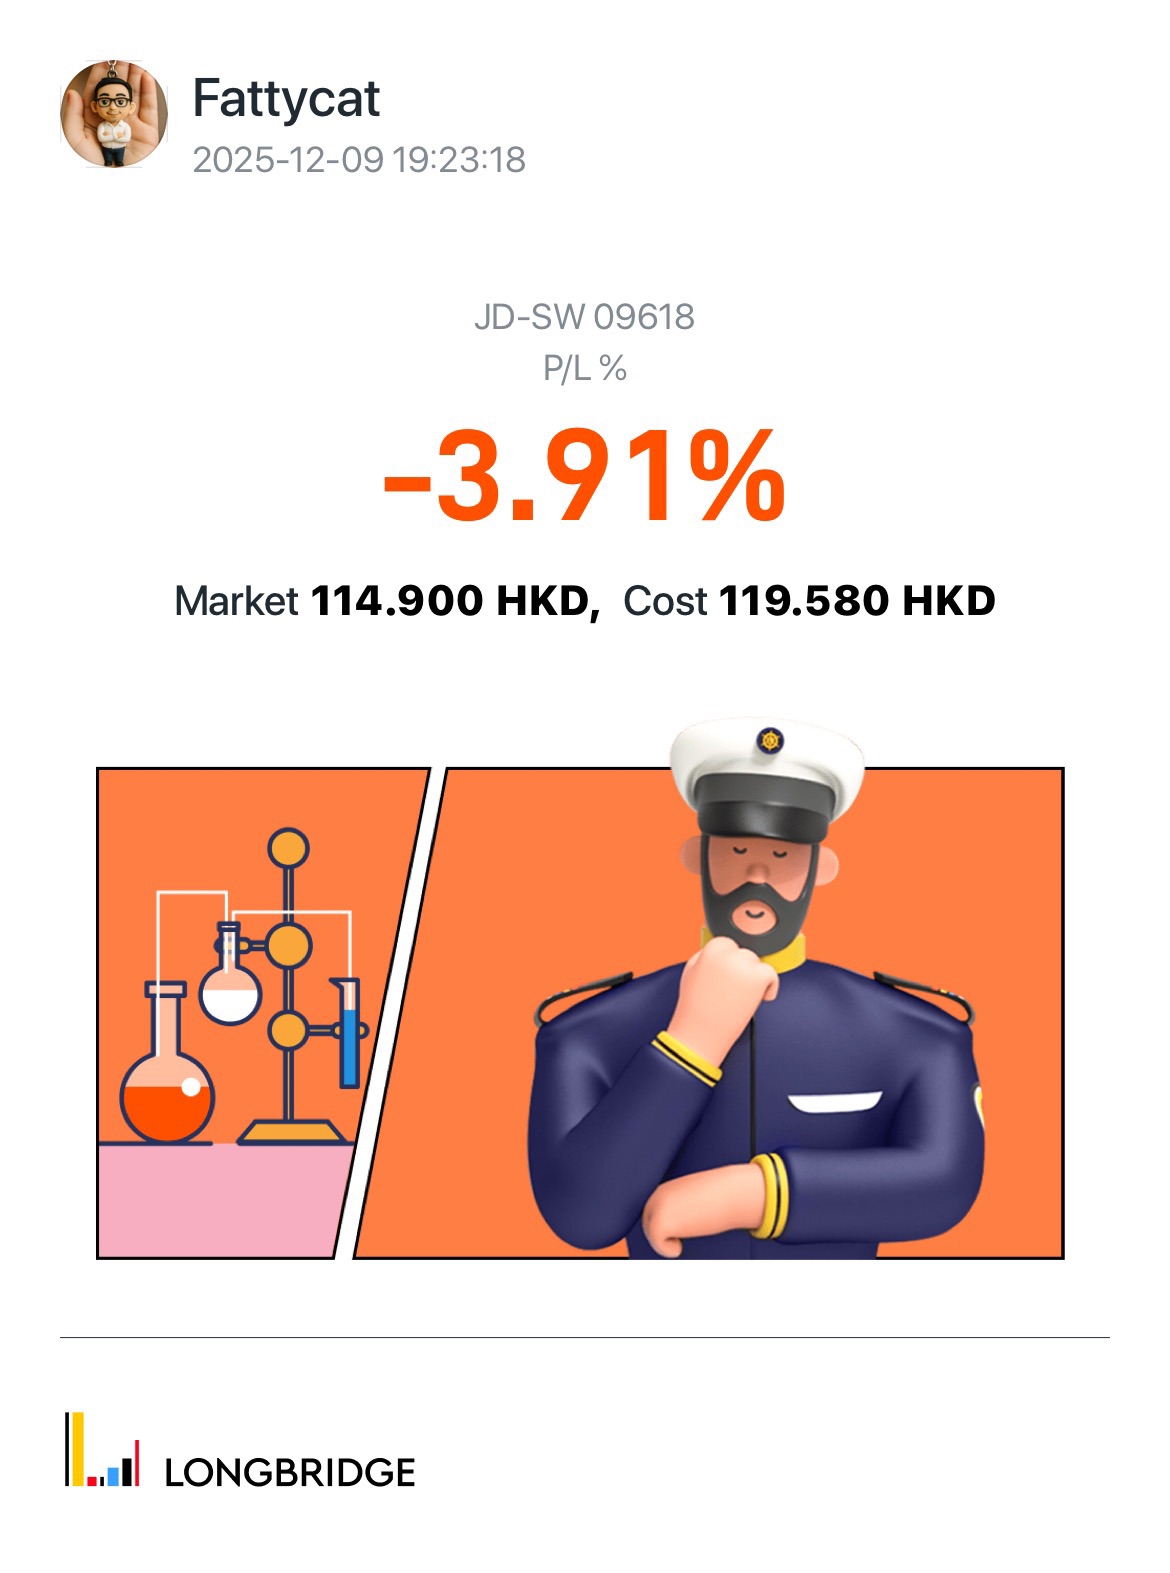
$JD-SW(09618.HK)It’s a good time to buy great company with solid balance sheet, healthy profits, with low gearing. I am dollar cost averaging slowly😁. Do you share the same conviction? 京东加油💪🏽
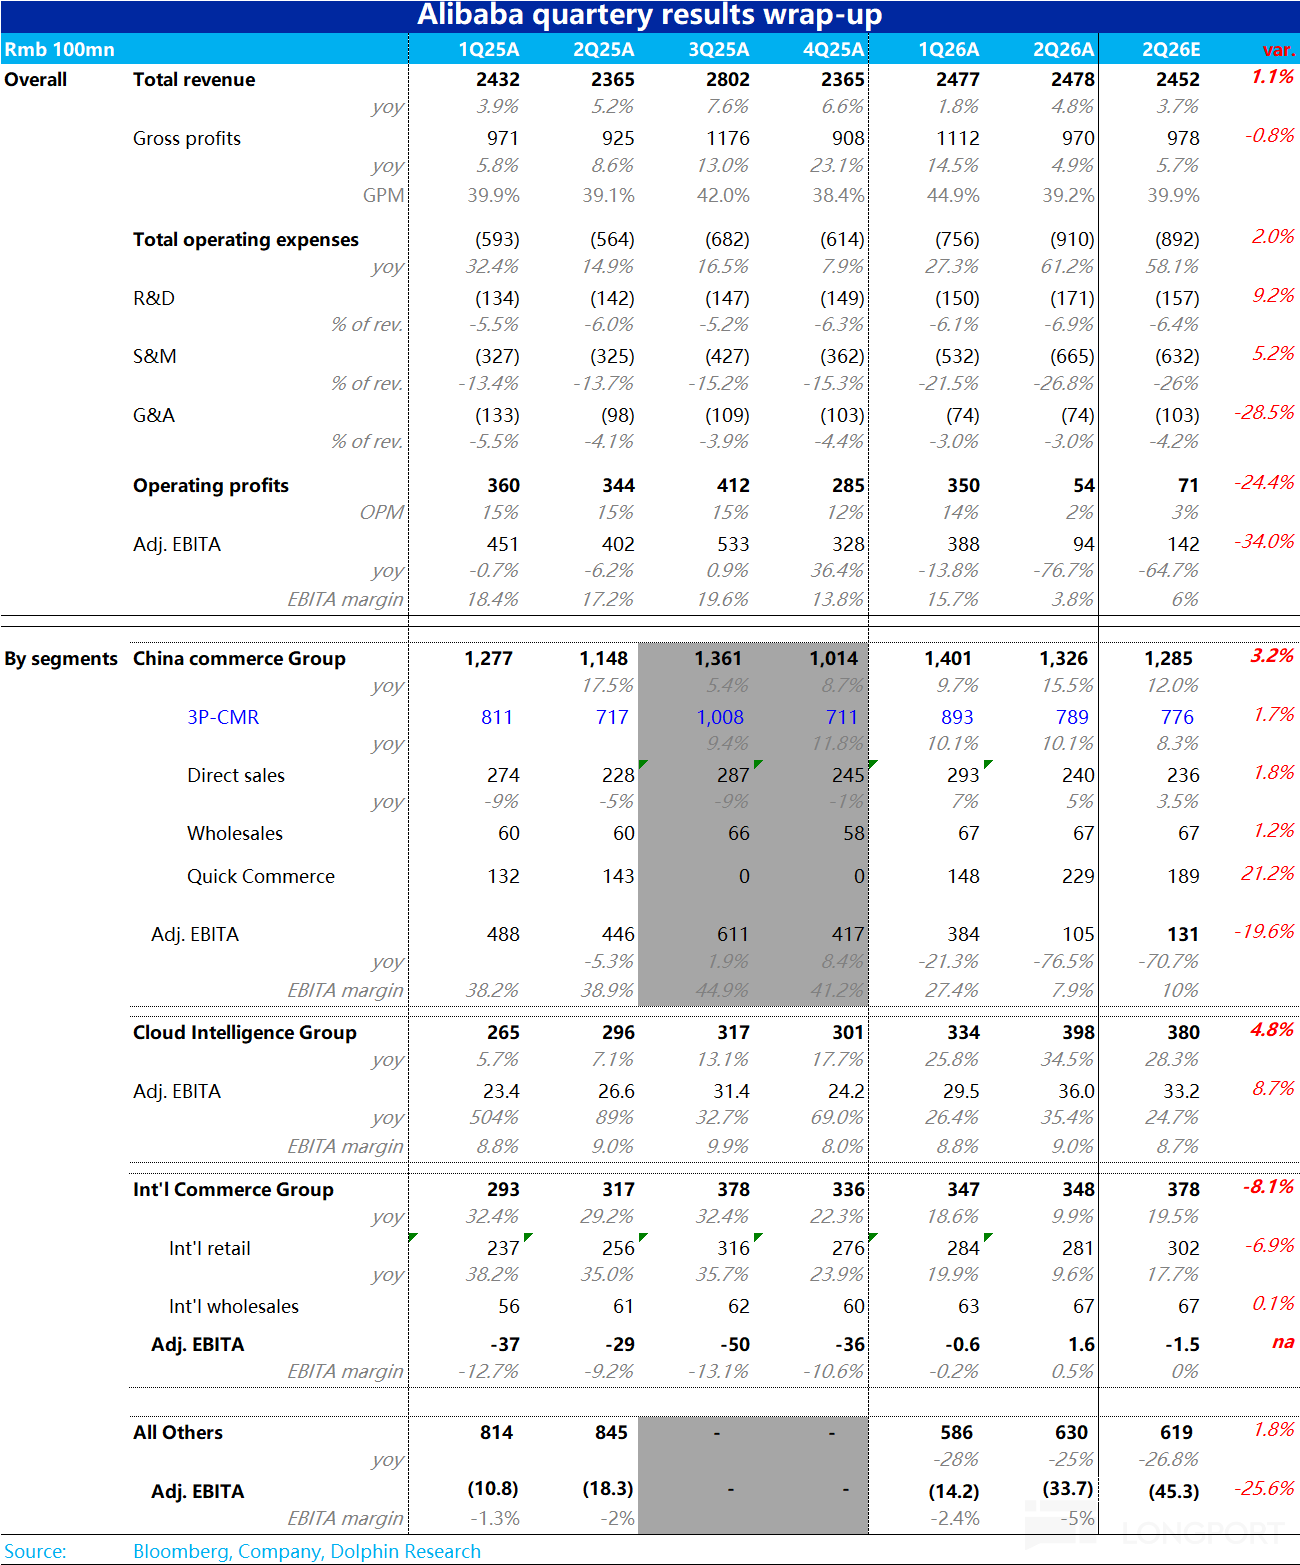
$Alibaba(BABA.US) released its Q2 FY2026 results during US pre-market trading on 25 November. The two key market concerns this quarter centred on investments driven by its food delivery business and t...
+6