Company Encyclopedia
View More

Klarna
KLAR.US
Klarna Group plc operates as a digital bank and flexible payments provider in the United Kingdom, the United States, Germany, Sweden, and internationally. The company provides payment and marketing solutions to consumers and merchants. It also offers Klarna App, card, bank accounts, open banking, and marketing services. The company was formerly known as Klarna UK II plc and changed its name to Klarna Group plc in December 2023.
1.559 T
KLAR.USMarket value -Rank by Market Cap -/-
Valuation analysis

P/E
1Y
3Y
5Y
10Y
P/E
-
Industry Ranking
-/-
- P/E
- Price
- High
- Median
- Low
P/B
1Y
3Y
5Y
10Y
P/B
-
Industry Ranking
-/-
- P/B
- Price
- High
- Median
- Low
P/S
1Y
3Y
5Y
10Y
P/S
-
Industry Ranking
-/-
- P/S
- Price
- High
- Median
- Low
Dividend Yield
1Y
3Y
5Y
10Y
Dividend Yield
-
Industry Ranking
-/-
- Dividend Yield
- Price
- High
- Median
- Low
Institutional View & Shareholder
Analyst Ratings
- Price--
- Highest--
- Lowest--
News
View More
Posts
View More
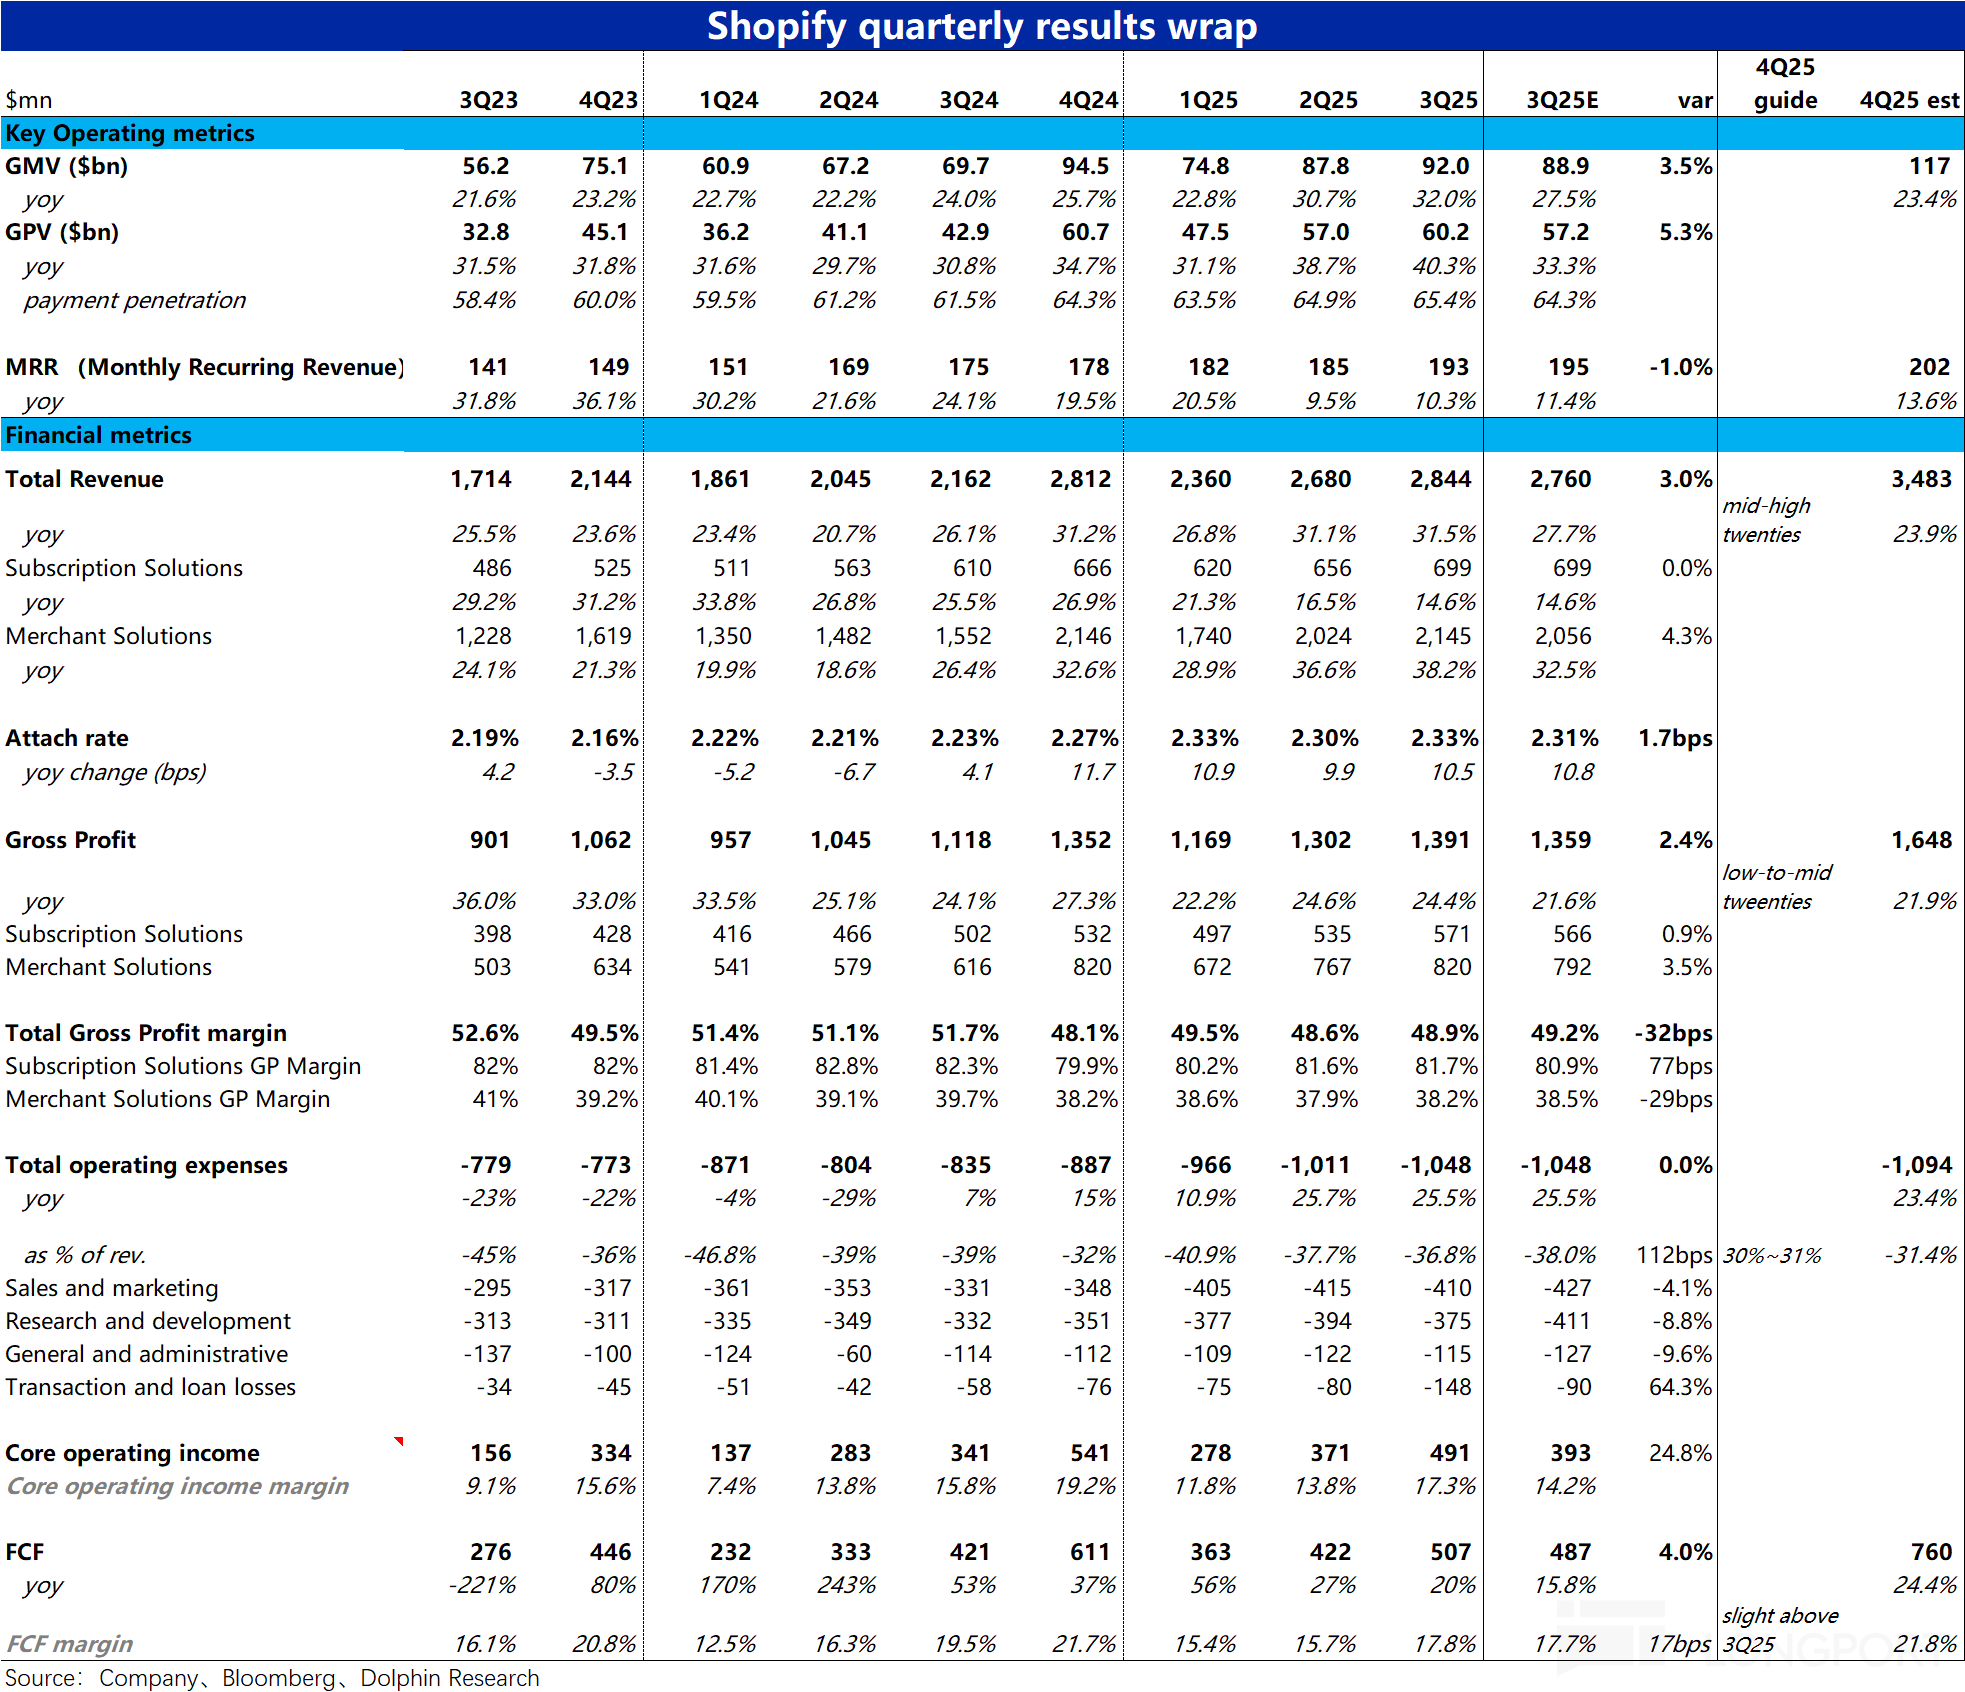
The following is the FY25Q3 earnings call minutes of $Shopify (SHOP.US) organized by Dolphin Research. For earnings interpretation, please refer to "Shopify: Is Imperfection Unacceptable, the Original...

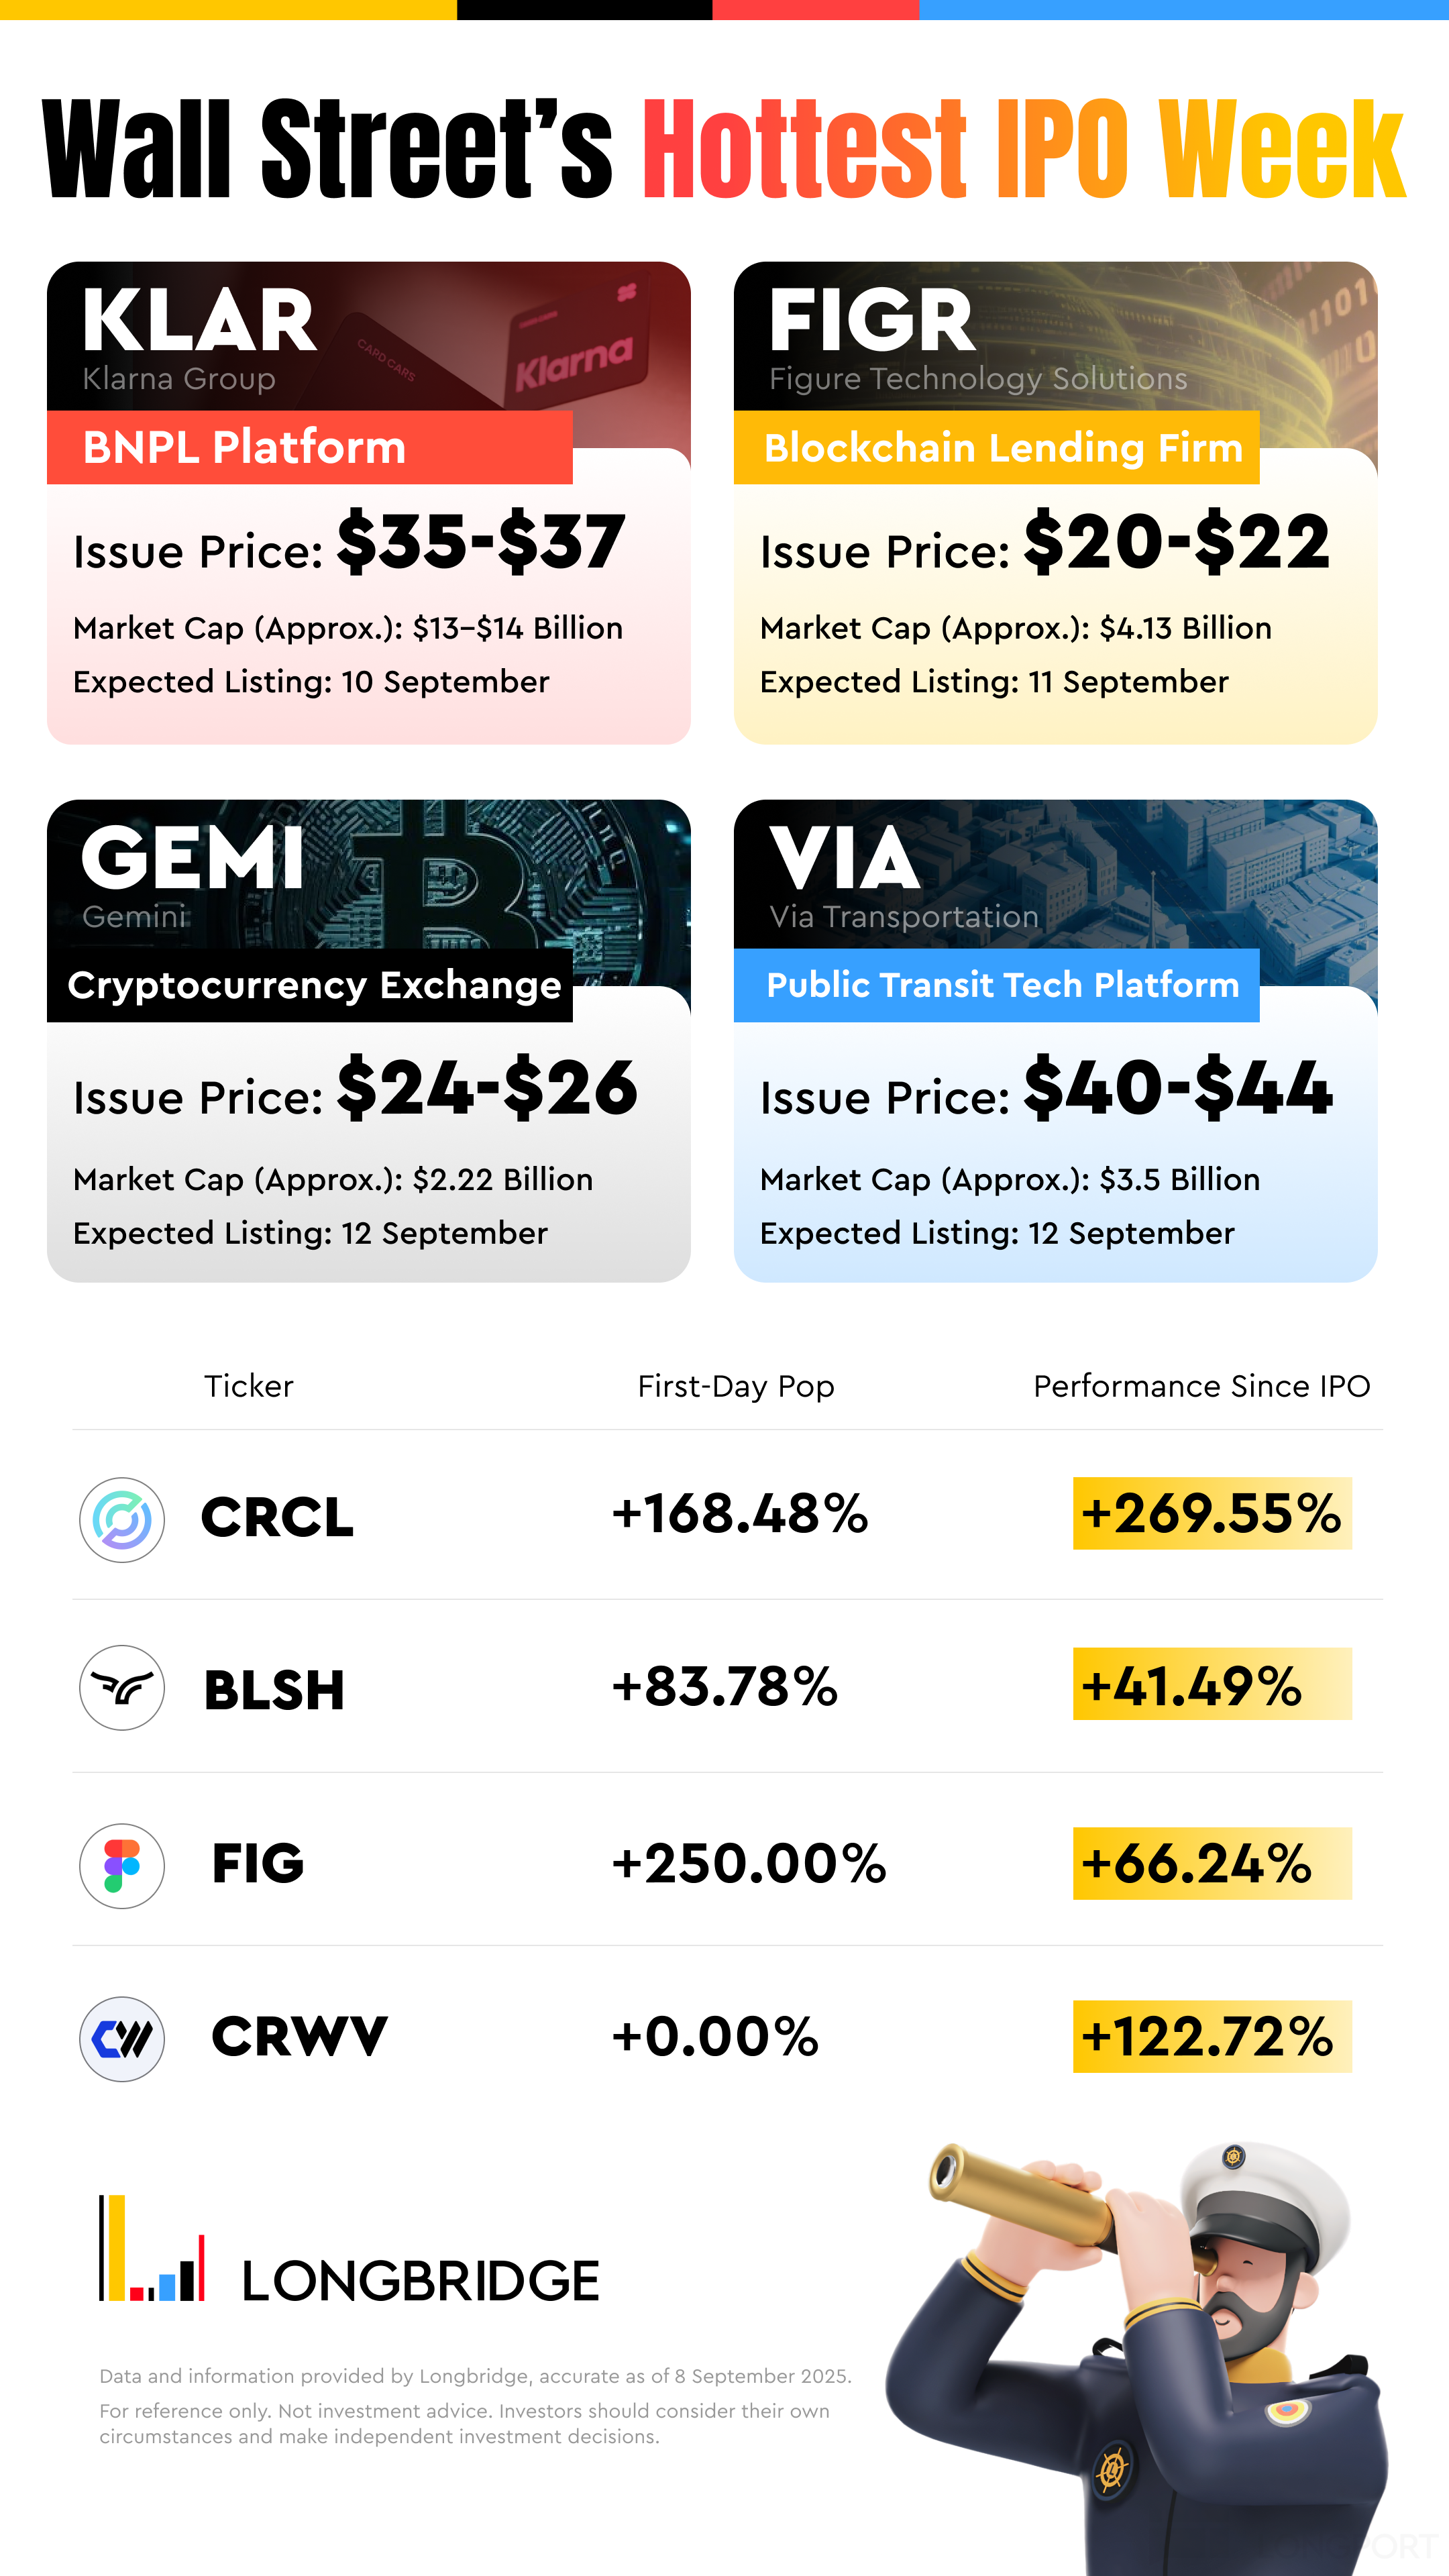
US stocks welcome the hottest IPO week of the year! The largest Fintech IPO Klarna, crypto giants Gemini and Figure are about to land.
Cryptocurrency exchange Gemini, blockchain lending institution Figure, and "buy now, pay later" giant Klarna have successively initiated IPO processes, ushering in a window period for listings in the ...