
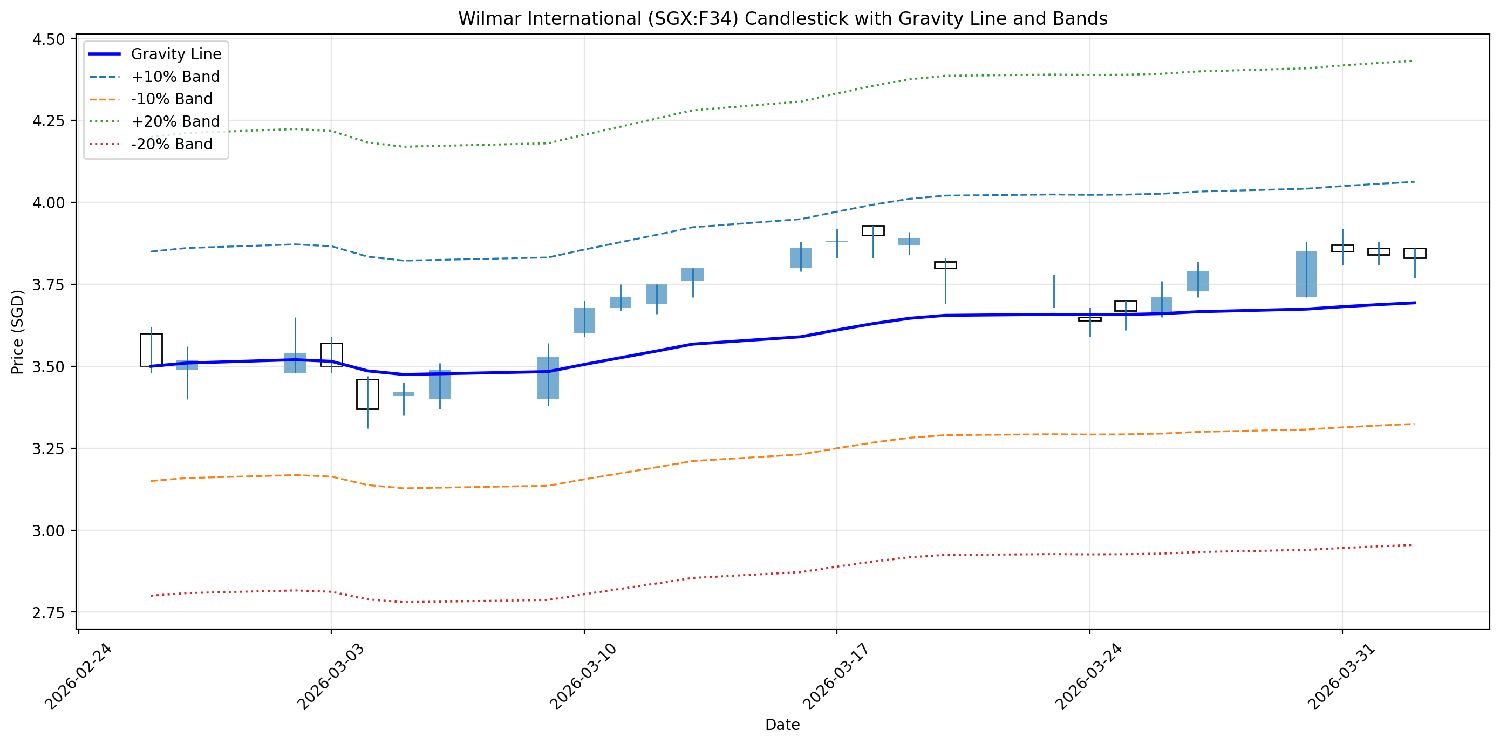
Day 12 - $Wilmar(F34.SG)
On the chart I generated, the gravity line is 3.71, so the stock is still about 2.75% above gravity. The derived bands on the latest bar are +10% at 4.08, +20% at 4.45, -10% at 3.34, and -20% at 2.97. In my view, that places the stock in a mildly constructive position rather than a stretched one: it is above its equilibrium line, but nowhere near the upper extension zones. That usually argues for “trend intact, momentum cooling” rather than “breakout acceleration.”
The tape also supports that interpretation. Wilmar had pushed up to 3.93 during this recent window, then eased back into the 3.81–3.85 area over the last few sessions. The latest day’s range was 3.77 to 3.86, which tells me short-term buyers are still present, but they are no longer pressing price higher with the same force seen in mid-March
From a positioning standpoint, I would frame 3.71 as the key mean-reversion reference. As long as price holds above that level, I would still classify Wilmar as trading on the strong side of balance. A decisive move back toward the gravity line would suggest consolidation is deepening; a renewed push through the recent 3.88–3.93 zone would be the cleaner signal that upside momentum is reasserting itsel
The copyright of this article belongs to the original author/organization.
The views expressed herein are solely those of the author and do not reflect the stance of the platform. The content is intended for investment reference purposes only and shall not be considered as investment advice. Please contact us if you have any questions or suggestions regarding the content services provided by the platform.
