
$NVIDIA(NVDA.US) Friday's systemic factors (a sharp rise in U.S. Treasury bond yields) led to significant declines in many technology stocks. $NVIDIA(NVDA.US)'s stock price fell 4.42% in a single day. It's impossible to say such a drop had no impact at all; from the data, we can see its effect on bullish confidence.
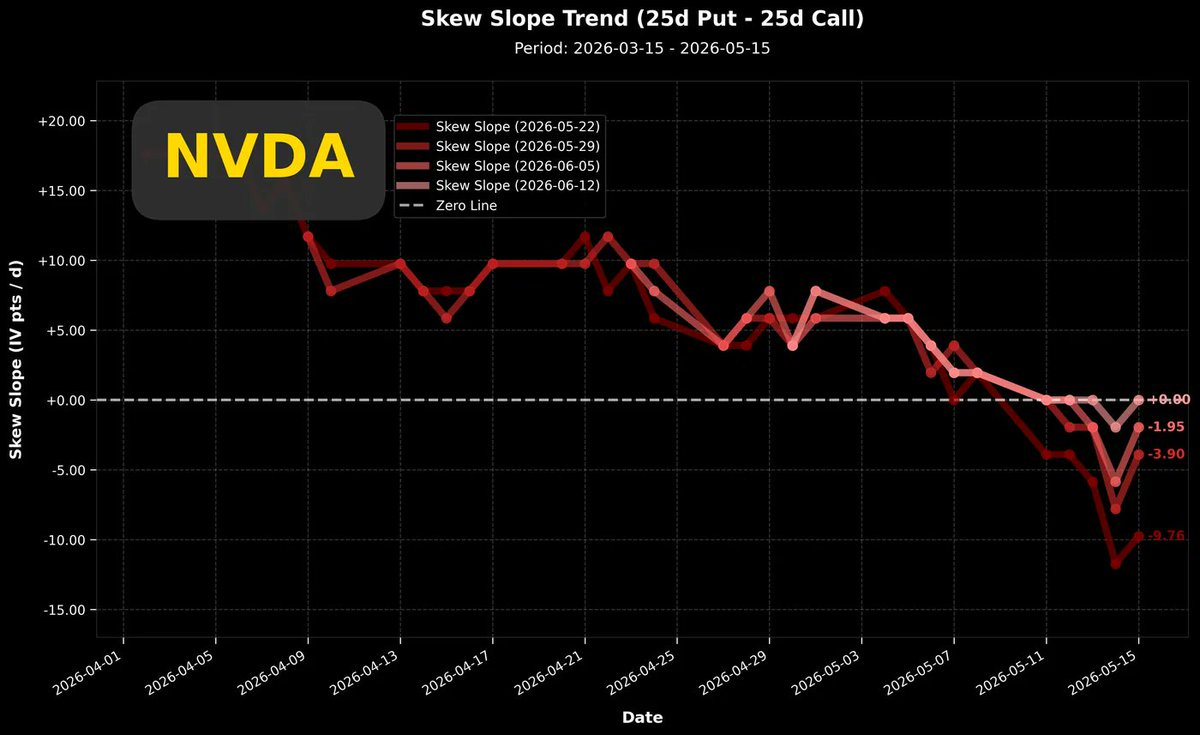
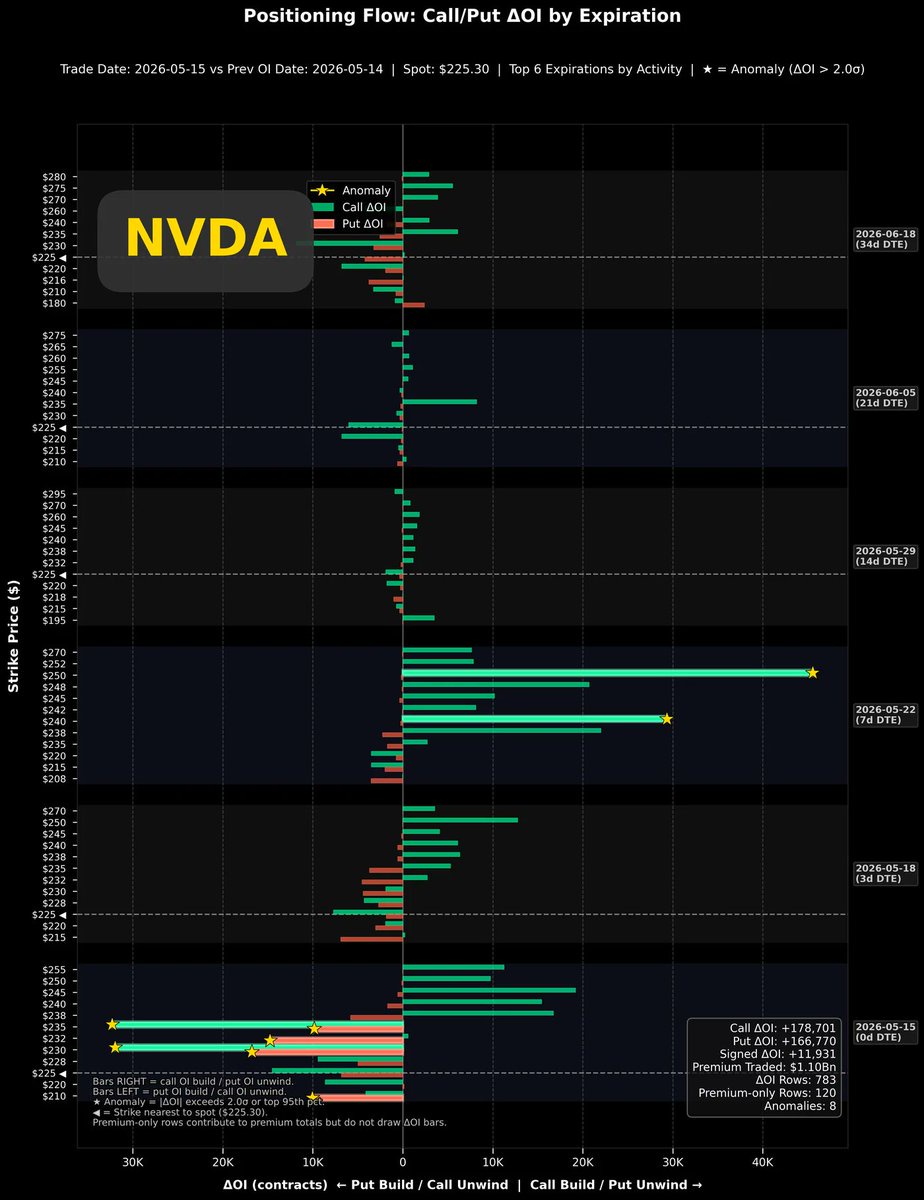
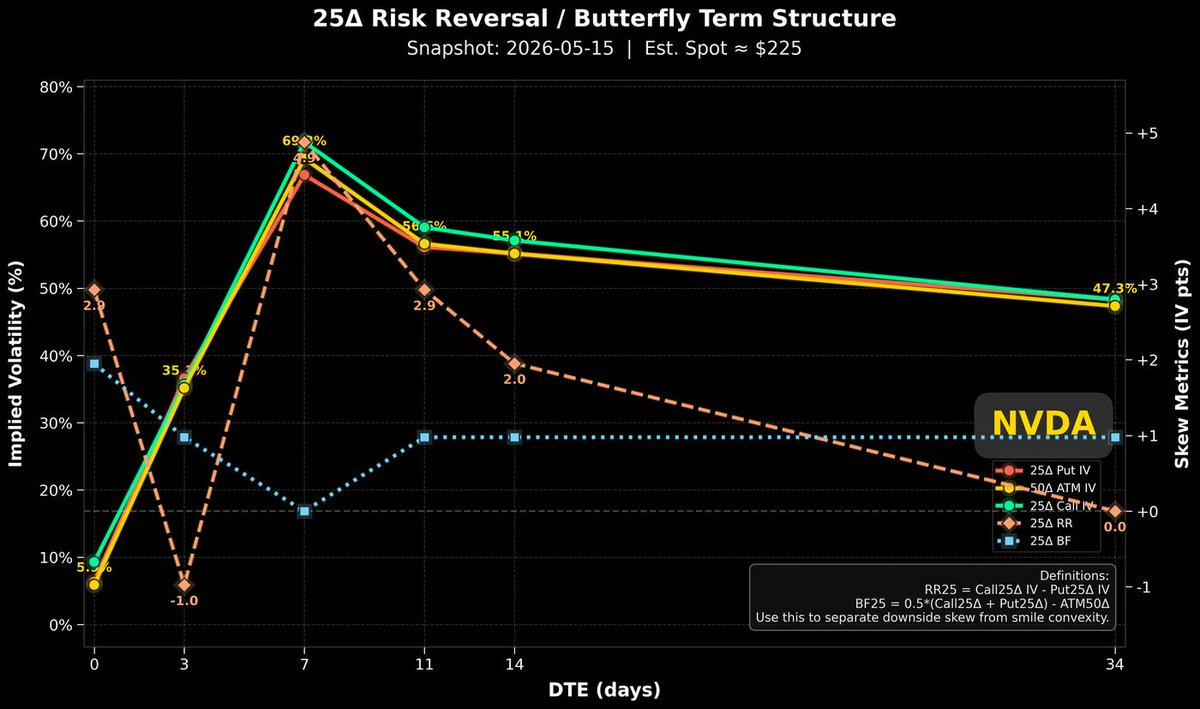
The top-right chart shows the recent trend of the Put/Call volatility difference. This chart reveals that during Friday's trading, the volatility difference clearly turned and moved closer to the zero line.I don't believe this will become a trend; it will only be a local fluctuation. Observing this chart, you can see that since early April, the $NVIDIA(NVDA.US) volatility difference has maintained a state of continuous tilt towards call options. Such a trend is not easily reversed.Now look at the bottom-left chart; let's see what the actual operations of options traders were in Friday's single trading day.In the bottom-left chart, we can see over 60,000 options contracts actively closed their positions before the close ahead of the 05/15 expiration. Where did these 60,000+ contracts go?Looking at the options expiring on 05/22, there are over 70,000 new positions added. Combined with only limited fluctuations in implied volatility, we have reason to believe that earlier bullish investors are taking their current profits (from 05/15 options) and continuing to bet on a rise during the earnings week.Looking at all options expiring within a month, no significant new short positions are visible.Currently, for options expiring next Friday (dte=7), implied volatility has reached 69.9%, and call options are dominant (bottom-right chart).Finally, we must pay attention to the pattern of the cumulative position distribution chart for options expiring next Friday. The top-left chart shows the current max pain price at $205, while the current stock price has already risen to $225. My previous tutorial on the max pain price reminded that the max pain price is determined by the distribution of in-the-money option positions. If you look at the red bars to the right of the vertical green dotted line and the green bars to the left, you will notice the disparity in position size. Whether the current max pain price can move now is entirely determined by the positions of the call options on the left side. Someone needs to close their positions and exit, or the stock price needs to fall to shorten the gap between the two prices.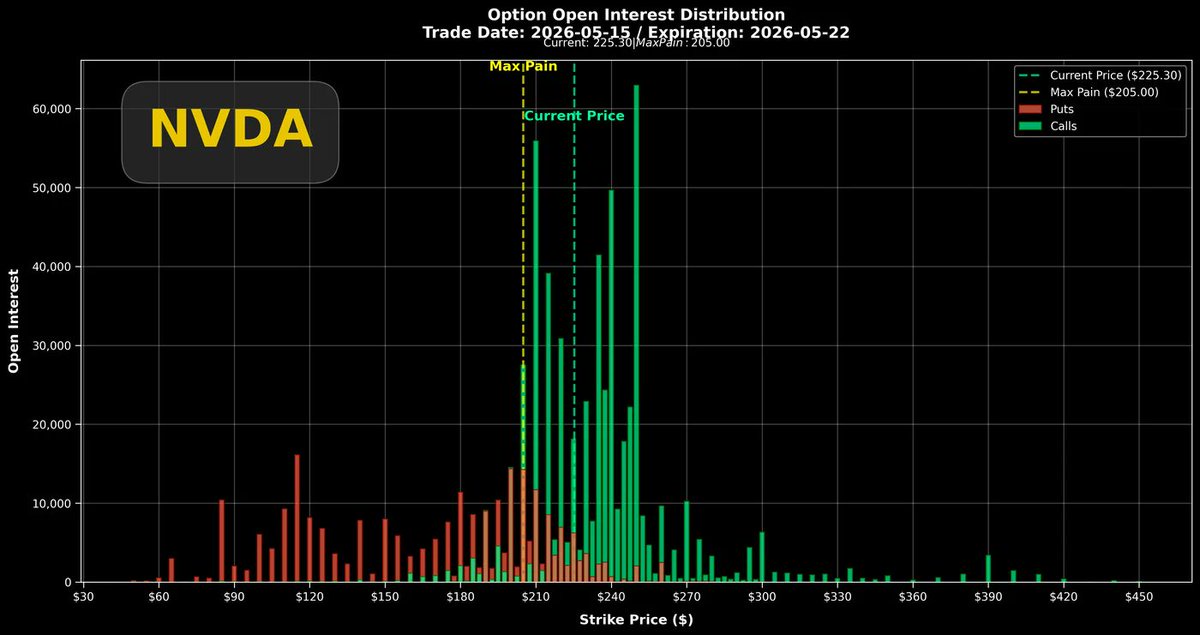
The copyright of this article belongs to the original author/organization.
The views expressed herein are solely those of the author and do not reflect the stance of the platform. The content is intended for investment reference purposes only and shall not be considered as investment advice. Please contact us if you have any questions or suggestions regarding the content services provided by the platform.
Post your comment

No Comments