
$AMD(AMD.US) (Advanced Micro Devices) suddenly dropped 10.86% last Friday. Does such a significant single-day decline create any particular pattern in the options trading data?
I'll state the conclusion first: the existing structure remains unchanged.
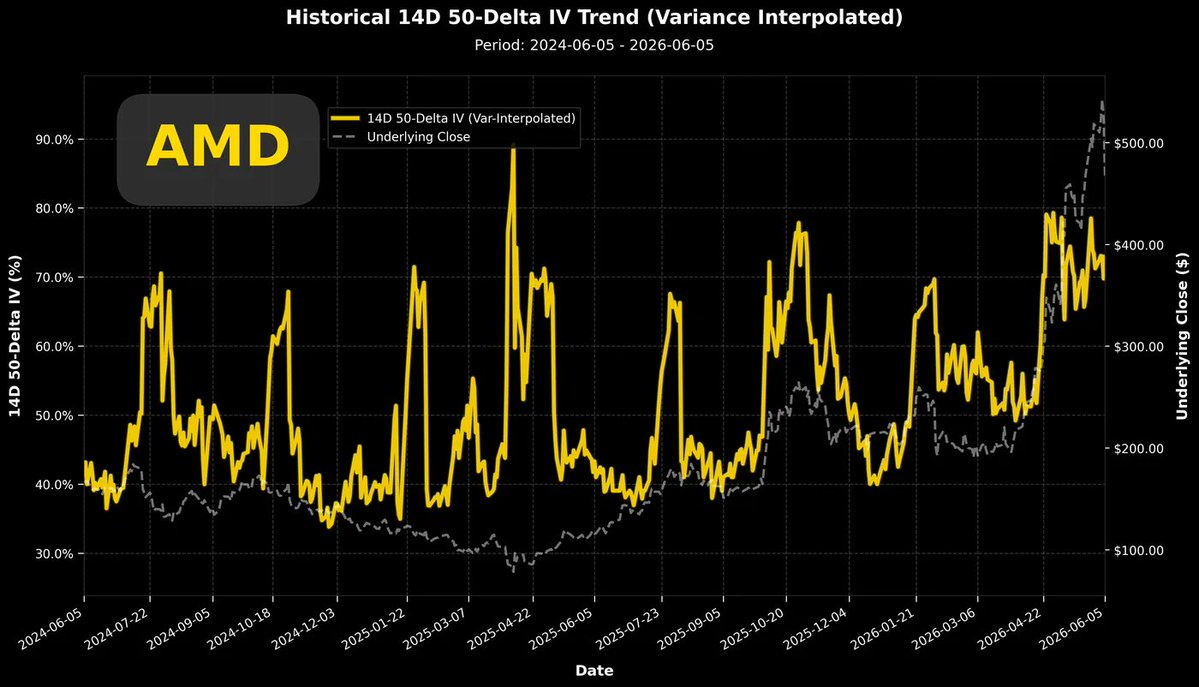
The top-left chart shows the two-year overall implied volatility. This chart indicates that after the last earnings report, the baseline level of implied volatility was elevated by one notch and did not fall back to the pre-earnings baseline. Post-earnings, the trading sentiment entered a new atmosphere (or narrative).
Following last Friday's sharp decline, the current volatility level is still fluctuating within the range of the new baseline.
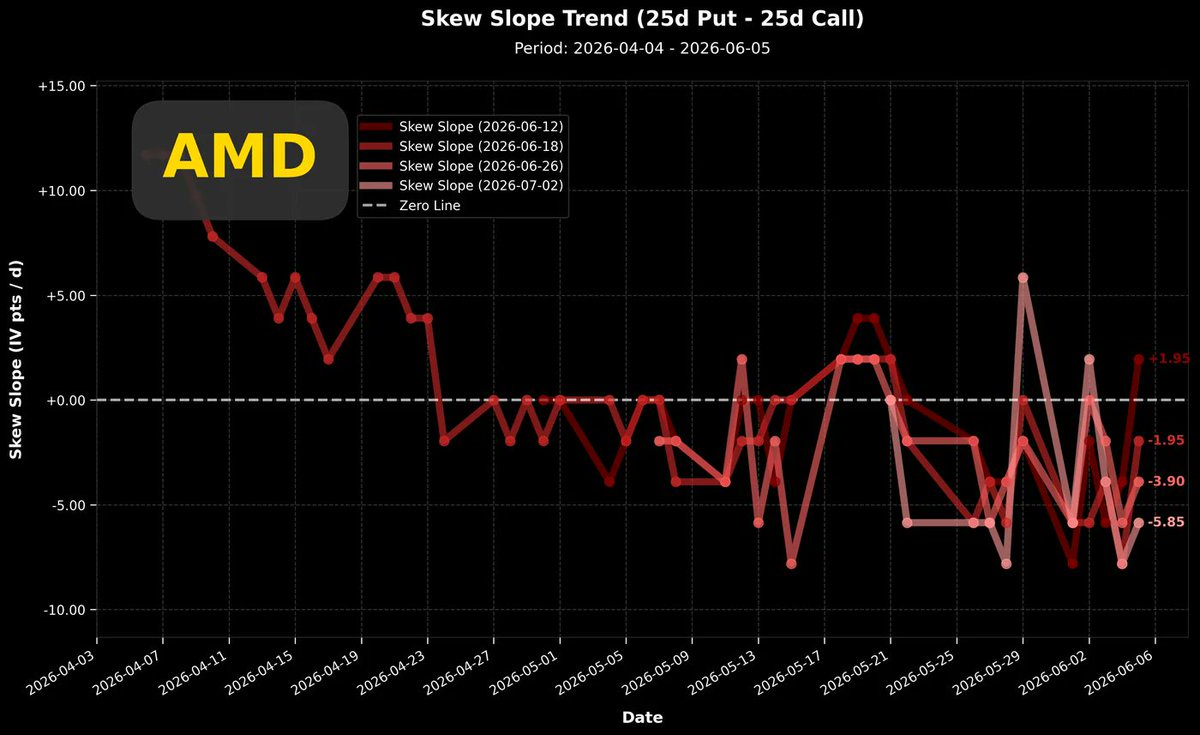
The top-right chart shows the recent Put/Call volatility spread. After last Friday's drop, the volatility spread jumped upwards, but the magnitude of the jump is not large and remains within the typical fluctuation range.
After Friday's decline, neither the volatility level nor the volatility spread has shown a new pattern. It seems the current stock price movement is still considered a 'normal energy release' for $AMD(AMD.US) by market participants.
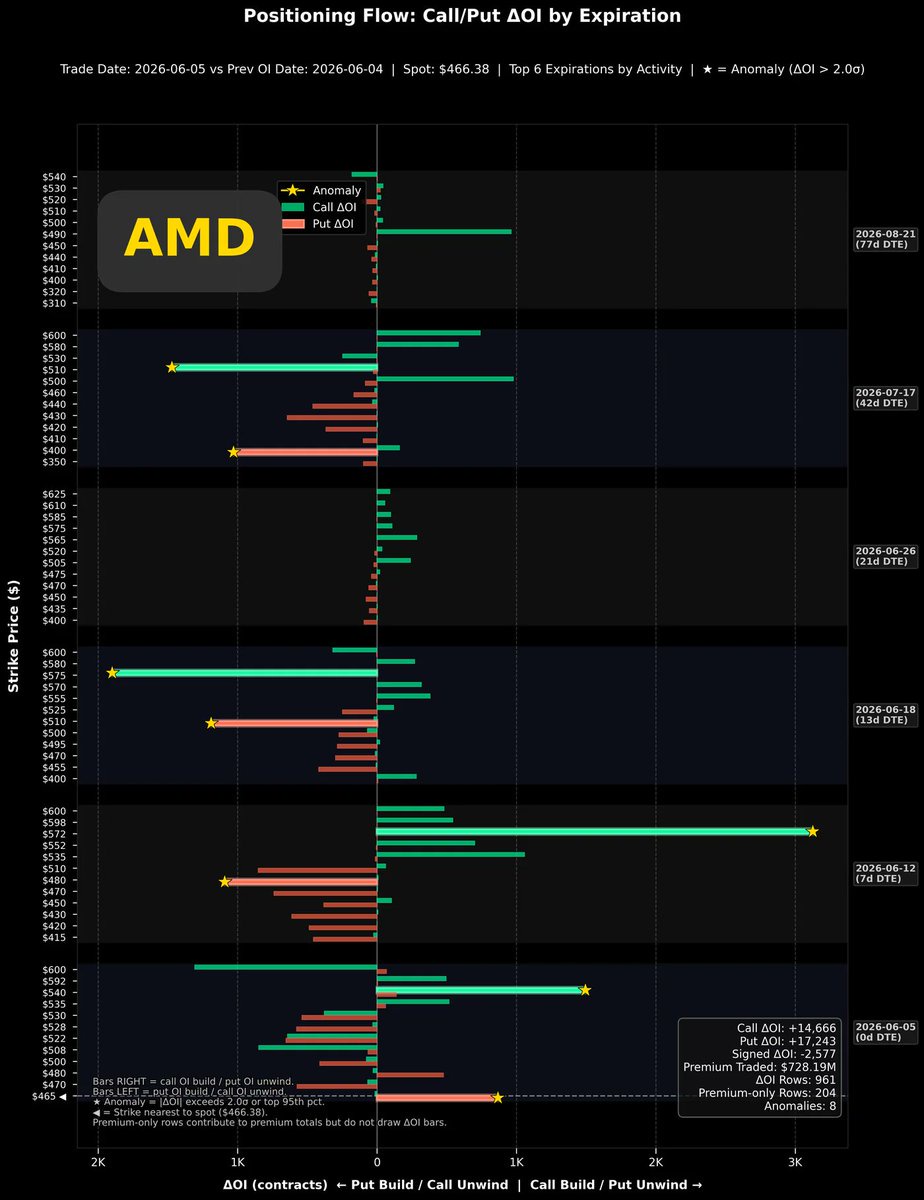
The bottom-left chart shows the single-day position change. It reveals some long positions closing out, but more notably, put options were opened across a wide range of strike prices. These trades aren't clearly about who is exiting or entering, as under these general position changes, the volatility spread change is minimal, only shifting slightly towards puts, with no clear directional bias emerging.
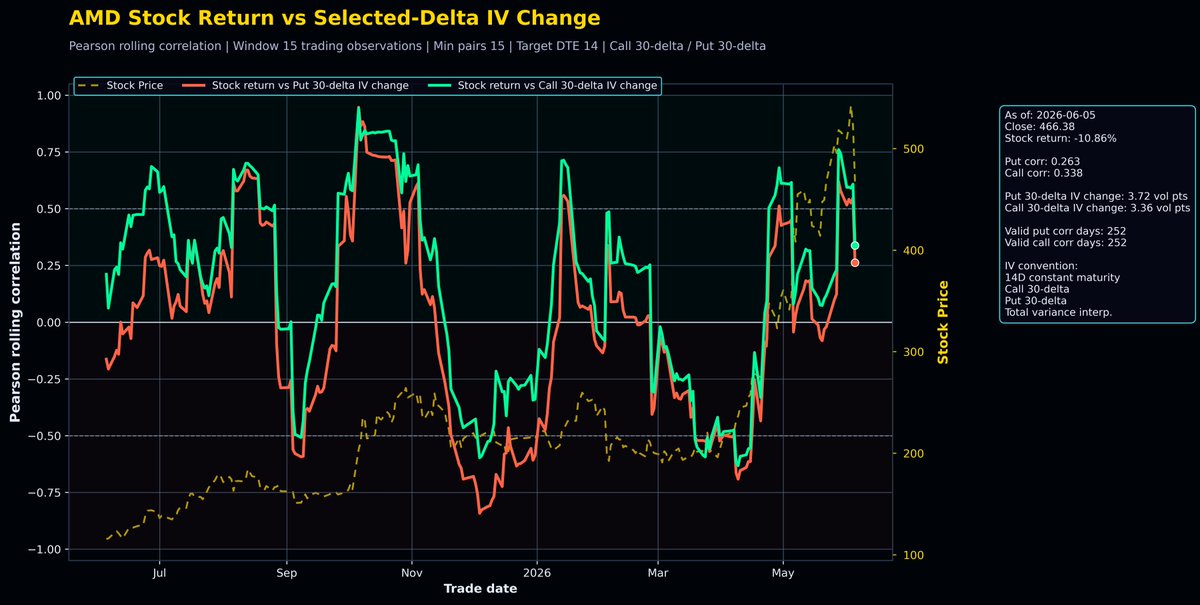
The bottom-right chart shows the correlation coefficient between stock price returns and volatility. Last Friday's drop also caused the correlation coefficient to fall from a positive correlation above 0.5. It would be more reassuring if it could touch zero, because after May, there was a local stock price low point, which was accompanied by the correlation coefficient briefly touching zero. If it doesn't even touch zero, it doesn't resemble a complete stock price pullback pattern.
Summary: While $AMD(AMD.US)'s stock price is pulling back, volatility hasn't changed much. Position changes show increased buying interest in puts and some call options being closed out, but these are not significant. The structure presented by the options trading data remains the same as before the sharp price drop. According to correlation analysis, it is indeed in a consolidation phase of the price pullback. If the subsequent correlation coefficient can drop to negative or at least touch zero, then we can start watching for the potential emergence of a local bottom in the stock price.
The copyright of this article belongs to the original author/organization.
The views expressed herein are solely those of the author and do not reflect the stance of the platform. The content is intended for investment reference purposes only and shall not be considered as investment advice. Please contact us if you have any questions or suggestions regarding the content services provided by the platform.
