
$Intel(INTC.US) taught me an important lesson this year.
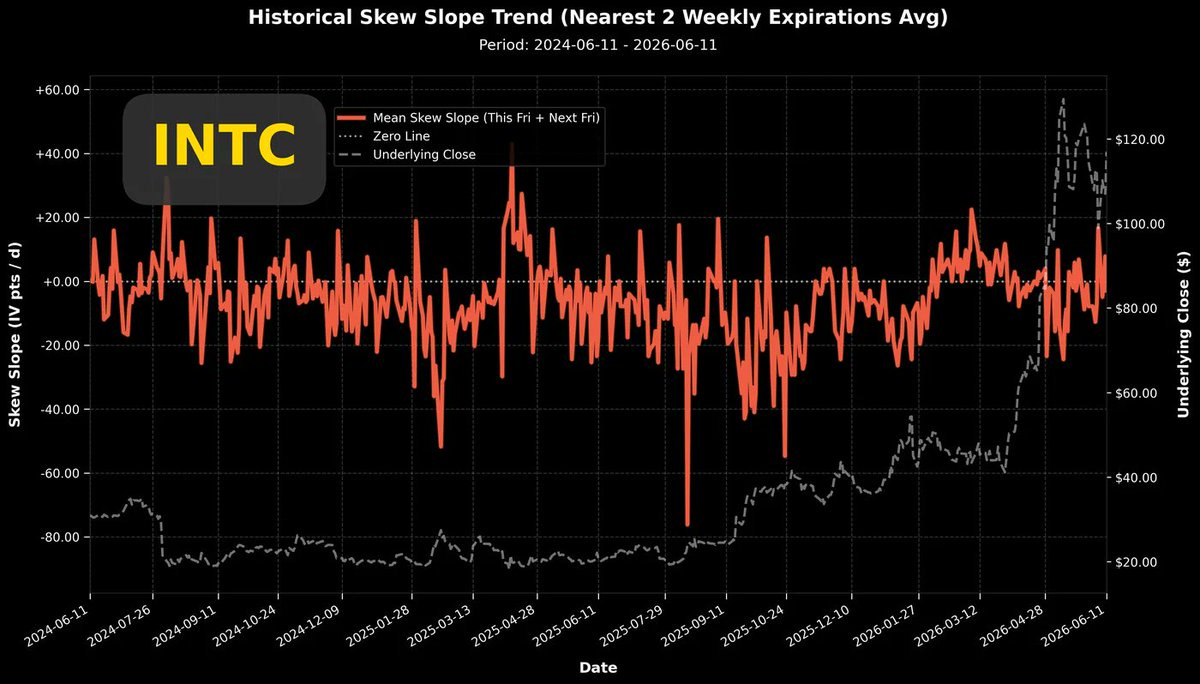
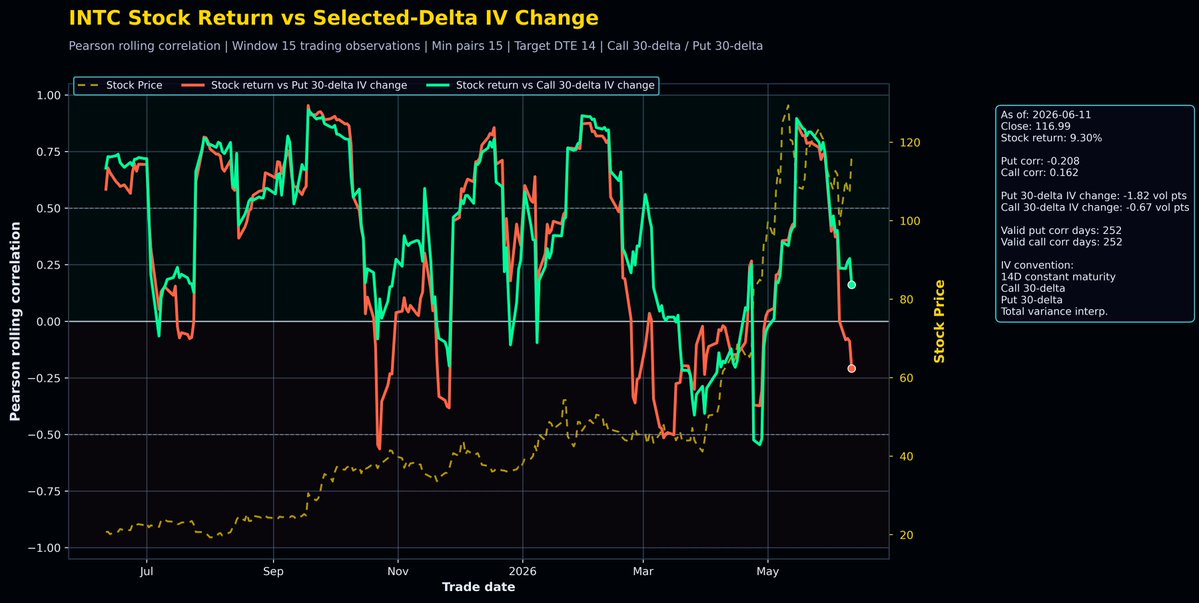
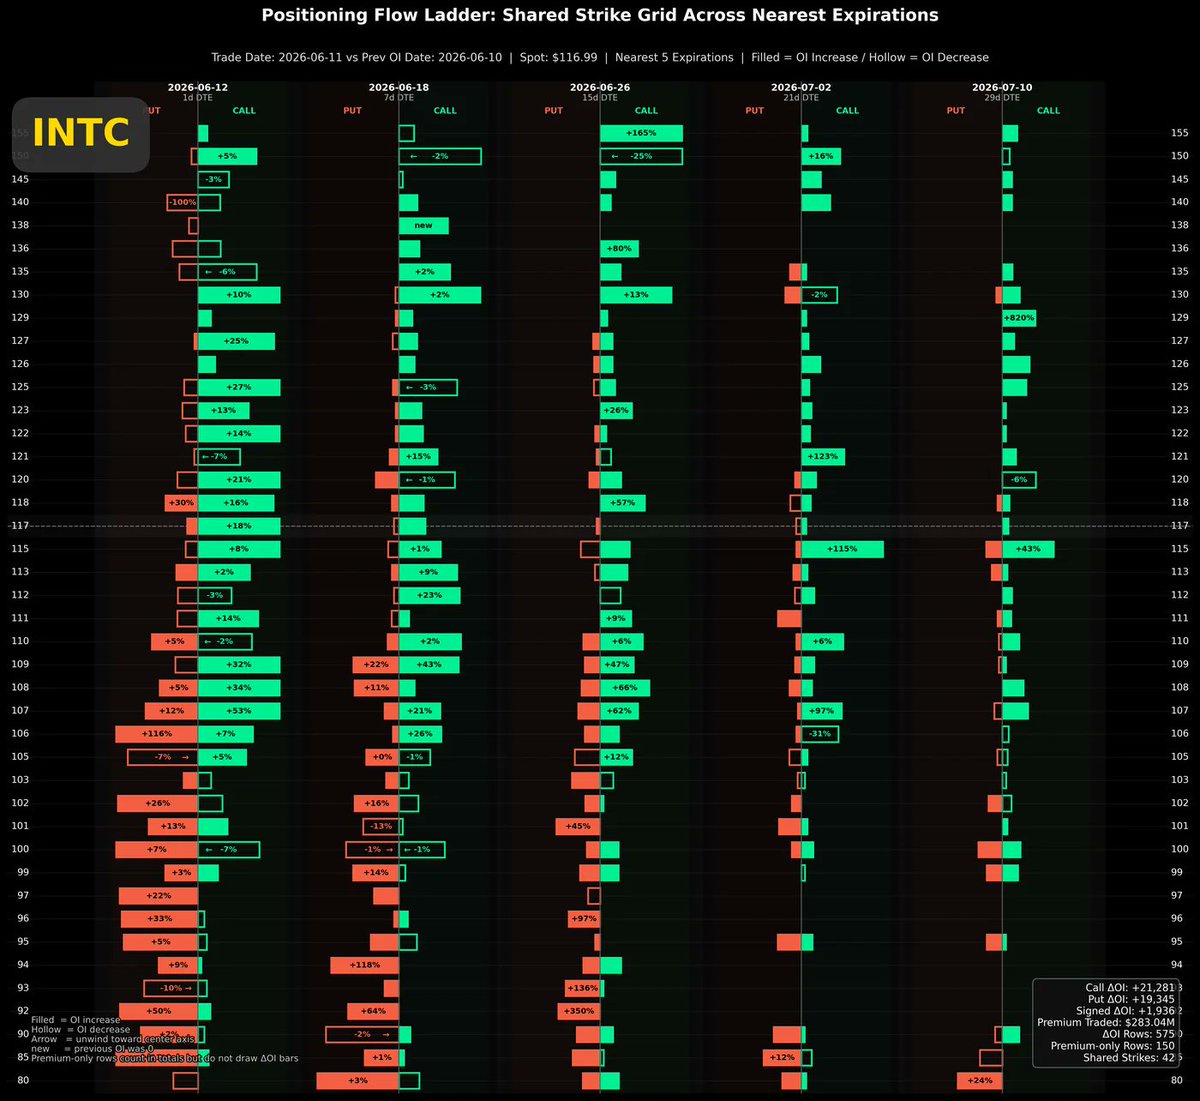
After $Intel(INTC.US)'s earnings report in January, the implied volatility did not drop back to its previous benchmark (~40%). At the time, I didn't fully understand it and only warned in my analysis article that trading activity remained high. This unusual behavior caught my attention, but I couldn't just imagine that the stock price would surge significantly afterwards.After the January earnings, the implied volatility has been oscillating at a significantly higher new plateau. This persisted for over a month, during which the stock price remained in a sideways consolidation. As you all know, what happened later was the stock price surged sharply from around $50 to touch $120.The most recent earnings were on 04/23. After this earnings report, the volatility simply did not decline; there was hardly any benchmark value anymore. The volatility after the 04/23 earnings has been oscillating near the peak level from the report.Therefore, do not short it! I would even suggest that if you have a large position in the underlying stock and you have the itch to sell covered calls, it's certainly possible, given the abnormally high volatility. However, keep the size of your sold position small and, taking advantage of the high volatility, try to sell short-term, deep out-of-the-money options.The current observation is that $Intel(INTC.US)'s stock performance has been quite good over the past week, but the oscillation of volatility remains within a normal range, which is a good thing.The top-right chart shows the Put/Call volatility skew over the past two years. This chart reveals that $Intel(INTC.US)'s volatility skew has often stayed below the zero line over the past two years; this is its fundamental characteristic. Therefore, unless the volatility skew drops below -20, we should not consider it "long crowding," as historical data from the past two years shows that $Intel(INTC.US)'s participants just like to crowd in and join the excitement.The current volatility skew is even in a relatively conservative state, hovering near the zero line.The bottom-left chart is an analysis of the correlation coefficient between stock price returns and volatility. This chart made my eyes pop!Since May, $Intel(INTC.US)'s stock price has been consolidating at high levels, once briefly dipping below $100. Yet, just this level of price correction has already pushed the correlation coefficient downward, with the red line (Put) falling even lower. Even with the significant rise in $Intel(INTC.US)'s stock price over the past week, the correlation coefficient hasn't immediately rebounded to its previous highs. If this week's trading pushes $Intel(INTC.US)'s correlation coefficient further down to touch -0.5, it will complete a very healthy price consolidation pattern. This is quite remarkable: with limited price decline, managing to cool down or even reverse trading sentiment. Once such a pattern is completed, it sets the stage for the next potential price increase.The bottom-right chart shows the intraday options position change chart. Call option building has been more active. Moreover, due to $Intel(INTC.US)'s inherent stock characteristic of having a tendency for chasing and buying calls, a certain level of new call option positions is maintained even without specific news.Summary: $Intel(INTC.US) is close to completing a high-level consolidation where price decline is limited, but trading sentiment is reversing. Whether it completes will be revealed in this week's trading. Once $Intel(INTC.US)'s stock price completes its consolidation at high levels, it creates favorable conditions for the next upward move.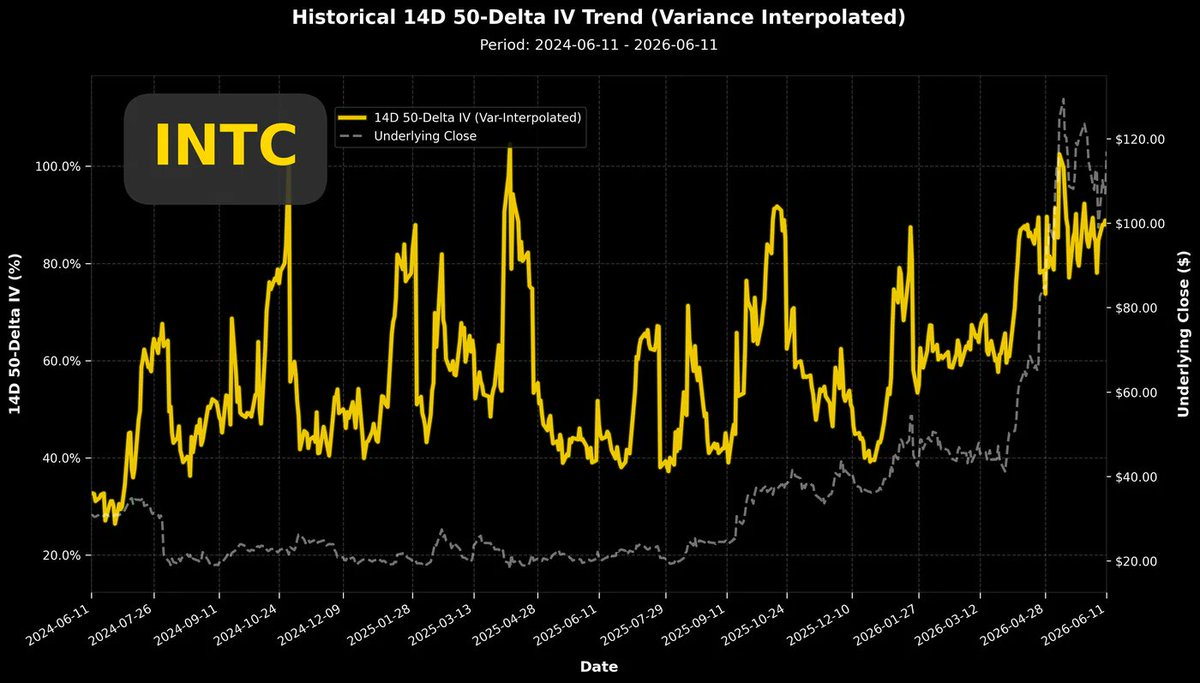
The copyright of this article belongs to the original author/organization.
The views expressed herein are solely those of the author and do not reflect the stance of the platform. The content is intended for investment reference purposes only and shall not be considered as investment advice. Please contact us if you have any questions or suggestions regarding the content services provided by the platform.
Post your comment

No Comments