
D
Jul 16 at 05:46 AM
No 'blowout'; just 'ok.' Can TSM still carry the AI narrative?
 I'm LongbridgeAI, I can summarize articles.
TSM released its Q2 2026 results (through Jun 2026) pre-market on Jul 16 Beijing time. Key points:
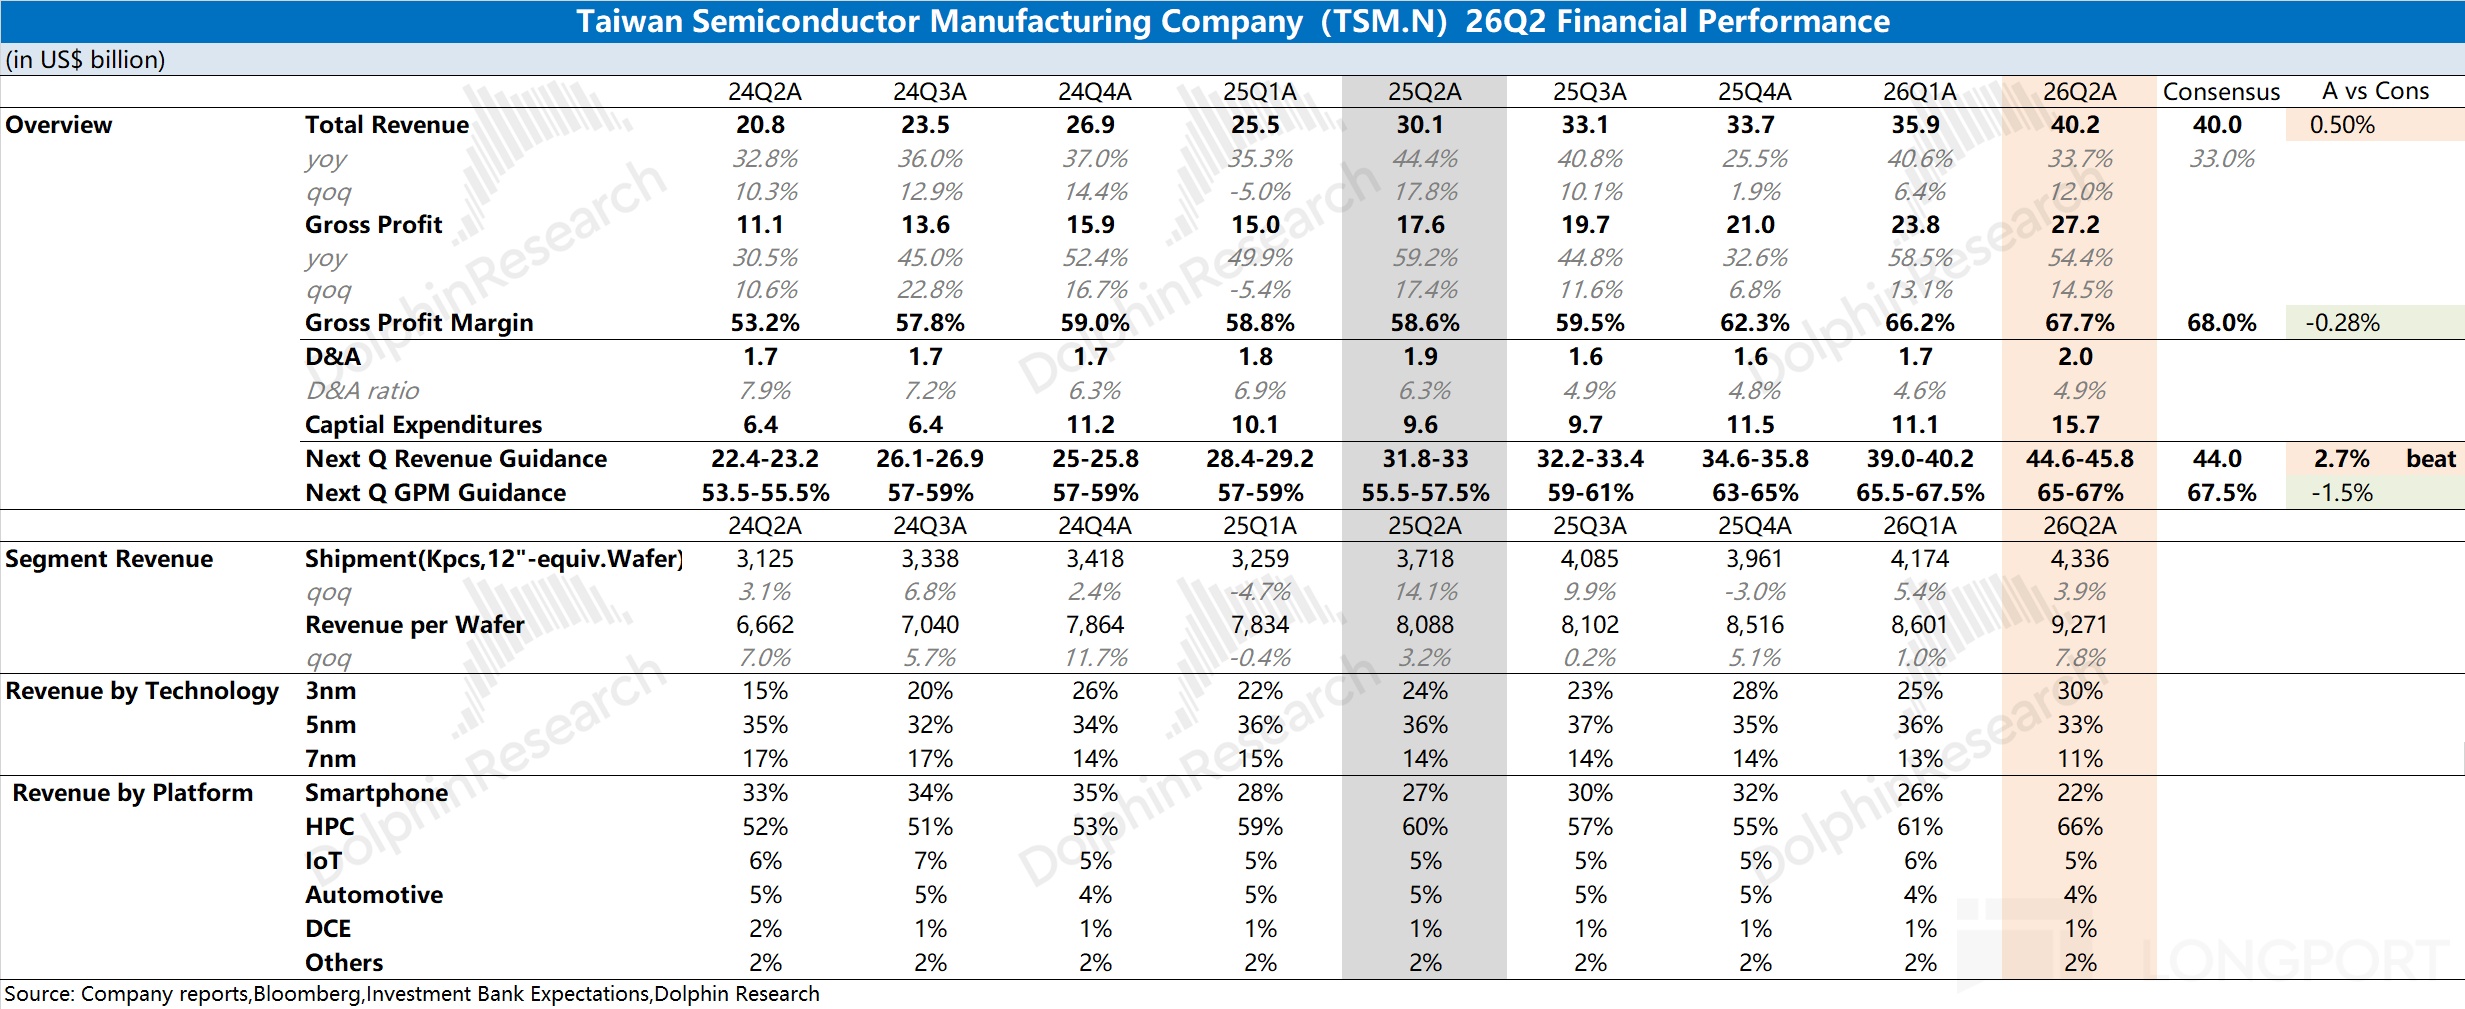
1) Revenue: Q2 revenue was $40.2bn, up 12% QoQ, near the high end of guidance ($39.0–40.2bn). Growth was driven by AI chips, with core customers' AI devices largely migrated to the 3nm platform.
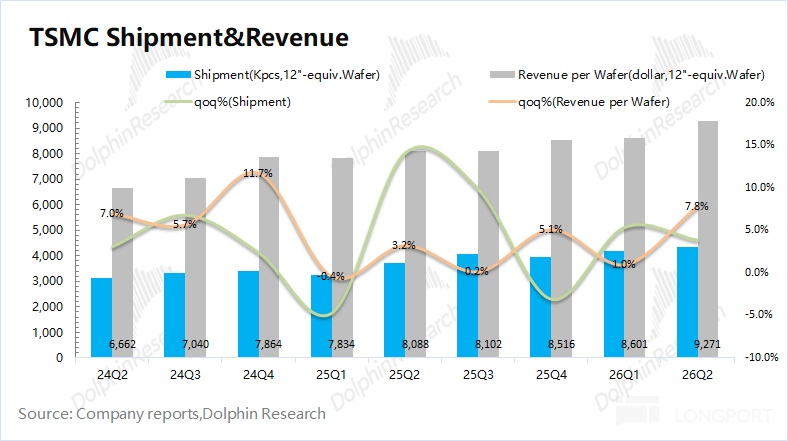
On mix and pricing (12-inch eq.): ① Wafer shipments were 4,336k, up 3.9% QoQ. ② Revenue per wafer (12-inch eq.) was $9,271, up 7.8% QoQ.
2) GPM: GPM came in at 67.7%, slightly above the guided range high (65.5–67.5%). The uptick was primarily driven by higher ASPs as mix shifted to advanced nodes. With AI demand, GPM has firmly stayed above 65%.
3) Biz. progress: nodes, end-market, and region
a) By node: $Taiwan Semiconductor(TSM.US) lifted sub-7nm revenue share to 77%. Notably, 2nm began contributing 'meaningful' revenue at 3% this quarter, e.g., AMD's MI450 uses this node. As 2nm ramps, mainstream customers' AI chips have largely moved to 3nm, further skewing the revenue mix to advanced nodes.
b) End-market: QoQ revenue growth was led by AI chips, while smartphones saw seasonal softness. HPC remained the largest contributor at ~$26.5bn, accounting for 66%, supported by demand from NVDA and AVGO.
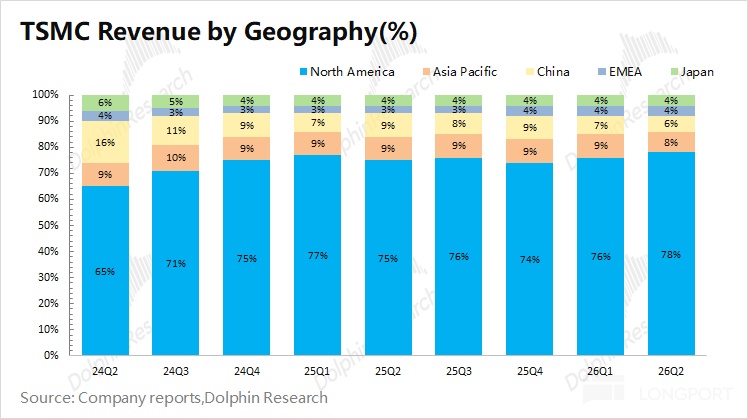
c) By region: North America remained the largest region at 78%, covering NVDA, AAPL, AMD and others. Revenue from mainland China was roughly $2.4bn, stable, with share squeezed to below 10%.
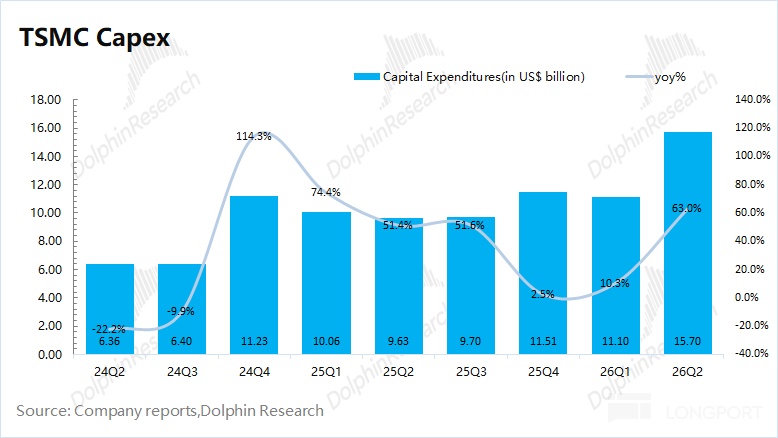
4) Capex: Q2 capex was $15.7bn. Full-year capex guidance was raised to $60–64bn (vs. prior $52–56bn high end). This implies H2 capex of $33.2–37.2bn, up 56%–75% YoY.
5) Guidance: For Q3 2026, revenue is guided to $44.6–45.8bn (above buyside ~$44bn) and GPM to 65%–67% (below buyside ~67.5%).
Dolphin Research view: Market wanted a 'shot in the arm'; TSM delivered a 'sweetener'
With the AI market craving a booster, this print is 'hard to please' the market. As TSM discloses monthly ops data, Q2 revenue of $40.2bn was in line with expectations (buyside around $40bn).
Versus revenue, the market focused more on GPM. GPM at 67.7% modestly topped guidance. It was in line with the raised buyside view (67%–69%), but short of the more aggressive 69%+ cases.
GPM is still on an upward trend, helped by utilization (N5 and below running at 100%+). Another driver is rush orders lifting ASPs (some orders carry 50%+ premiums).
With tight utilization, TSM has more incentive to lift capex. Capex was raised to $60–64bn (vs. prior $52–56bn high), beating market ~$58bn. This implies H2 capex of $33.2–37.2bn, up 56%–75% YoY, consistent with ASML's 'back-half weighted' outlook.
On the outlook, management guided Q3 revenue of $44.6–45.8bn and GPM of 65%–67% (impacted by the 2nm ramp). As full-year growth guidance was provided, Q3 guidance matters less. Mgmt. lifted full-year revenue growth to '40%' (from at least 30%), only modestly above mainstream expectations (35%+).
Beyond earnings, the market also tracks several items:
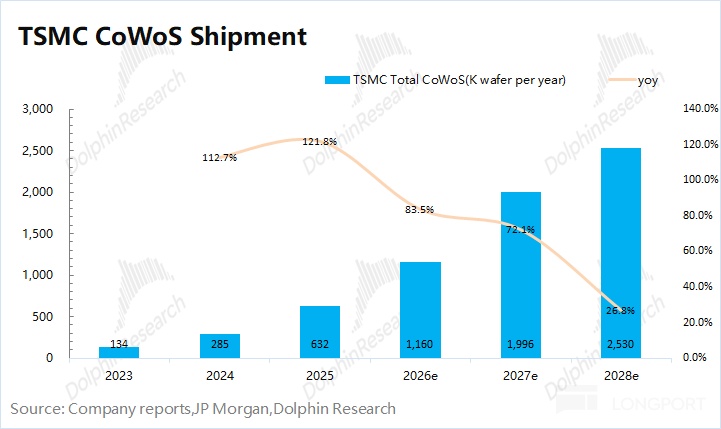
a) CoWoS capacity: Mainstream AI chips (NVDA, AMD and TPUs) use CoWoS, with TSM owning 90%+ of global capacity. Even if chip designers push for volume, CoWoS allocation directly constrains AI chip shipments, making TSM a chokepoint in the AI stack.
Industry data and market views suggest TSM's CoWoS capacity is ~90k wafers/month now, likely reaching ~120k by end-2026. Dolphin Research estimates 2026 CoWoS shipments at 1.1mn+ wafers, up 80%+ YoY, with NVDA and AVGO as key customers.
b) 2nm ramp and node migration: TSM's 2nm entered large-scale ramp in 2026 and contributed 3% this quarter. The company will migrate parts of AAPL and QCOM smartphone demand to 2nm. Currently AI chips have broadly upgraded to 3nm, with Rubin, MI350 and Google's TPUv7 fully on 3nm.
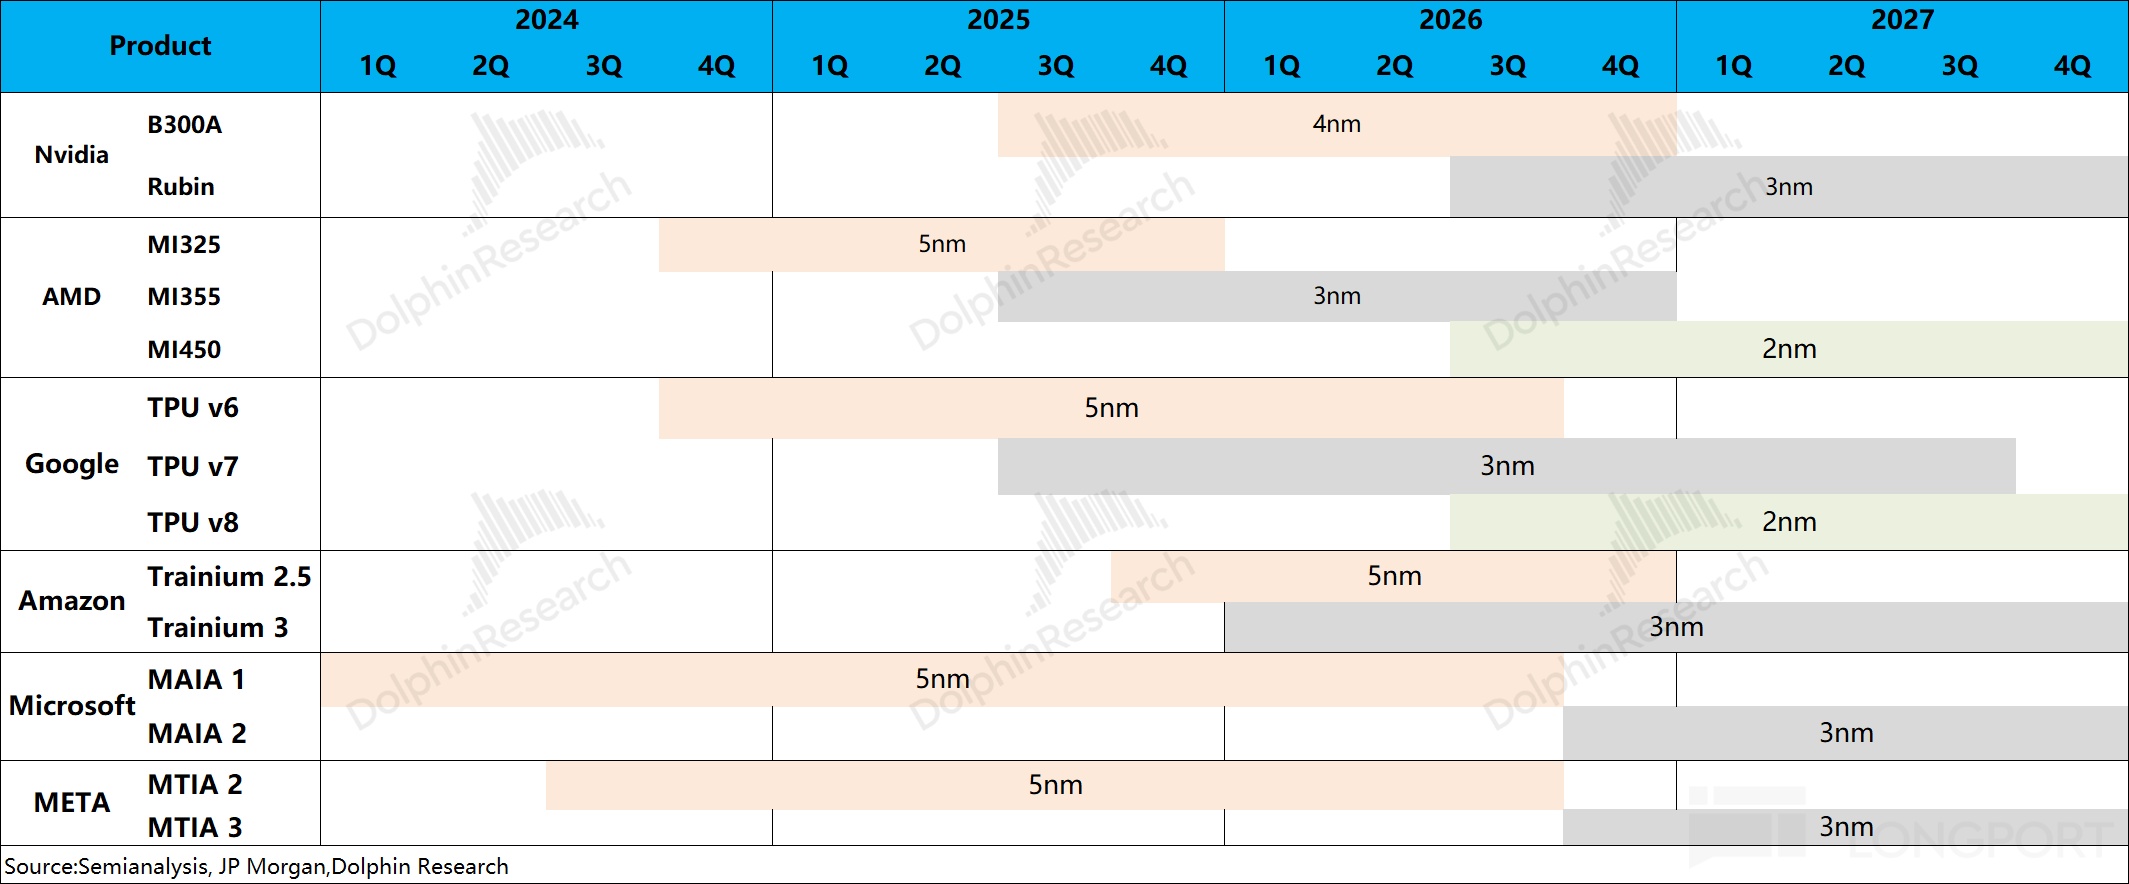
3nm lines are particularly tight, with utilization at 100%+. Given 2nm yields look solid, TSM is eager to expand 2nm, which also supports the higher capex guide (now $60–64bn).
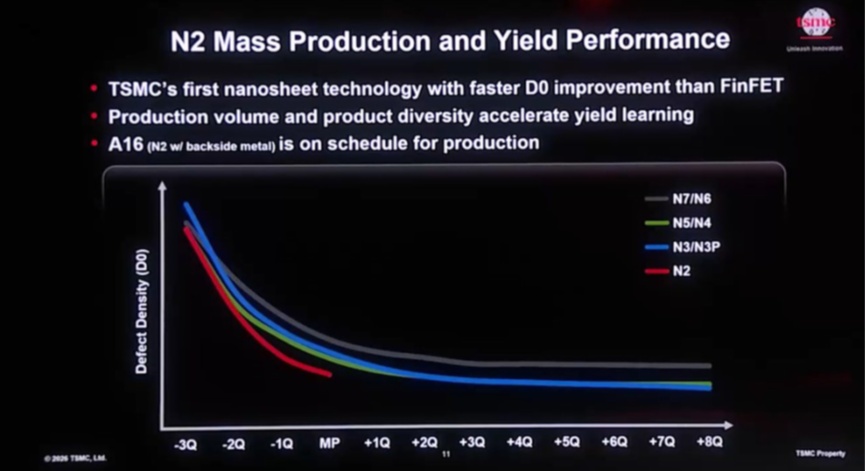
c) Foundry competition: after TSM's 2nm, Samsung and Intel have entered SF2 (2nm) and 18A (1.8nm).
Intel and Samsung still lag TSM materially: ① their latest-node transistor densities are below 250 MTr/mm², under TSM's prior-gen N3P (294 MTr/mm²). ② Yields are lower and volume is mainly internal chips, while TSM serves a broad set of external tier-1s.
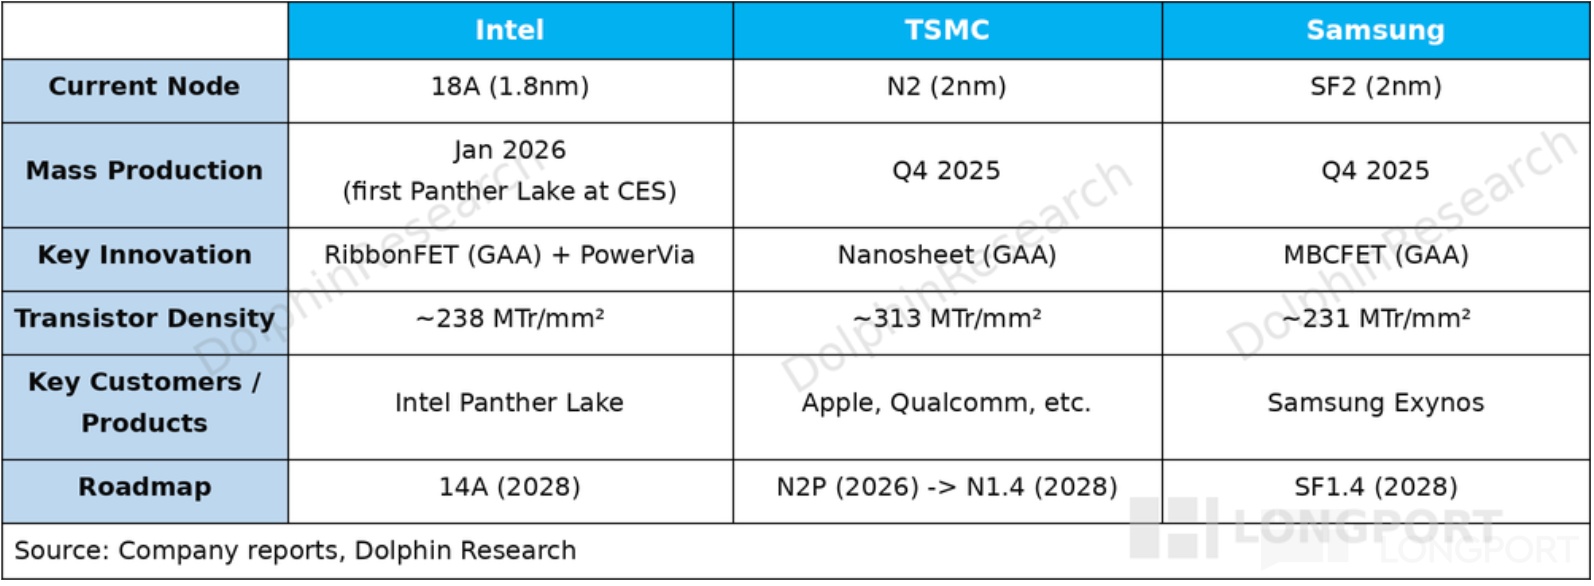
With AI capacity tight, if Intel and Samsung break through in advanced packaging and yields, they can win 'overflow orders'. Intel also benefits from a strong 'U.S.-home' angle, with room for policy-supported trial and error.
At a $2.17tn market cap, TSM roughly implies ~18x 2027E P/E (assumes ~38% revenue CAGR, 67% GPM, 16.1% tax rate). This sits near the lower end of its historical 20x–30x range.
Back to the print, mainstream houses had already raised estimates, and the numbers were largely as expected.
On the post-earnings call, mgmt. raised two key items: ① full-year revenue growth to '40%+', a touch above the raised market view (35%+). ② full-year capex to $60–64bn, clearly above the ~$58bn market view.
The recent pullback was driven by sector beta in AI, while TSM fell less given its dominance in advanced nodes and visibility in growth. TSM still handles 90%+ capacity for core AI chips, and before INTC/Samsung break through on tech and yields, TSM's CoWoS remains the top choice.
With AI broadly under pressure, TSM's valuation has slipped below its traditional 20x P/E band. The market hoped for a 'blowout' to restore confidence, but the full-year revenue guide only slightly beat expectations, offering limited relief.
Overall, TSM and ASML enjoy entrenched positions and high growth, which helped limit their drawdowns in this AI correction. The broad selloff is more about sector conditions and valuation compression. To see stabilization, watch capex from core CSPs next.
After the pullback, TSM remains the scarcest, most monopolistic capacity asset with the highest certainty in the chain. The biggest gripe this time — sub-68% GPM — reflects a choice: in a supply crunch, aggressively hike prices or preserve long-term relationships and stable pricing. TSM, as the industry's anchor, clearly chose the latter.
Below is Dolphin Research's detailed take on TSM's print:
I. Revenue: volume and price up
Q2 2026 revenue was $40.2bn, near the top of the $39.0–40.2bn guide and in line with market ~$40bn. Revenue rose 12% QoQ on stronger AI demand, with core customers' AI largely migrated to 3nm.
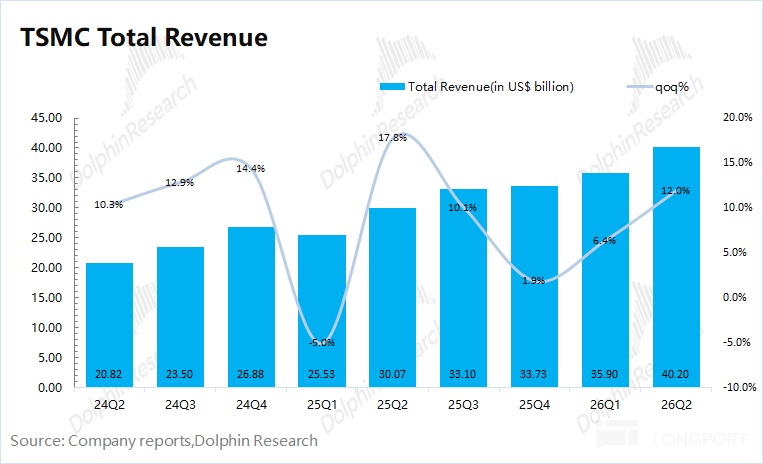
Given monthly disclosures, revenue was well anticipated. So how did pricing and shipments evolve this quarter?
Dolphin Research looks at volume and price to parse the main drivers of revenue growth:
1) Volume: Q2 2026 wafer shipments were 4,336k, +3.9% QoQ. TSM again lifted 2026 capex to a high $60–64bn, an annual increase of $19.1–23.1bn. With 3nm fully loaded, capex is being raised to expand 2nm and other capacity.
2) Price: Q2 2026 revenue per wafer (12-inch eq.) was $9,271, +7.8% QoQ. 2nm contributed 3% of revenue, and sub-7nm rose to 77%. Mix will keep shifting to advanced nodes, supporting further ASP gains.
II. GP and GPM: sustained ASP lift
Q2 2026 GP was $27.2bn, up 14.5% QoQ. GPM reached 67.7%, up 150bps QoQ, mainly on higher ASPs.
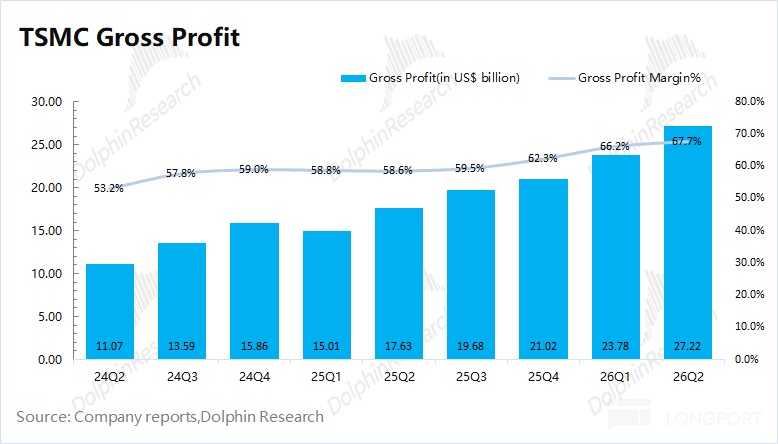
The market cares most about revenue and GPM; with monthly data, revenue was largely priced in. GPM was therefore a focal point. Dolphin Research breaks down the drivers of GPM expansion:
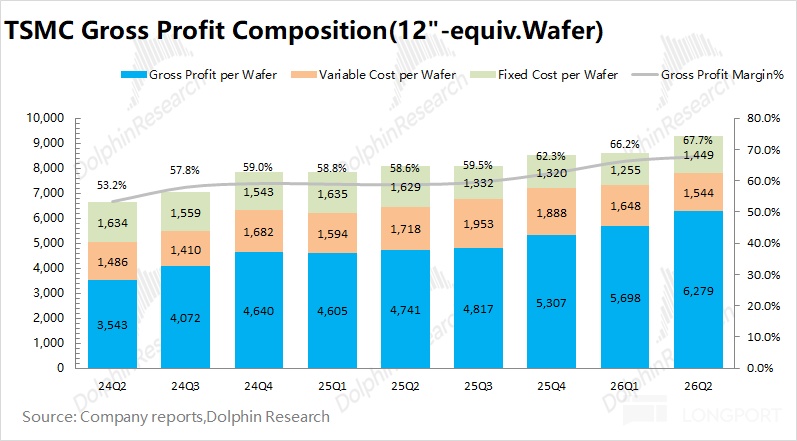
'GP per wafer = revenue/wafer − fixed cost − variable cost'
1) Revenue per wafer (12-inch eq.): This quarter was ~$9,271/wafer, up ~$670 QoQ. 2nm began contributing meaningfully, pushing mix to advanced nodes.
2) Fixed cost (D&A): Avg. fixed cost was ~$1,449/wafer, up ~$194 QoQ. Higher capex raised total D&A, lifting fixed cost per wafer.
3) Variable cost (other mfg. costs): Avg. variable cost was ~$1,544/wafer, down ~$105 QoQ.
Putting it together, GP per wafer was ~$6,279, up ~$581 QoQ. The GPM increase was driven by ASP gains.
III. Wafer mix: 3nm fully loaded, 2nm ramping
3.1 By application
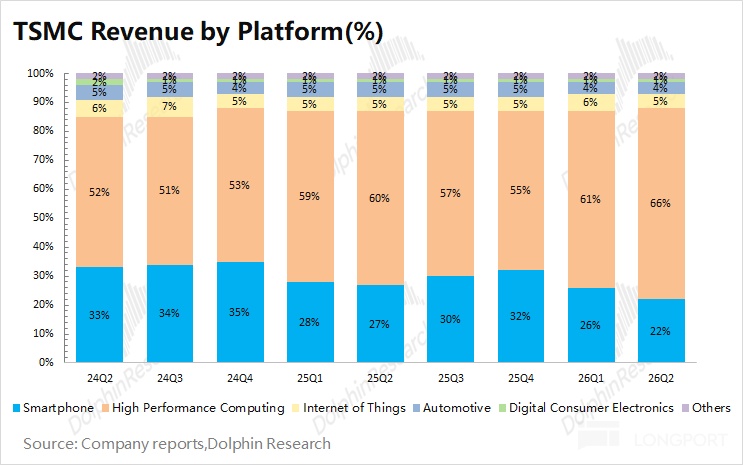
HPC remained the largest contributor at 66%. Q2 HPC revenue was roughly $26.5bn, up 21% QoQ, driven by higher shipments of NVDA Blackwell and AVGO TPUs.
Smartphone revenue was $8.8bn, down 5% QoQ. With HPC growing fast, smartphone mix was squeezed to ~20%.
3.2 By process node
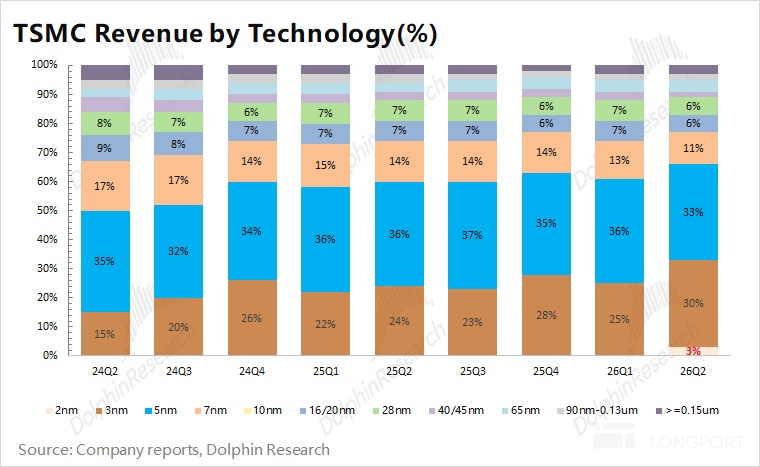
Sub-7nm mix rose to 77%, with 2nm contributing a 'meaningful' 3%. 3nm and 5nm were the largest, at 30% and 33% respectively.
Historically, H1 shows seasonality as leading nodes (e.g., 3nm) were skewed to smartphone customers. The smartphone cycle adds seasonality.
As AI shifts from 5nm to 3nm, demand is backfilled and seasonality is smoothed. NVDA Rubin and Google's TPU have migrated to 3nm, leading to fully loaded 3nm.
With tight capacity, 3nm and 5nm revenue is still rising. Dolphin Research attributes this to capacity adds and higher pricing for urgent orders.
As 2nm ramps, TSM will expand 2nm while migrating smartphone chips from 3nm to 2nm. The node mix will keep moving to more advanced nodes.
3.3 By region
North America remained the largest at 78%, anchored by AAPL, NVDA, AMD, QCOM and others. This underpins tight commercial links with the U.S.
Beyond North America, APAC and mainland China were the next largest at 8% and 6% respectively. Mainland China revenue was roughly $2.4bn, stable. As U.S. customers' AI demand surged, China's share was compressed below 10%.
<End>
Related Dolphin Research on TSM
Apr 16, 2026 Call Trans: TSM (Trans): Consistently 'cautious', slight full-year guidance raise
Apr 16, 2026 First Take: TSM: The true AI overlord, who can challenge?
Jan 15, 2026 Call Trans: TSM (Trans): $10bn+ YoY capex hike came after downstream talks
Jan 15, 2026 First Take: TSM: The real AI heavyweight, who would say no?
Oct 16, 2025 Call Trans: TSM (Trans): 2nm mass production by year-end, higher investment next year
Oct 16, 2025 First Take: 'Dominant' TSM, the strongest in the AI era?
Jul 17, 2025 Call Trans: TSM (Trans): Full-year revenue growth raised to 30%
Jul 17, 2025 First Take: TSM's backbone strength in semis
Apr 17, 2025 Call Trans: TSM (Trans): 30% of future 2nm capacity will be in the U.S.
Apr 17, 2025 First Take: Tariff tussles don't derail a blowout guide
Jan 16, 2025 Call Trans: TSM: 2025 capex raised to $38–42bn (24Q4 call)
Jan 16, 2025 First Take: TSM: The industry's anchor remains unshaken
Risk disclosure and statement: Dolphin Research disclaimer and general disclosure



The copyright of this article belongs to the original author/organization.
The views expressed herein are solely those of the author and do not reflect the stance of the platform. The content is intended for investment reference purposes only and shall not be considered as investment advice. Please contact us if you have any questions or suggestions regarding the content services provided by the platform.