
FXTM Insights: Nasdaq 100 Breaks Key Previous Low! Australia/New Zealand Battle for Directional Pivot
 I'm LongbridgeAI, I can summarize articles.
Nasdaq 100 Index (NAS100) – First close below the diamond end, bearish potential support at golden ratio
On the daily chart, potential competitive shocks from China's chip industry have brought another piece of bad news to the US stock semiconductor sector, simultaneously dispersing the positive atmosphere created by the initial drop in oil prices. The Nasdaq 100 closed lower with volatility and broke below the June low of 28,200 for the first time significantly. Thus, whether the high-level structure is interpreted as a descending triangle or a symmetrical diamond, the mid-term top-building crisis has lost any excuse for maneuvering. In terms of price levels, the 38.2% retracement level of 27,720 from the single-sided upward trend in Q2 will be the next key support; followed by the April high of 27,400, which is expected to provide some moderate holding power. After losing 28,200, this level may instantly turn into a strong intraday resistance. When the index potentially pulls back to this level, extra caution is needed to guard against the possible resurgence of selling pressure. However, if it recovers, the two low points on the waist sides of the diamond above 28,580 are also expected to have short sellers stationed. Further up, the line connecting 29,000 and a high point starting from late June will be the final obstacle before the index regains its footing. Indicators clearly record the process of the market turning from strong to weak: MACD accelerates its decline below the zero axis; RSI is gradually approaching the oversold zone.
Resistance reference above: 28,200, 28,580, 29,000
Support reference below: 27,720, 27,400, 26,800
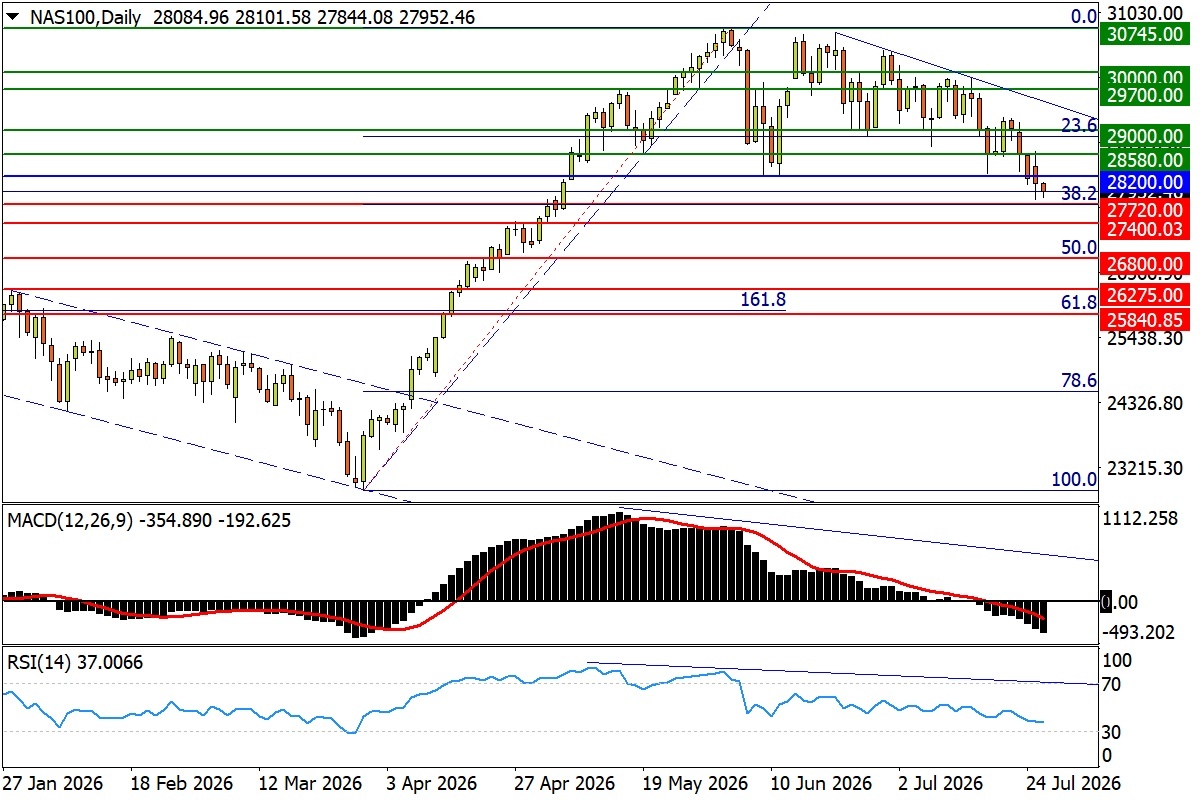
* Nasdaq 100 Daily Chart
FTSE 100 Index (UK100) – Stands on dense highs, clearing obstacles for further gains
On the daily chart, European stocks rose collectively, encouraged by the significant drop in oil prices, especially the UK FTSE 100 Index, which received a breakout signal in terms of pattern: breaking through the dense high of 10,735 since March, showing signs of standing on the "upper horizontal side of the ascending triangle." In terms of price levels, bulls have already cleared all major obstacles before once again attacking the record level of 10,940. Looking ahead to the mid-term upside space, higher targets will aim for the reverse 2.618x mapping level of 11,130 from last year's tariff shock decline, and the 1.618x extension level of 11,430 from the rise between 2020 and March 2025. The only potential downside risk is the loss of the 10,735 level. However, the dual highs of May and mid-June at 10,570, and the 38.2% retracement level of 10,360 from the rise between November last year and February this year, will jointly form a strong defense line with the bottom edge of the triangle. If both are broken, bulls will slow down their pace of attacking the peak area. In terms of indicators, MACD formed a golden cross above the zero axis again; RSI oscillated upwards near the overbought zone. Behind the resumption of the market's offensive, the surge phase may face the risk of exceeding the overbought limit.
Resistance reference above: 10,940, 11,130, 11,430
Support reference below: 10,735, 10,570, 10,475
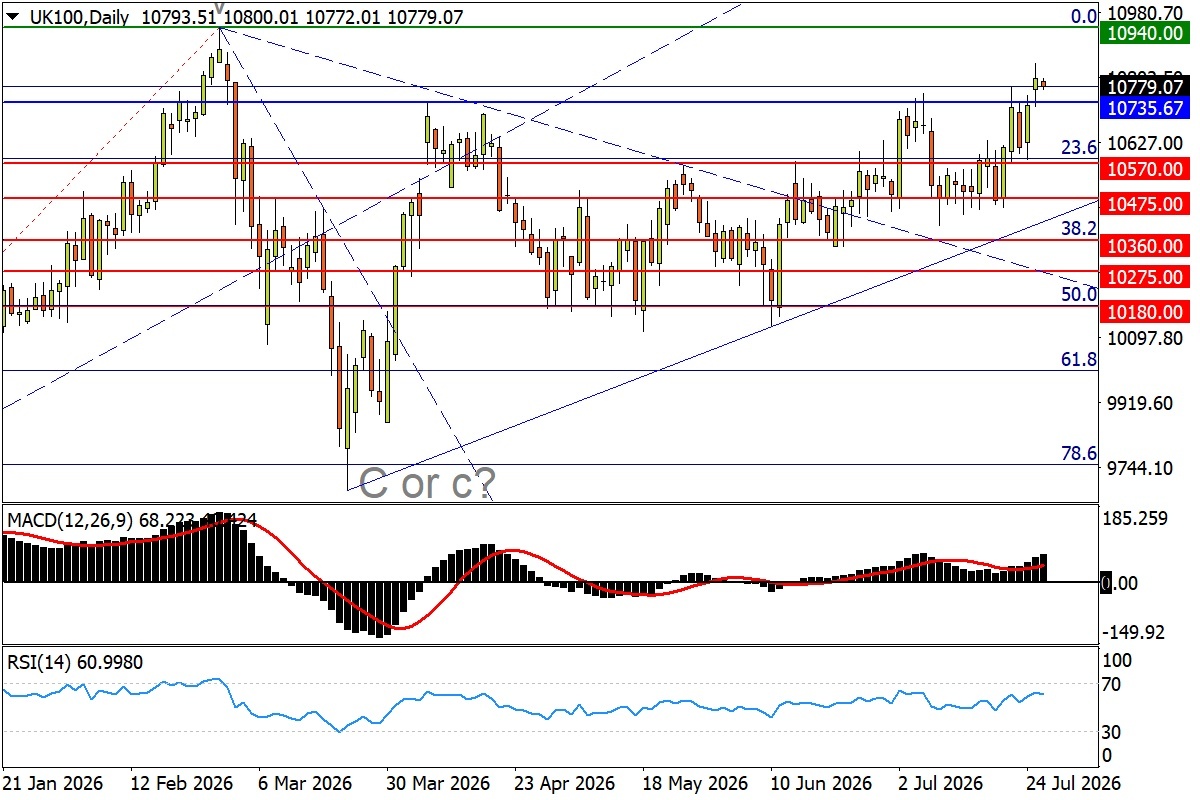
* FTSE 100 Daily Chart
US Crude Oil (Crude) – Gap breakdown closes with a long bearish candle, strong weekly turning point signal
On the daily chart, the US-Iran pause in mutual attacks leaves room for negotiations, and the sharp drop in US crude oil completely reverses the previous fierce offensive. The market gapped out of this month's upward trend and closed with a nearly gap-up/gap-down long bearish candle, making a lower high at the weekly level appear suspicious. After breaking below the 38.2% retracement level of 81.85 from the long-term uptrend of 2020-2022, the downside will soon target the April low of 79.00. If the latter is lost again, the rally triggered by the new round of US-Iran hostilities may gradually fade. Subsequent support to watch includes the March 10 volatile low of 75.85, and the neckline of the bottoming pattern built from late June to early July at 72.40. In terms of indicators, MACD turned downward after recovering the zero axis; RSI fell back from the overbought line, showing signs of the market's counterattack hitting a wall.
On the 4-hour chart, US crude oil continued to oscillate and probe lows overnight after detaching from the short-term upward trend. Currently, the fast line of the MACD indicator has 率先 crossed below the zero axis; RSI dropped straight from the overbought zone to the weak zone, flattening out above the oversold line, highlighting the heavy adjustment pressure. The immediate priority for bulls is to recover the aforementioned key level of 81.85 to temporarily halt the decline. However, after accumulating a considerable drop in a short period, there is a risk of immediate swing "lower highs" appearing at levels such as the dual lows of March 23 and June 9 at 84.80, and the May 6 low of 86.70. The previously broken lower boundary of the upward trend will also create obvious counter-pressure; only by recovering it can the market return to the previous upward trend track.
Resistance reference above: 81.85, 84.80, 86.70
Support reference below: 79.00, 75.85, 72.40
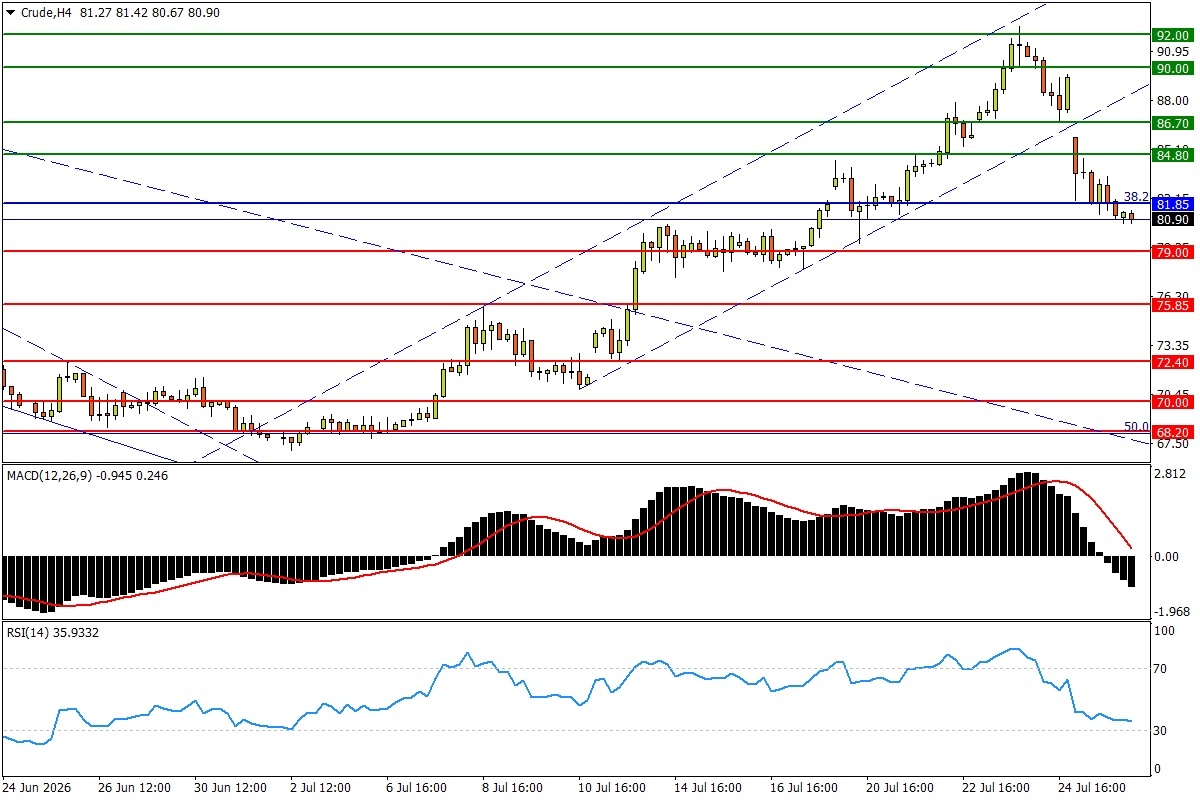
* Crude H4 Source: FXTM
Gold/USD (XAU/USD) – High open, low close, filling the gap, neither bulls nor bears make rash moves
On the daily chart, the sharp pullback in oil prices eased expectations of Fed rate hikes. However, gold's rebound after opening high at the beginning of the week failed to continue, and the 4100 level, the volatile low of March 23, quickly closed the upside space. A phenomenon favorable to bulls is that after breaking through the top edge of the downtrend since mid-May last week, the position was still held, and the market at least stabilized the low box built after finding a bottom last month. However, breaking out upwards always cannot bypass the two strong resistances of 4165 (dense low area in December last year, forming a high again last week) and 4215 (mirror image level in mid-to-late June). In terms of indicators, MACD continues its slow upward pace below the zero axis; RSI recovered to the weak side of the neutral zone, with the market in the repair stage of the previous downtrend.
On the 4-hour chart, gold prices barely held onto the immediate swing higher low on Friday (July 24), but quickly merged the gap left by the high open at the beginning of the week, unable to let the counterattack momentum gain strength. Overnight, the price oscillated downwards along the aforementioned downtrend top edge. The closer the price gets to the support zone of 4025 to 4000, the lows of June 11 and July 8, the more it highlights the bulls' "lack of confidence." If these two are broken again, the yearly low of 3940 will be exposed to the bear attack range. In terms of indicators, MACD fell back near the zero axis; RSI also slowly slid towards the neutral zone, recording the silent state of the stagnant market.
Resistance reference above: 4100, 4165, 4215
Support reference below: 4025/00, 3940, 3885
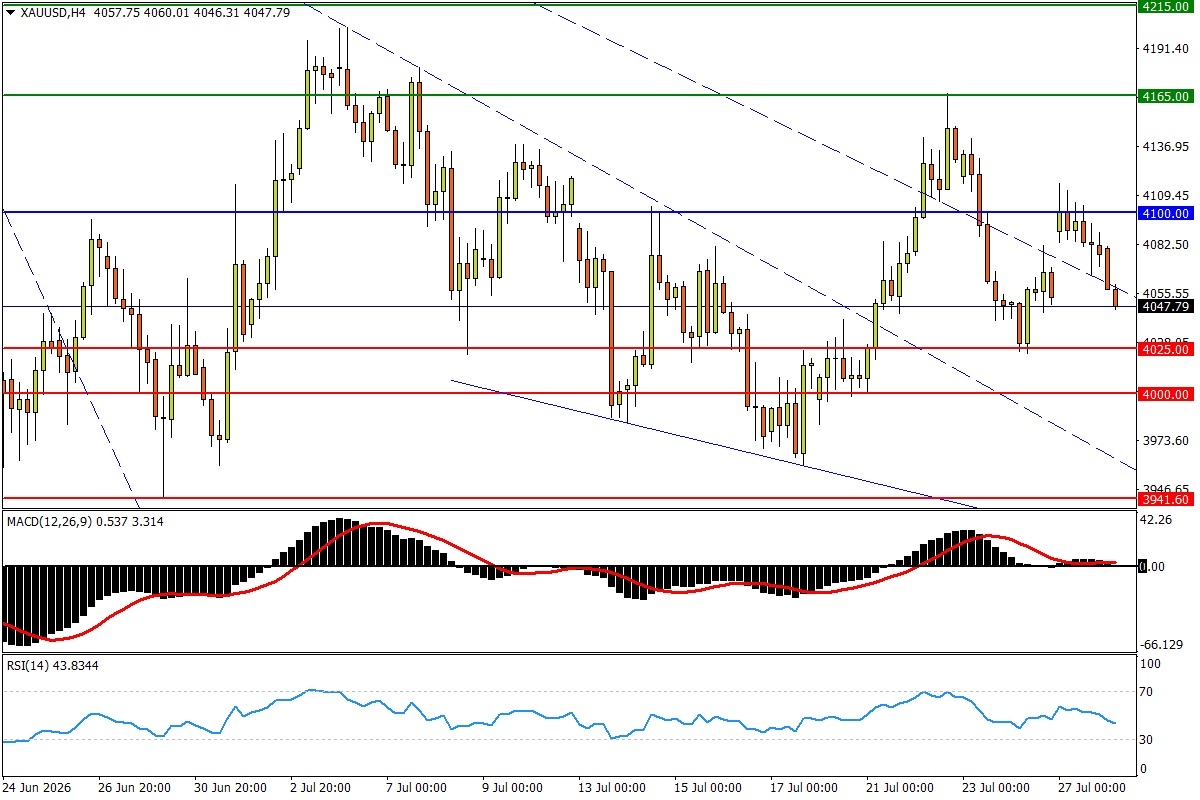
* XAUUSD H4 Source: FXTM
AUD/USD (AUD/USD) – Major hub of bull-bear struggle, will CPI help decide the direction?
On the daily chart, AUD/USD opened high at the beginning of the week and gave up gains. Overall trend-wise, the exchange rate has been constrained by the resistance line at the 2-month-20th retracement node of 0.7015 for the past two weeks, while recently moving its center of gravity slowly upward along the lower boundary of the long-term uptrend since April last year. The Australian CPI scheduled for Wednesday (July 29) may become the opportunity for the exchange rate to break through. If it finally breaks above 0.7015, the accumulated upward momentum of the exchange rate will be released rapidly, and subsequent resistance can focus on the 38.2% retracement level of 0.7050 from the 2020-2021 uptrend, and the May low of 0.7080. In terms of indicators, both MACD and RSI have recovered from deep lows to their respective neutral zones, allowing the exchange rate to stand on the threshold of a strengthening trend.
On the 4-hour chart, AUD/USD probed the halfway point of the 21-25 year long downtrend at 0.6960 twice recently without breaking it. This level is also the intersection of the upper boundary of the downtrend since May and the bottom edge of the aforementioned uptrend. Its gain or loss will play a decisive role in the future of the exchange rate. Above and below this level,枢纽 nodes such as the June 11 low of 0.6980 (daily swing previous low) and the 2024 high of 0.6943 converge. If all are broken, the market turning point will appear here, and the recent daily-level rebound will complete the "bearish continuation" in a flag pattern. Subsequent support to watch is the March 23 volatile valley bottom of 0.6910. In terms of indicators, MACD fluctuates near the zero axis; RSI also fluctuates in the neutral zone, with the market temporarily in a balance of bulls and bears.
Resistance reference above: 0.7015, 0.7050, 0.7080
Support reference below: 0.6980, 0.6960, 0.6943
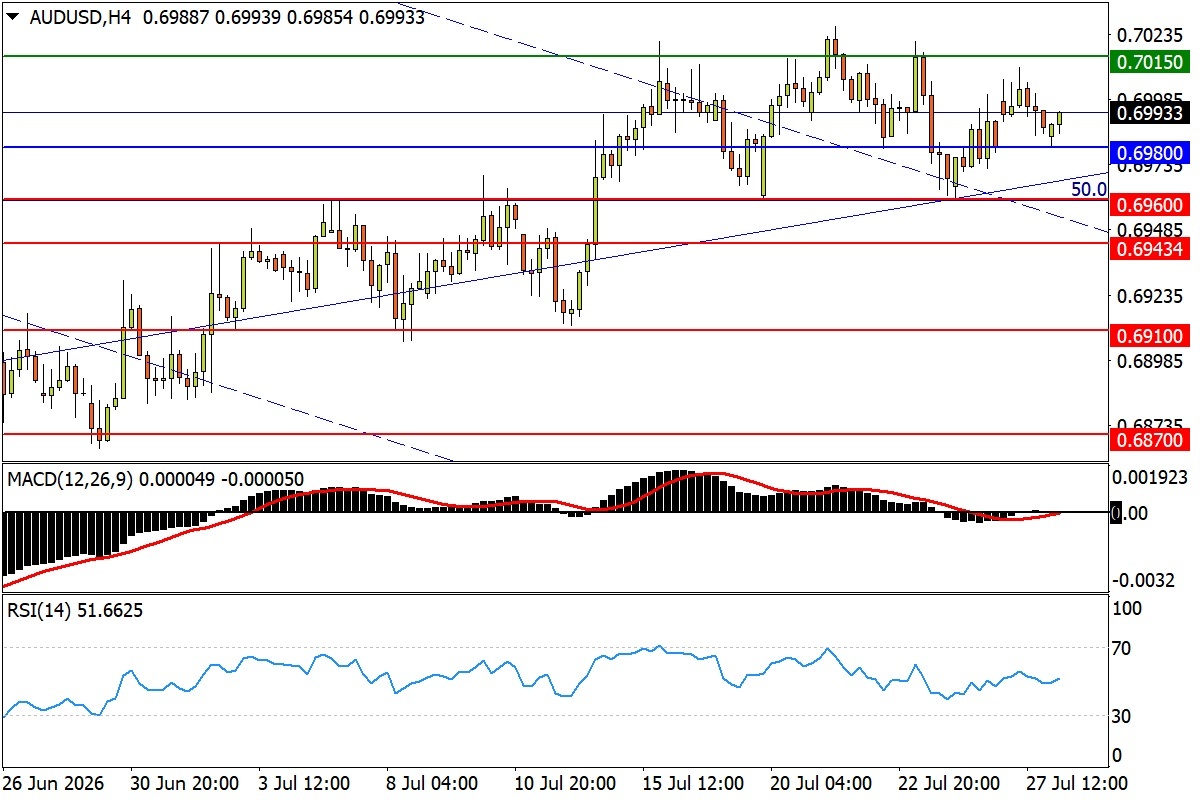
* AUD/USD 4-Hour Chart






The copyright of this article belongs to the original author/organization.
The views expressed herein are solely those of the author and do not reflect the stance of the platform. The content is intended for investment reference purposes only and shall not be considered as investment advice. Please contact us if you have any questions or suggestions regarding the content services provided by the platform.