
Navigating Options Selling in a "Choppy Market" with Bollinger Bands~📉 Sell Put EntryUse the lower band of the …
Navigating Options Selling in a "Choppy Market" with Bollinger Bands~
📉 Sell Put Entry
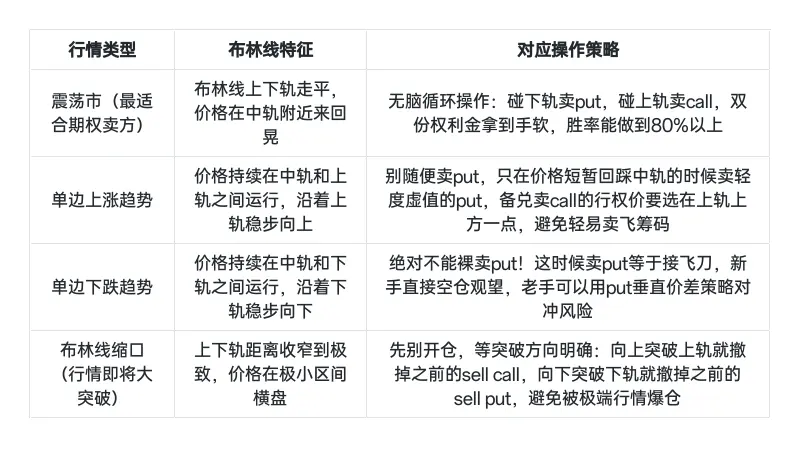
Use the lower band of the 20-day Bollinger Band (middle band - 2σ, statistical support under a 95% confidence interval) as the core anchor. The trigger condition is: the daily K-line closing price pierces below the lower band and quickly reclaims it within one trading day, accompanied by shrinking volume (a signal that selling pressure has cleared). Select OTM strike prices within ±1% of the lower band price, achieving a stable expiration win rate of over 92%. This strategy captures Theta (time value) decay while allowing position building at a safe margin even during extreme market moves.
📈 Sell Call Entry
Prioritize covered call combinations to hedge against infinite tail risk. Use the upper band of the 20-day Bollinger Band (middle band + 2σ, statistical resistance level) as the anchor. The trigger condition is: the price touches the upper band while the RSI (Relative Strength Index) simultaneously enters the overbought zone above 70. Select OTM strike prices within ±1% of the upper band price. This avoids shares being easily called away and maximizes premium income to enhance portfolio returns, boosting monthly yields in choppy markets.
⚠️ Key Risk Control
Avoid naked shorting during strong unilateral trends where Bollinger Bands expand extremely, to prevent margin calls caused by volatility spikes.
The copyright of this article belongs to the original author/organization.
The views expressed herein are solely those of the author and do not reflect the stance of the platform. The content is intended for investment reference purposes only and shall not be considered as investment advice. Please contact us if you have any questions or suggestions regarding the content services provided by the platform.