Before Nvidia's earnings, it was the 10-year yield that weighed on AI hardware first: Meta rose 2.90%, while five chip sellers fell an average of 7.35%.
The further profits are from today, the more they get discounted by long-end rates; banks, however, rose.
Hedging via options was mostly bought for the earnings date, bond spreads didn't widen, and what was repriced on Friday was the discount rate.
The market is waiting for Nvidia's Q3 report on Nov 17. On Friday, AI hardware stocks fell first, but Nvidia wasn't the worst performer. Nvidia closed down 2.01%, falling about 1 percentage point less than the Semiconductor ETF; AMD, Nebius, Dell, CoreWeave, and Broadcom fell an average of 7.35%, over 5 points more than Nvidia; Meta rose 2.90% compared to Thursday. On the same day, 315 S&P 500 components closed higher, more than double Thursday's count.
Why does one end of the same AI supply chain rise while the other falls? The clue lies in the 10-year Treasury. It's the ruler used to discount future profits; the further out the profits, the more they get cut when this ruler moves. Meanwhile, hedging in the options market was mostly bought for the earnings day itself.
The Price Tag of Fear at 68: One-Year Hedging Rises More Than One-Month
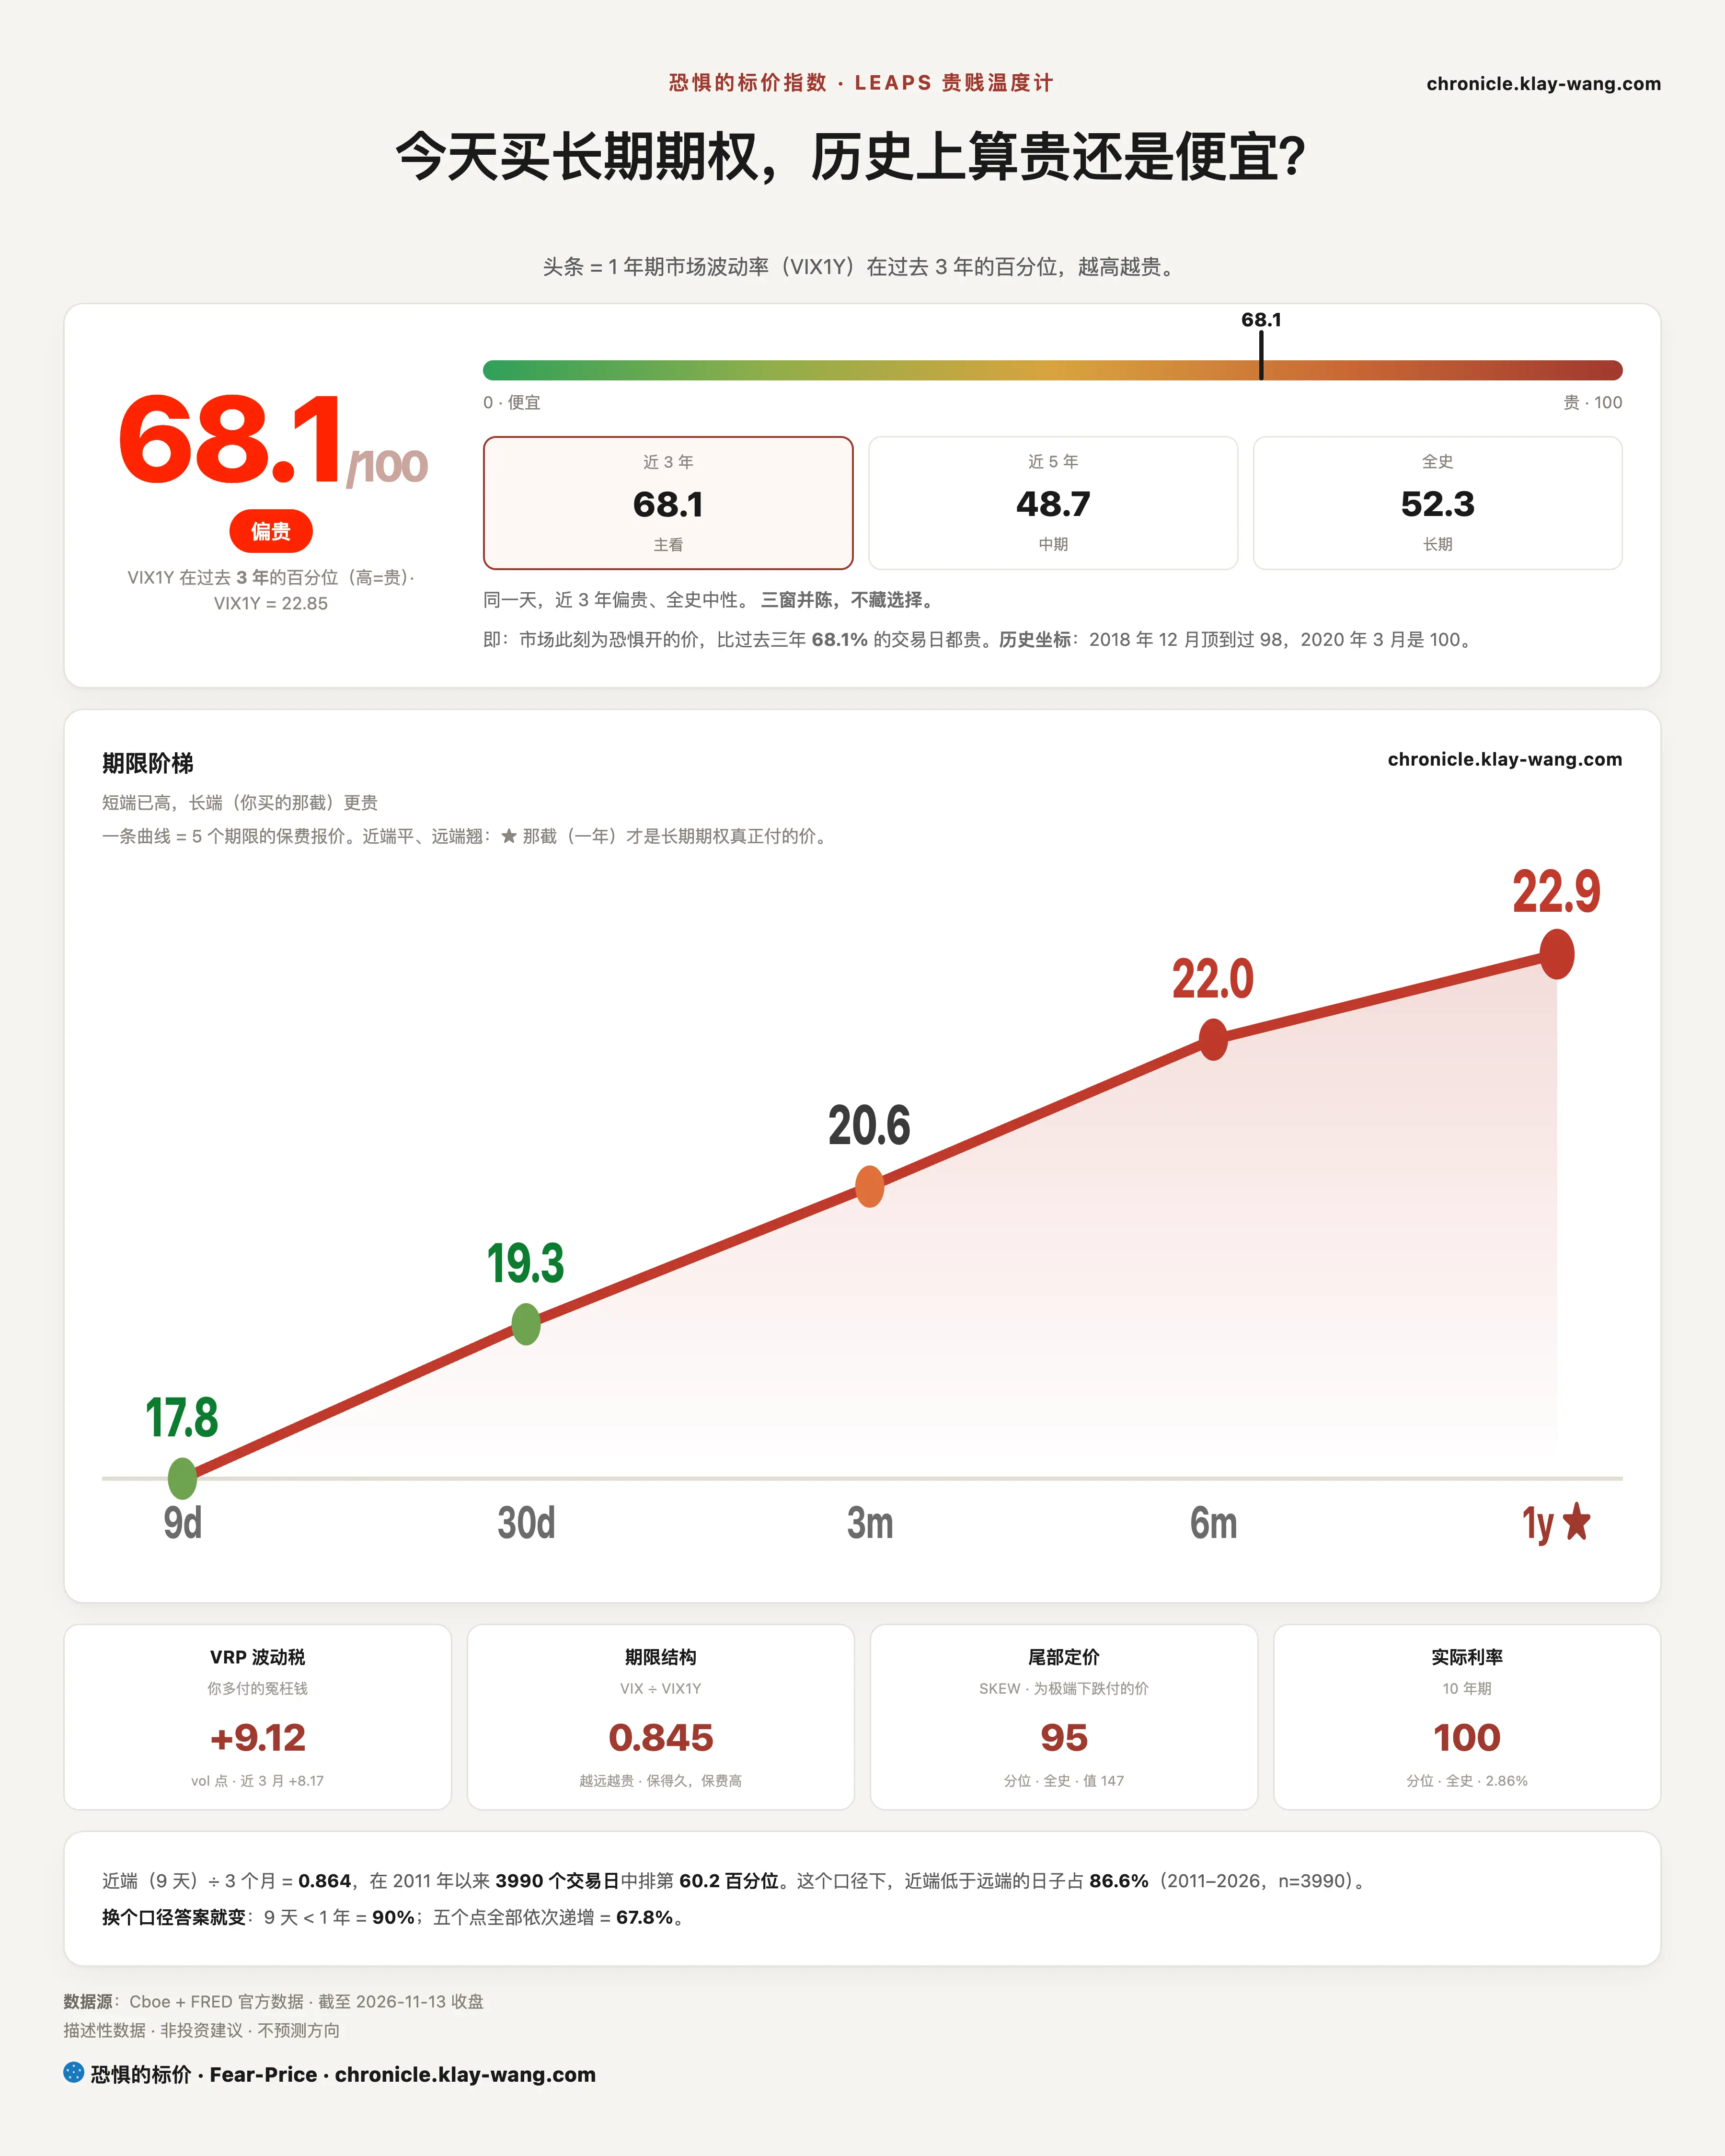
Fear-Price Index · 2026-11-13 · Reading 68.1/100
The one-year implied volatility stands at 22.85%, in the 68.1st percentile over the past three years, up from 61.1 on Nov 12; historically, a higher reading means more expensive premiums.
Daily ledger and methodology at chronicle.klay-wang.com. Reproduction must credit: Fear-Price Index · Fear-Price.
The index dropped only 0.36%, yet the Fear-Price Index rose 7 percentile points from Thursday, with the increase concentrated in the long end. S&P 500 one-year options were 0.73 points more expensive than Thursday, while one-month options were only 0.54 points more expensive; from 9 days to one year, the longer the tenor, the more expensive. Option buyers aren't betting on a sharp drop next week; they are pricing in interest rates for the coming year. For holders of broad-market indices, short-term protection remains cheaper than one-year coverage.
Hedging against sharp drops saw a slight pullback. The SKEW Index (measuring how much extra the options market pays for crash protection) fell from 150.16 on Thursday to 147.14, still in the 94.7th percentile since records began. The K-index stood at 2.0, below Thursday's final print of 2.157; closer to 1 indicates more participants are actually paying for protection. Historical data at chronicle.klay-wang.com/kindex, index at chronicle.klay-wang.com/fear-price.
■ Rates
Where Rates Rise on the Curve Determines Who Falls
PPI came in below expectations, yet the 10-year Treasury yield did not retreat. October Producer Price Index (PPI, prices at factory and wholesale levels) rose 0.3% month-over-month, significantly slower than September's 1.4%, and slightly below market expectations; however, the annual rate rose from 6.3% to 6.5%, with service prices rising for the fifth consecutive month.
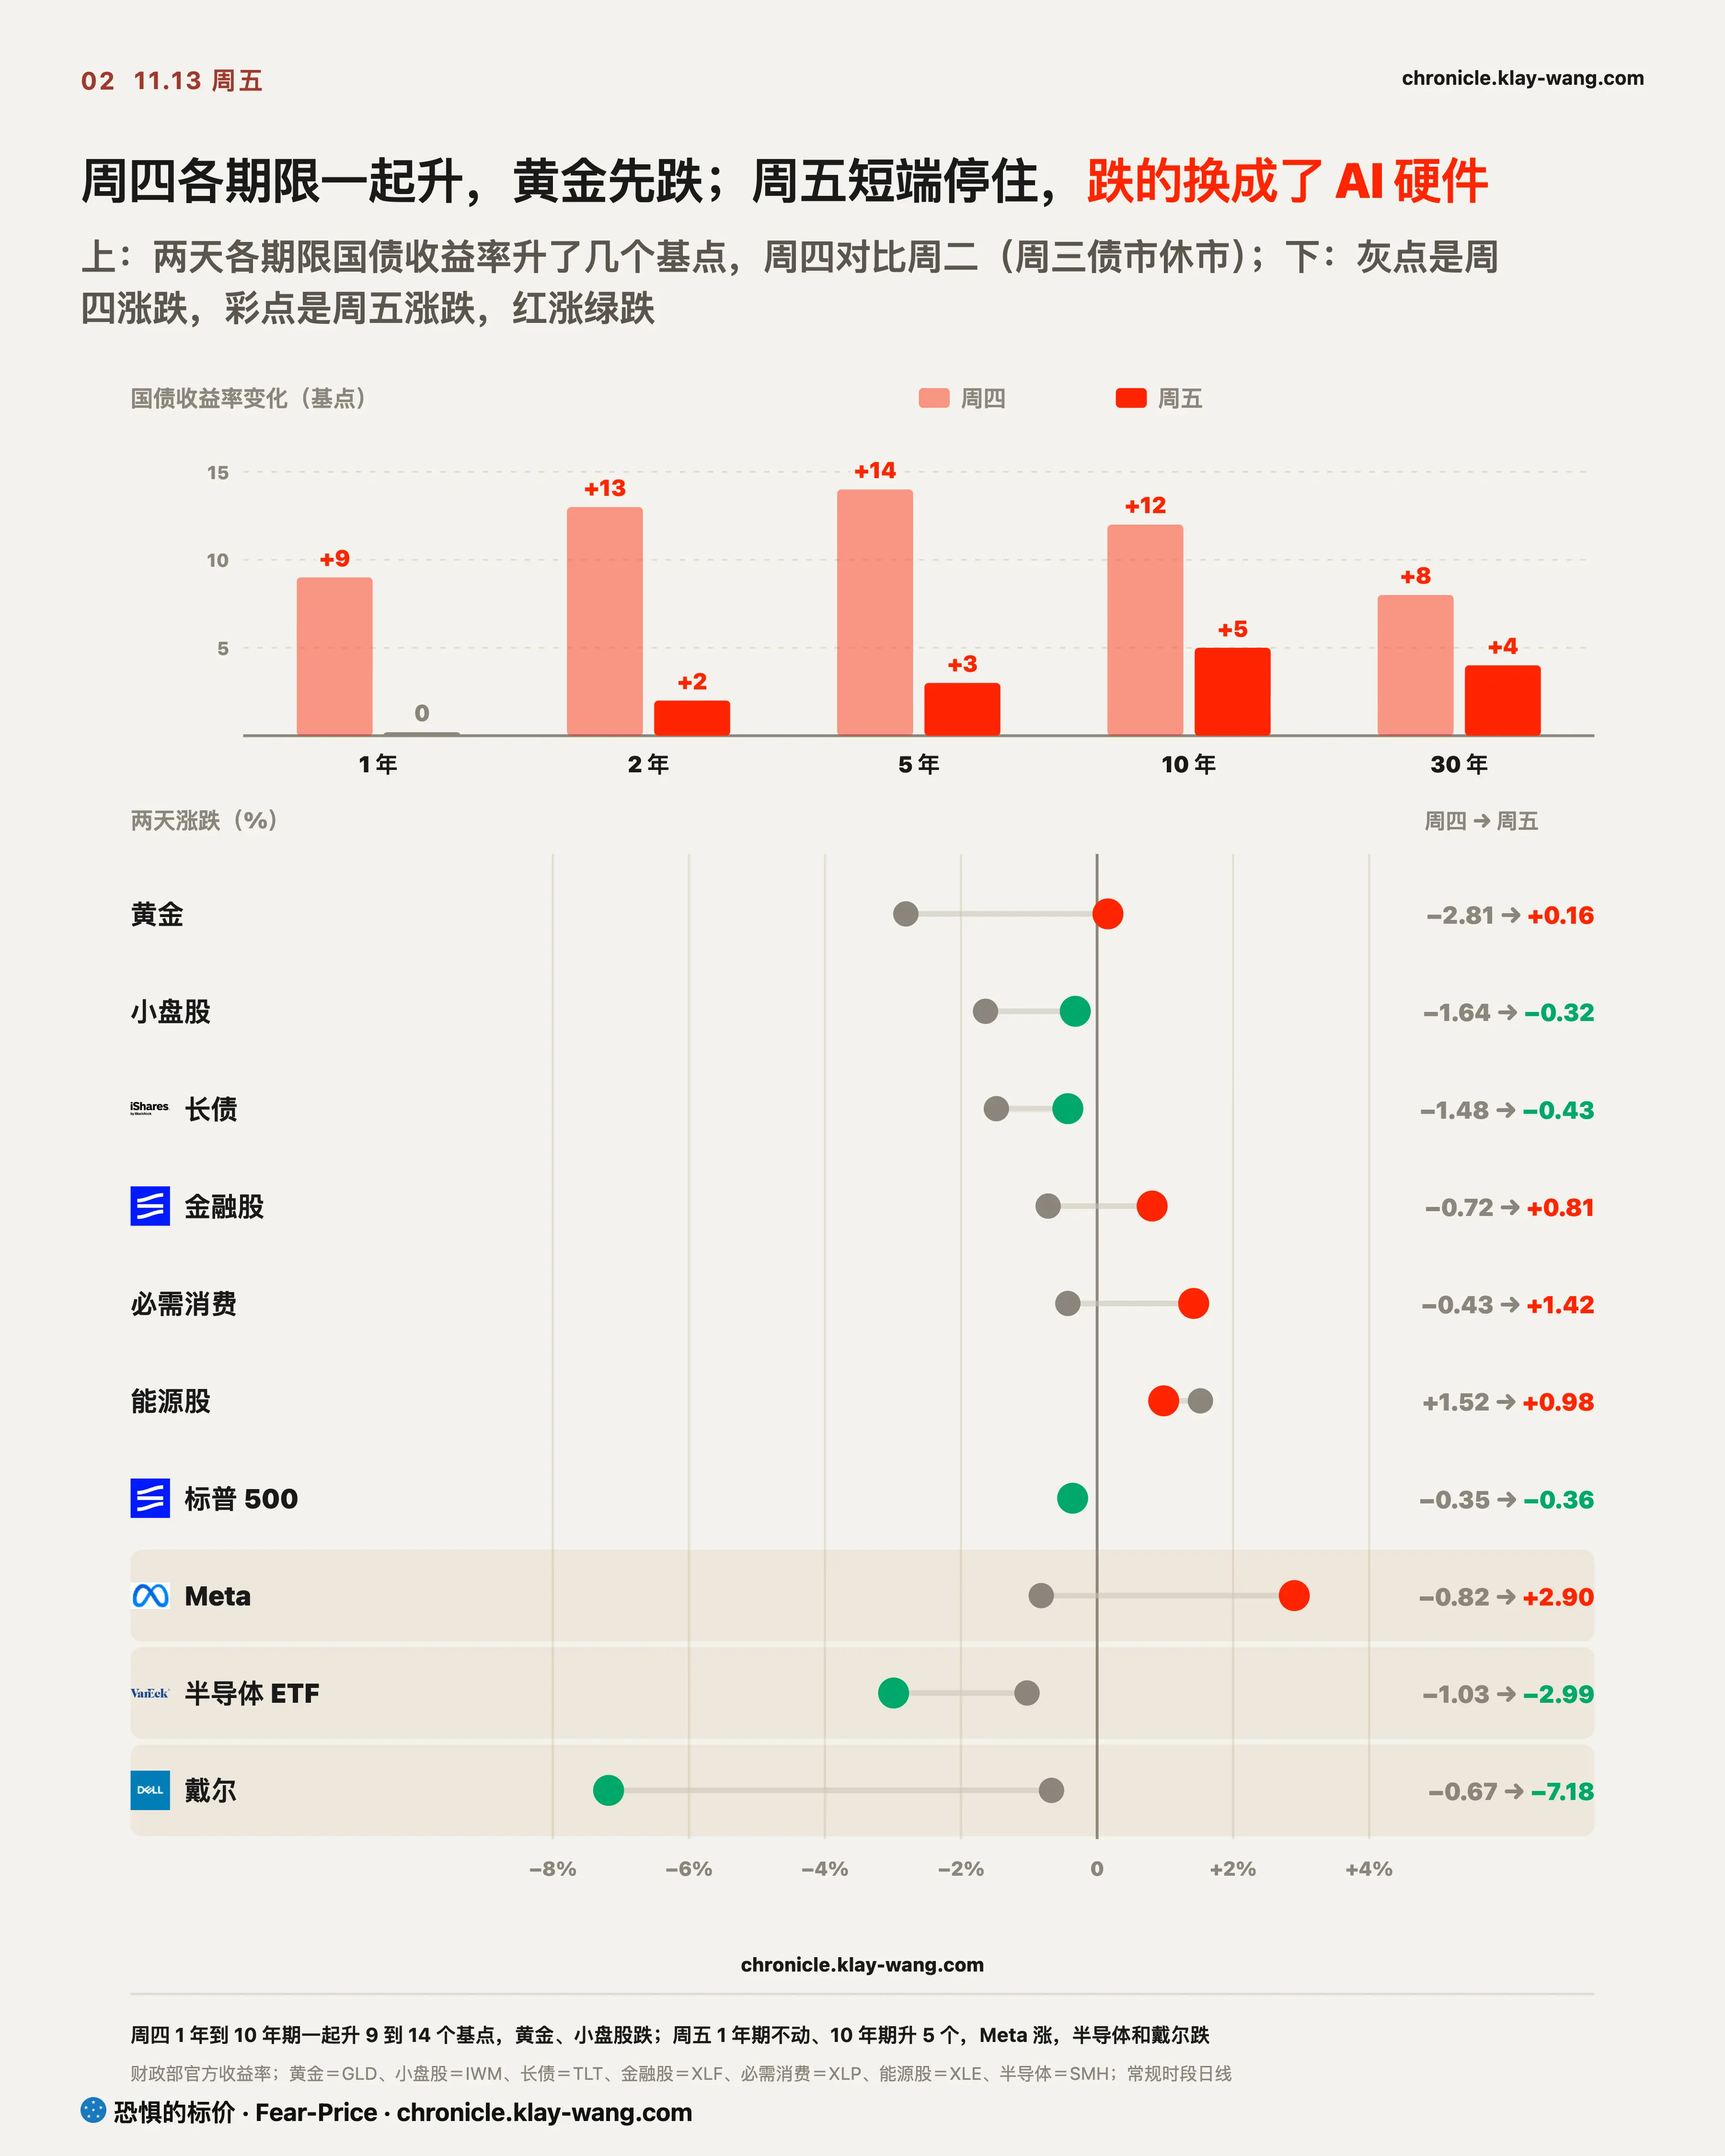
The official 10-year yield closed at 5.15%, 5 basis points higher than Thursday. The 1-year yield was unchanged, and the 2-year yield rose only 2 basis points. The short end remained stable, indicating the market isn't adding more bets on further rate hikes next year; the long end continues to rise because lenders demand higher compensation for lending to the government over longer periods.
Thursday and Friday formed a perfect contrast. Wednesday's bond market was closed, so Thursday made up for two days of trading: yields from 1 to 10 years were 9 to 14 basis points higher than Tuesday, as the market priced in more aggressive rate hikes for next year. Assets that compete with deposit rates for returns fell first: small-cap stocks dropped 1.64%, gold fell 2.81%. Small companies rely heavily on floating-rate loans, so as short-end rates rise, their interest costs follow; gold pays no interest, so as deposit rates rise, the opportunity cost of holding it increases.
On Friday, short-end rates didn't rise, gold stopped falling and closed up 0.16%, and the biggest losers returned to AI hardware. A company's value equals the sum of its future annual profits discounted back to today; the long-end rate is the ruler used for this discounting. The further out the profits, the more they get cut.
Banks moved in the opposite direction over these two days, earning from net interest margins. On Thursday, both ends rose together, and Financial ETFs fell 0.72%; on Friday, the long end rose more than the short end, widening this spread, and Financial ETFs rose 0.81%, closing in the top 5% of the day's range. What does this mean? The close was nearly at the daily high, with buying pressure persisting until the late session. Banks rising and AI hardware falling on the same day shows that capital allocation is driven by which segment of the yield curve is rising.
Chicago Fed President Goolsbee stated on Friday that inflation still needs to be addressed and warned against overheating demand; he also mentioned AI investment driving economic warmth. Goolsbee has historically been dovish, but this time aligns with Hammad's shift toward restrictive policy on Thursday—both pointing in the same direction. The real interest rate attached to the thermometer (rate minus inflation expectations) is 2.86%, ranking in the 99.5th percentile of all history. For assets that won't generate profits for many years, the opportunity cost is very high.
Our view is that who falls the most this week is determined by the 10-year yield: by the close on Nov 20, as long as the official 10-year yield doesn't fall below 5%, the Semiconductor ETF will underperform the Consumer Staples ETF from the Nov 13 close. If the 10-year yield falls below 5% before then, or if the Semiconductor ETF outperforms, this thesis is incorrect.
■ AI
Big Tech Buying Compute Power Didn't Fall Much; Chip Sellers and Compute Renters Crashed
On the same AI supply chain, those spending money and those receiving money moved in opposite directions on Friday. Meta rose 2.90% vs. Thursday, Apple and Microsoft saw small gains, Amazon and Google saw small declines; AMD, Nebius, Dell, CoreWeave, and Broadcom fell an average of 7.35%, 7 points more than the S&P 500.
One company's capex is another company's revenue. The money big tech spends on chips and servers comes from today's advertising, cloud, and software profits; a slight rise in the discount rate doesn't cut these profits much. Companies selling equipment and renting compute power, however, depend on whether big tech will continue spending next year and the year after; their profits are further out and more uncertain. When the discount rate rises, they are hit the hardest, hence the biggest drops. Friday saw exactly the long-end rate, which determines the discount rate, rising.
AMD fell heavily partly because it had risen so much previously. After the Jensen Huang incident, money rotated from Nvidia to AMD. From Nov 6 to Thursday's close, AMD rose 30.3%. Nvidia gapped up on Friday, triggering partial unwinding of this rotation; AMD had no specific news that day. For holders of these stocks, profits ranked in later years make stock prices most sensitive to long-end rates. Beyond earnings, the 10-year yield matters too.
■ Misalignment
Hedging Mostly Bought for Earnings, Yet Friday Weighed on AI Hardware via Rates
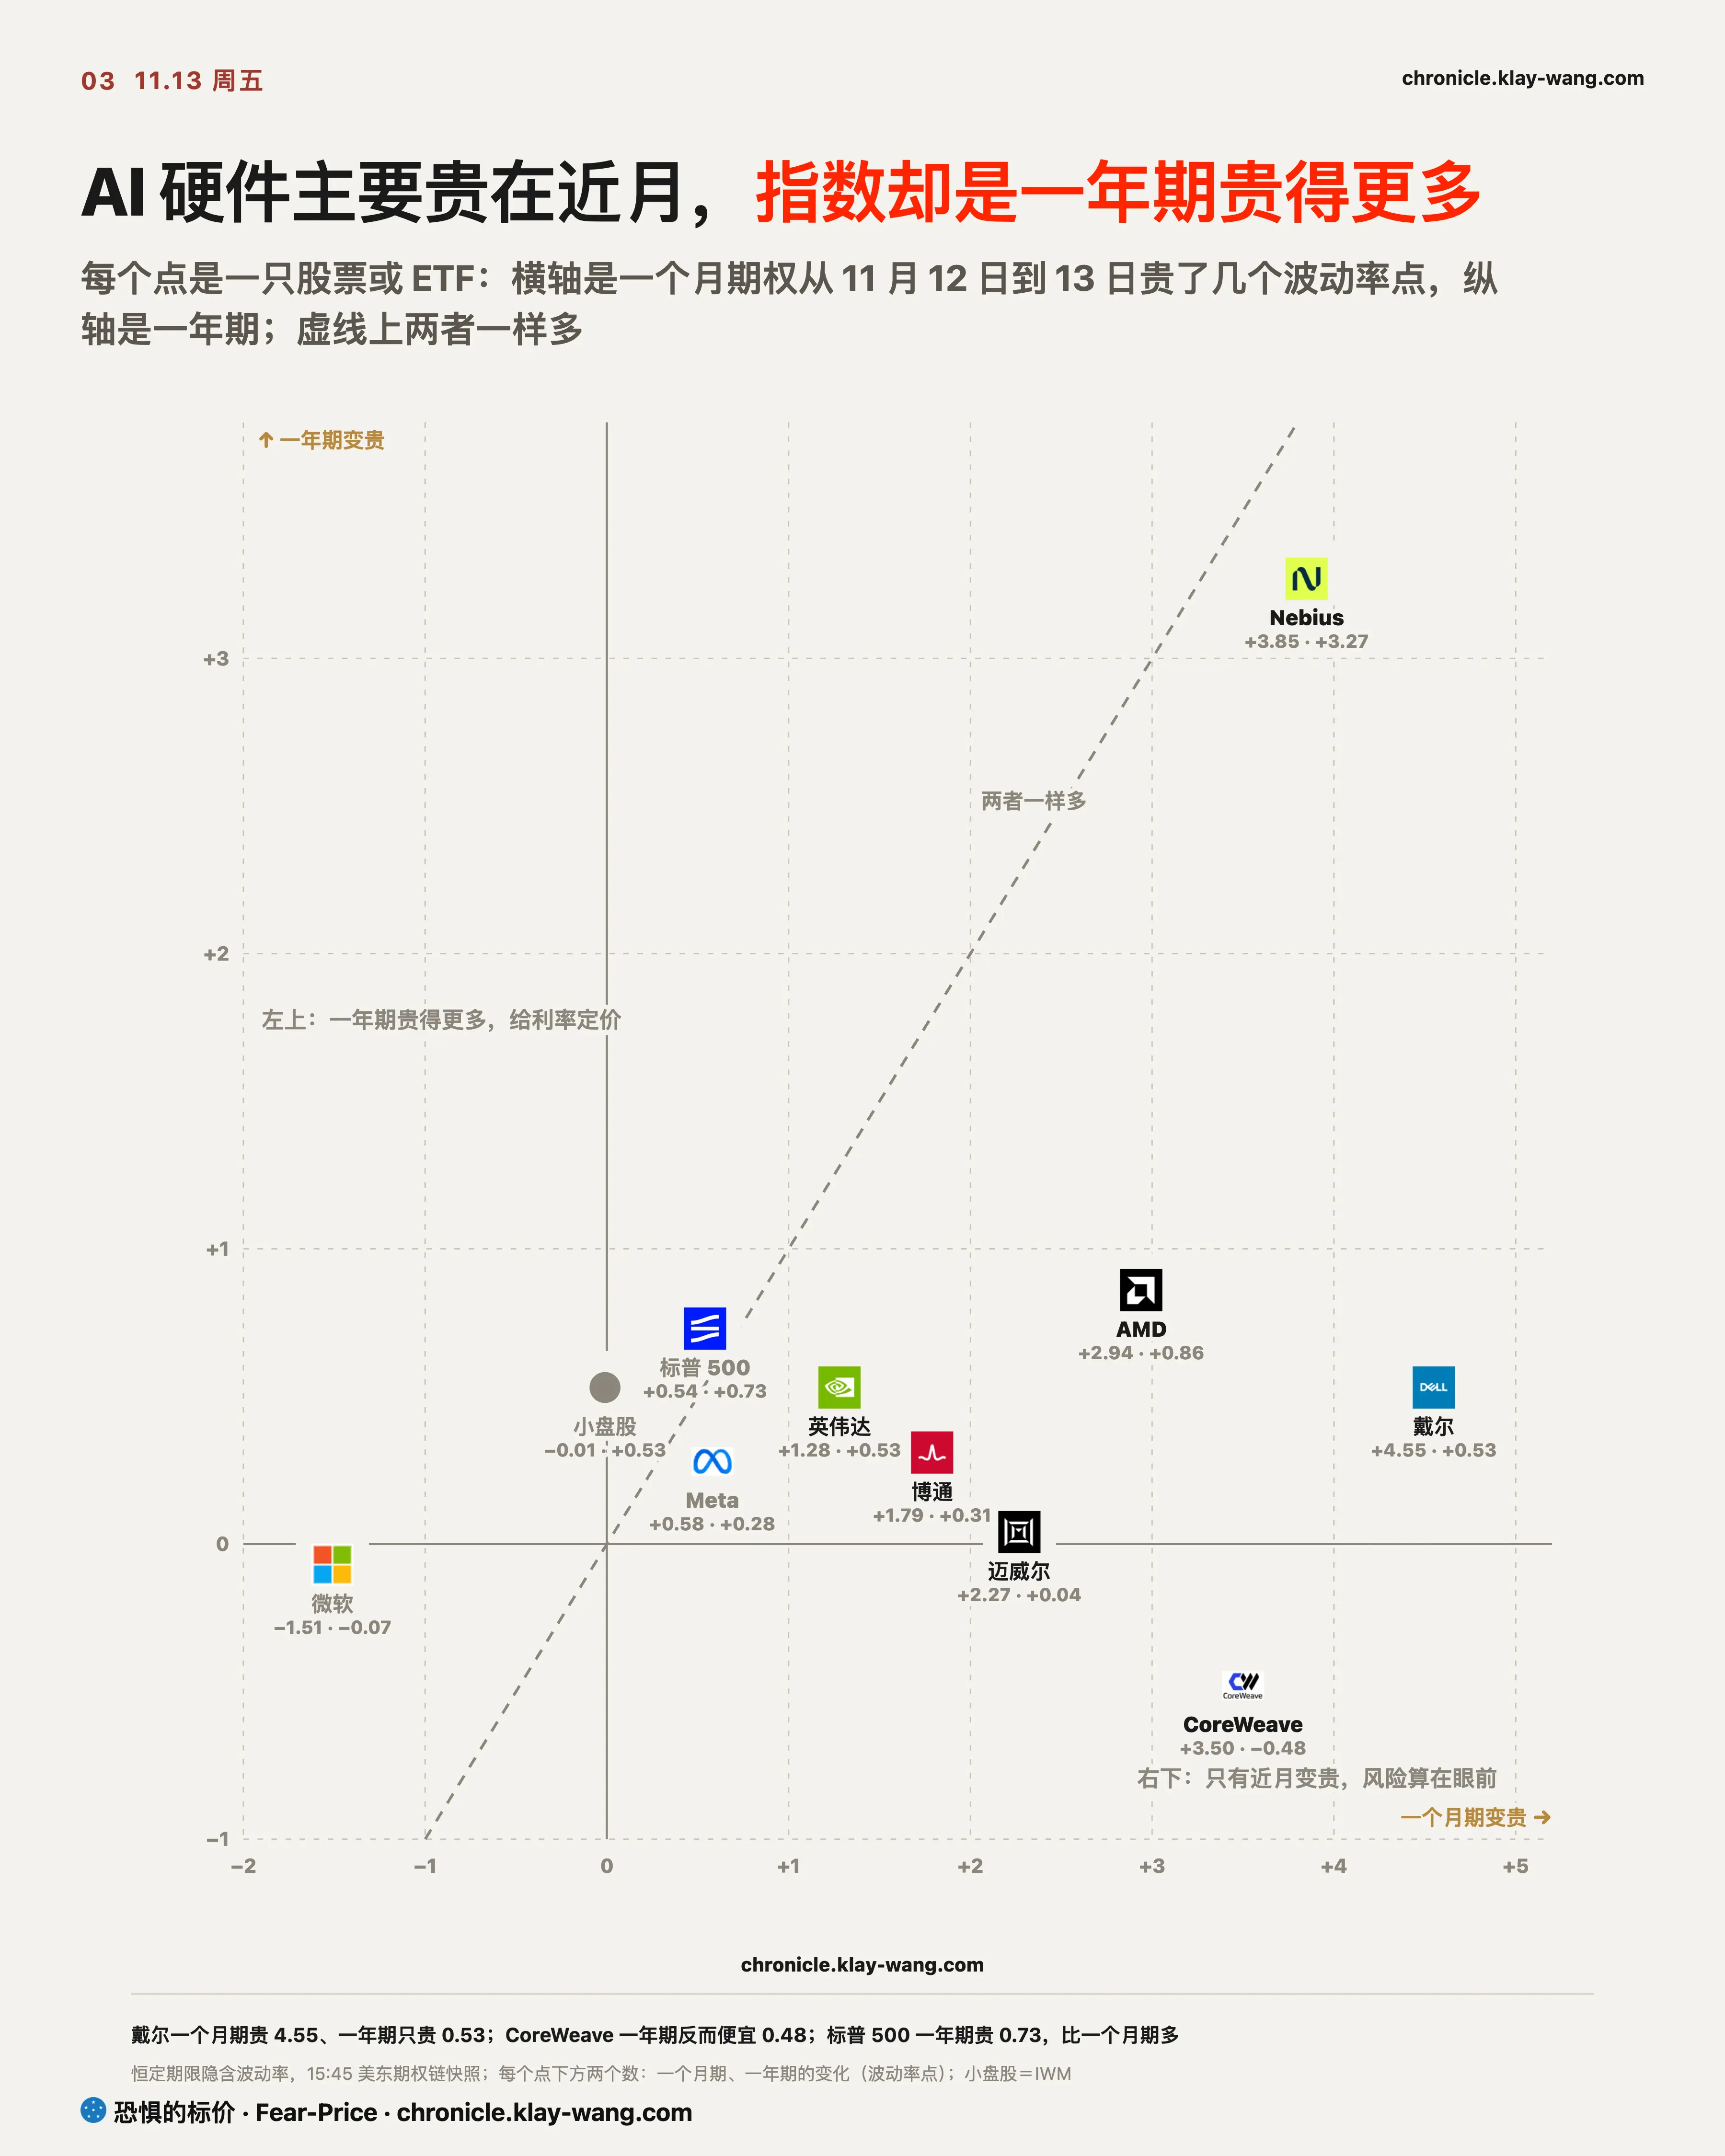
On the options side, the market priced AI hardware risk into the near month, and index risk into the one-year horizon. Dell one-month options were 4.55 points more expensive than Thursday, while one-year options were only 0.53 points more expensive; CoreWeave one-month options were 3.50 points more expensive, while one-year options were actually 0.48 points cheaper. The S&P 500 reversed this: one-year options were 0.73 points more expensive, one-month were 0.54 points more expensive; small-cap one-month options were unchanged, while one-year options were 0.53 points more expensive.
Near months expensive, far months flat suggests the market sees AI hardware risk concentrated in the near term, with Nvidia's Nov 17 earnings falling within this month. The one-year index options becoming more expensive reflects pricing in a full year of high rates. The exception in this circle is Nebius, where both one-month and one-year options rose over 3 points, with even far-month participants demanding compensation.
Cloud vendors currently lack this concern; Microsoft and Meta one-month options remain 3 to 5 points cheaper than one-year options, which is normal; Dell, Nvidia, and Marvell one-month options are 13 to 20 points more expensive than one-year options.
The premium Nvidia near-month options command over one-year options is 7.95 points more than the Semiconductor ETF. Before earnings, the options market attributes the risk to Nvidia itself. For Nvidia holders, buying protection now is expensive precisely because of the company itself.
In the Nov 11 issue, we wrote that using AMD to hedge Nvidia can only block one of two risks. These two days played out exactly that. On Thursday, Nvidia fell 4.34% while AMD rose 5.86%; this was an Nvidia-specific event, and the short AMD leg was also losing. On Friday, rates pressured the entire industry. Using the ratio from that issue of $0.29 short AMD per $1 Nvidia, the portfolio gained roughly 0.5% that day, while Nvidia alone fell 2.01%. Everyone is watching earnings, and option pricing is concentrated around earnings; what truly weighed on AI hardware on Friday was rates, a risk currently priced lower.
■ Bonds
Stocks Falling the Most, Bond Markets Actually More Reassured Than a Week Ago
For the stocks falling the most, bond spreads didn't widen compared to last Friday; some narrowed significantly. Compared to last Friday, CoreWeave bond spreads narrowed from 1162 bps to 981, Oracle from 315 to 275.
AMD stood at 60.6 bps on Friday, at the lower end of the 57-87 bps range seen over the past two weeks; Nvidia fell from 72.8 on Thursday to 68.3, moving further away from the 84.4 line.
Stocks falling while spreads remain flat indicates that Friday's selloff was valuation-driven, and creditors see no deterioration in repayment ability. Rising discount rates cut the present value of future profits; creditors see no change in the ability to pay interest next year. These bonds only take the last trade of the day, resulting in large single-day fluctuations; one must watch trends over several days. Only when spreads and stock prices deteriorate together does it shift from a valuation issue to a credit issue. For holders of these companies' bonds, Friday's decline remains a shareholder matter for now.
The main thread ends here. The next three sections cover three other 盘面 aspects today: Nvidia's bullish 大户, options volume, and reconciliation of old theses.
■ Nvidia
Bullish 大户 Shift Downward for the Third Time; Big Money Hasn't Left, But Targets Are Lower
Nvidia's near-month options were covered in the previous section; this section looks at far-month bullish 大户. Nvidia fell on shrinking volume on Friday. Those who took positions near $150 on Thursday haven't left. It gapped up 2.24%, then drifted lower, closing at $162.85, down 2.01% from Thursday, falling about 1 point less than the Semiconductor ETF; total volume was 363 million shares, less than half of Thursday's. The close was 9.4% above the $148.80 test line.
Bullish 大户 shifted downward for the third time, confirming the direction. On the far end, settlement positions read Friday morning (contracts remaining unhedged after close) showed March 185 calls decreased by approx. 33k contracts, while the combined 170 and 175 strikes increased by approx. 85k contracts, and the upper leg at 225 increased by approx. 40k contracts.
Comparing to Thursday's criteria, the direction is fully correct, though the actual reduction at 185 was about 7k contracts less than the criterion. Over three shifts, the lower leg's strike price is about 12% lower than a week ago. This shows big money hasn't left, but the target prices for profit are getting progressively lower.
Reconstructing these three steps as one person's operation, it likely goes like this. He originally held March 185 calls. As the stock price moved further away from this strike, instead of cutting losses, he chose to unwind part of the position and switch to strikes closer to the current price: 170 and 175. The 225 leg seems sold to collect premium, subsidizing the cost of the roll, at the expense of upside beyond 225 going to others. His goal is to lower the breakeven threshold: if Nvidia returns above $170-$175 before expiration, he starts making money, without needing to wait for it to return to $185.
A new set of trades emerged on Friday. February 185 calls traded approx. 55k contracts, similar to his total holdings; February 240 calls traded approx. 54k contracts, 7 times his existing position. The 185 strike was the contract watched in the Wednesday issue; if Monday's open interest drops below 40k contracts and stays there for 3 consecutive trading days, the judgment that the bullish 大户 remains will be retracted.
What to watch post-earnings is whether the two groups of stocks will continue to fall together. On Friday, the competitor group and supply chain group fell together for the first time since the thesis was established on Nov 11. As written in the Thursday issue, when both groups fall together, the market's bet shifts from market share to total AI capex. One day isn't enough to conclude: from the Nov 11 close, the competitor group fell an average of 1.44%, the supply chain group fell 7.49%, narrowing the gap from 8.7 to 6.0 points. If both groups continue to fall together next week and the gap continues to narrow, it will indicate the market begins to doubt the entire 产业链。
For chip stocks, watch the 10-year yield first, then Nvidia's Nov 17 earnings.
■ Volume
Index Trading Buys Downside Protection, AI Stocks Bet on Three-Month Upside
Sorted by expiration, the direction of volume on indices and AI stocks differs:
Within two months: Put volume on small-caps and Financial ETFs is over 13x call volume; Nvidia, Micron, and CoreWeave reverse this, with call volume exceeding put volume.
Three weeks out: Semiconductor ETF Dec 4 $520 calls traded nearly 40x existing open interest, this strike being 6.8% above Friday's close.
Four months out: S&P 500 ETF Mar $605 puts traded 11.8x existing open interest; Mar $715 puts traded 4x open interest.
Three months out: AMD Feb $700 and $870 calls, and Micron Feb $1000 and $1350 calls, appeared in 1:1 ratios.
Over one year: Financial ETF Jan 2028 $55 puts traded 20x existing open interest.
These two S&P strikes, one approx. 5% below spot and one approx. 20% below, resemble a bear put spread: paying a premium to buy protection for the index falling 5% to 20% in four months. The AMD and Micron pairs resemble bull call spreads betting on reaching higher strikes in three months.
Putting it together, index volume is buying downside protection, while AI stock volume is betting on upside in three months. Volume alone doesn't distinguish buying from selling; Monday morning's settlement open interest (contracts remaining unhedged after close) will clarify if these are new opens or closes. If all are new opens, money is hedging against rates suppressing the broad market, while for AI stocks' far end, someone is still betting. For holders of financial and small-cap stocks, during this rally, someone is simultaneously paying premiums.
■ Reconciliation
Six Old Theses, The Equal-Weight Half Was Wrong on Day One
Nov 9 wrote: Pre-earnings, Nvidia near-month premium was always at least 3 points higher than the Semiconductor ETF. Friday it was 7.95 points higher, currently correct,开奖 on Nov 17.
Nov 10 wrote: AMD and Broadcom held above their respective test lines. Friday AMD closed at 534.06, 9% above the line; Broadcom closed at 347.01, 7% above the line. Currently correct.
Nov 11 wrote: By year-end, the competitor group would outperform the supply chain group. Friday both groups fell, narrowing the gap to 6.0 points, currently correct.
Nov 12 wrote: With the 10-year holding above 5%, equal-weight S&P would underperform market-cap weighted. Friday the first half was correct, but the second half reversed on day one: equal-weight S&P outperformed by 0.56 points.
Nov 12 wrote: Pre-earnings, Nvidia would not close below 148.80. Friday closed at 162.85, currently correct.
Nov 12 wrote: By year-end, CoreWeave and Nebius would underperform Nvidia. Friday the two averaged an 8.03% drop, Nvidia dropped 2.01%, currently correct.
What This Means for Your Holdings
Shareholders of AMD, Dell, and New Cloud hold the longest-duration assets in this cycle. The 10-year yield is 15 bps above 5%, meaning any rebound is easily interrupted by rates. Their one-month options became more expensive on Friday, making protection most costly now; one-year options remained relatively flat, with the options market pricing risk into the near term.
Nvidia shareholders, watch two lines: whether the close holds 148.80, and the Nov 17 earnings. Options still attribute risk to Nvidia itself; Monday's Feb 185 call open interest will reveal if the bullish 大户 is rolling or exiting.
Financial stocks, the reason for Friday's rise was the long end rising more than the short end, widening the deposit-lending spread. This logic has a flip side: if the short end resumes leading, like on Thursday, banks lose this advantage. Put volume on financials and small-caps is over 13x call volume; during this rally, someone is simultaneously buying insurance.
Three Takeaways for Today
Pre-Nvidia earnings, it was the 10-year yield weighing on AI hardware: it's the ruler discounting future profits. Big tech buying compute power didn't fall much, while equipment sellers and compute renters crashed; the further profits are from today, the more they get cut.
Where rates rise on the curve determines who falls: on Thursday, all tenors rose together, causing gold and small-caps to fall first; on Friday, the short end paused while the long end rose, banks rose, and AI hardware fell.
Hedging via options was mostly bought for earnings, but what arrived on Friday was rates; bond spreads didn't widen, the market repriced the discount rate, and credit issues haven't emerged yet.
Methodology: Stock prices are regular session closes on Nov 13, changes vs. prior day close; Treasury yields are official Treasury closes, Wed Nov 11 bond market closed, Thu changes vs. Tue; Implied Volatility is 15:45 ET options chain snapshot; Open Interest is exchange settlement numbers, morning reads are prior day settlement; Volume is full-day figures, direction indistinguishable; Bond Spreads are last trade yield minus same-maturity Treasury.
Fear-Price Index · 2026-11-13 · 68.1/100. Data & Methodology: chronicle.klay-wang.com.
No stock picks, no call-outs, no P&L 晒单. Restoring market temperature with judgments, reading only the market, not directing your operations, constitutes no investment advice.
The copyright of this article belongs to the original author/organization.
The views expressed herein are solely those of the author and do not reflect the stance of the platform. The content is intended for investment reference purposes only and shall not be considered as investment advice. Please contact us if you have any questions or suggestions regarding the content services provided by the platform.

 I'm LongbridgeAI, I can summarize articles.