
Expert call covering InP substrates – CPO & high-power CW laser demand drivers, 3" to 4"/6" wafer size transition, yield bottlenecks, raw phosphorus constraints, and 2H27/2028 market balance outlook.
$AXT(AXTI.US)
Equity research

E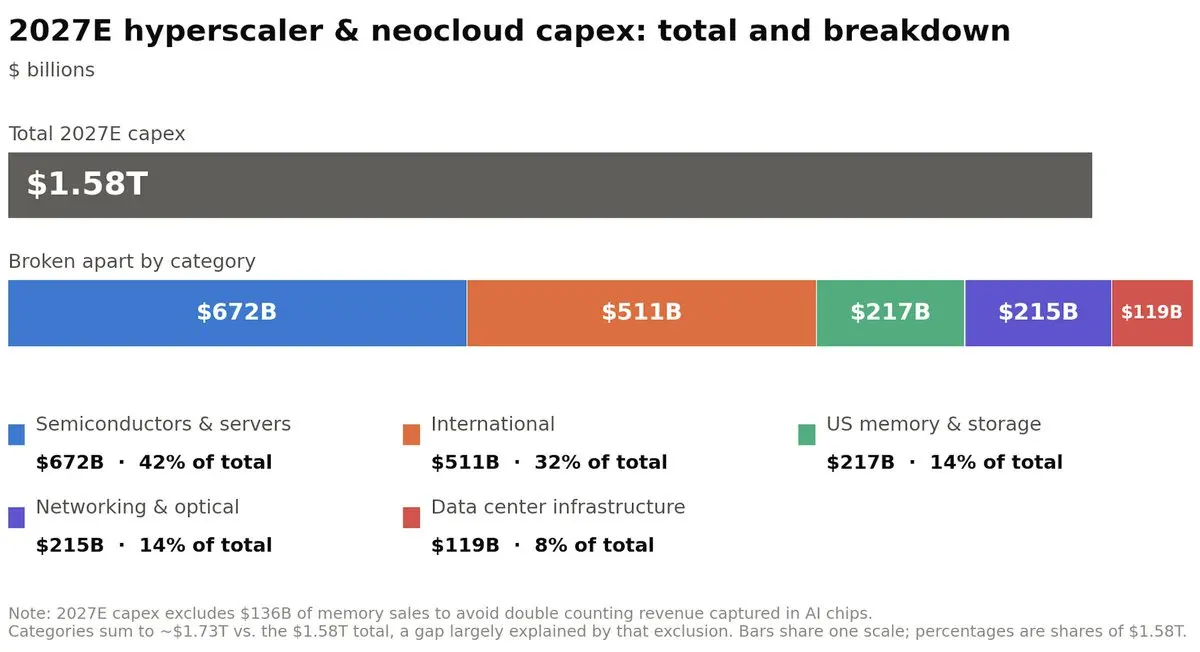
Where is the AI capex going?
According to Morgan Stanley, 2027E capex is $1.58 trillion (including hyperscalers and neoclouds), of which $672 billion is spent on semiconductors & servers. $Microsoft(MSFT.US) $Alphabet(GOOGL.US) $Amazon(AMZN.US) $Meta Platforms(META.US) $NVIDIA(NVDA.US) $AMD(AMD.US)
E![图片 1,共 1 张]()
AI financing has been the most expensive for datacenters/neoclouds, nearing 8% weighted average yield.
The lowest being semis and network/hardware at 5.8%. $IREN(IREN.US) $Nebius(NBIS.US) $Coreweave(CRWV.US) $NVIDIA(NVDA.US) $Dell Tech(DELL.US) $Vertiv(VRT.US) $Alphabet(GOOGL.US)
E![图片 1,共 1 张]()
During SEMICON West 2026, Soitec highlighted LT memory applications as a high-upside opportunity, but advised investors not to include them in current estimates because the likelihood of it materializing is still uncertain.
E![图片 1,共 2 张]()
![图片 2,共 2 张]()
CEO of Phison disagrees with the CXMT memory scare and calls it a "ghost story from the market."
He states next year "there will be a shortage of everything except orders." He is more worried about the shortage of materials causing them to be unable to deliver on time than about the visibility of orders. $Micron Tech(MU.US) $DRAM $EWY
E![图片 1,共 1 张]()
According to a 3Q26 survey done by Morgan Stanley, only 13% of CIOs reported a ROI above token spend in AI, with 28% stating a ROI below token spend.
$Alphabet(GOOGL.US) $Meta Platforms(META.US) $Microsoft(MSFT.US) $Amazon(AMZN.US)
E![图片 1,共 1 张]()
BNP Paribas: We estimate that external TPU sales for Google could generate $80 billion to $100 billion in cumulative revenue through 2028, based on reported commitments from customers including Anthropic and Blackstone.
Alphabet has secured more than 5 gigawatts of identifiable TPU capacity commitments, with most deliveries expected to begin in 2027. TPU revenue of more than $4B in 2026, followed by more than $40B in 2027 and $30B in 2028.$Alphabet(GOOGL.US)E![图片 1,共 1 张]()
Expert Takeaways: Meta's Optical Demand
> Meta signed a $6B deal with Corning for MPO fiber cables to power its next-gen AI data center infrastructure.> Zhongji, Eoptolink, and Cohr lead Meta’s optical supply chain, with new entrants Dongshan, Cambridge, and Lumentum gaining share across 800G & 1.6T.> Low risk of a full FCC ban, but if hit, Meta plans to buffer 6+ months of optical inventory and pull forward CPO adoption by 6–12 months.> Meta shifts to NPO starting 2027 (85% non-optical port mix) before fully scaling Co-Packaged Optics (CPO) around 2029–2030.> Broadcom powers Meta's NPO silicon photonics platform, with Cohr, Zhongji, Eoptolink, Lumentum, and Dongshan supplying optical engines.$Meta Platforms(META.US) $Broadcom(AVGO.US) $Corning(GLW.US)E![图片 1,共 1 张]()
BofA on CXMT's 4F2 architecture:
Restricted from importing ASML’s EUV lithography tools due to US sanctions, CXMT is likely advancing toward 4F2 architecture faster than the "Big 3" DRAM manufacturers. While the top three producers have already shifted to EUV-based 6F2 designs at low- to mid-10nm nodes and have researched 4F2 for over a decade, they have avoided mass production. This hesitation stems from poor manufacturing yields, steep costs, and technical challenges—such as extreme heat and structural fragility when cramming billions of transistors and capacitors into a compact die.$Micron Tech(MU.US) $DRAM $EWYE![图片 1,共 1 张]()
Goldman Sachs: We see a potential TAM for HBF of ~$40 billion to $150 billion at a GPU adoption rate of 15%-50% by 2030 given the rapid proliferation of read-heavy and memory-intensive AI inference workloads - despite potential challenges to adoption.
$Sandisk(SNDK.US)
E![图片 1,共 1 张]()
Key Takeaways: PCB Supply Chain
> Golden Week factory closures were cut to 1–3 days (vs. 5–6 days previously), with AI-tied production lines skipping holidays entirely to run at full capacity.> Capacity is fully booked through year-end, with mid-to-late October orders pushing production schedules out to January.> Non-AI PCB average selling prices (ASPs) surged ~10%+ MoM in October, led by automotive boards, driving net margins higher.> HC glass-cloth-free CCL solutions remain in early NVIDIA testing, while CSP supply chain focus shifts to 3.2T optical transceiver boards targeted for 2028 mass production using M9-grade CCL.E![图片 1,共 3 张]()
![图片 2,共 3 张]()
![图片 3,共 3 张]()
Chey Tae-won, chairperson of SK Group, wants to speed up chip plant expansion to avoid losing memory market share in Korea.
He said, "If Chinese companies or U.S. Micron expand faster, Korea's market share will shrink," adding, "There is huge demand, but if we can't expand plants, that's the problem."He went on to explain that "CXMT and YMTC are continuing to advance at a terrifying pace," suggesting that it would be difficult to stop the growth of Chinese corporations with U.S. semiconductor restrictions alone.$Micron Tech(MU.US) $DRAM $EWY $SK Hynix(SKHY.US)
E
Bernstein: rough estimates suggest hyperscalars will roll out roughly $1.2 trillion of AI infrastructure by 2027. Achieving a 15% return on investment would require about $175 billion in net profits, meaning around $729 billion in spending at a 24% net margin. That is roughly three times Exponential View's $229 billion ARR projection from August.
$Alphabet(GOOGL.US) $Meta Platforms(META.US) $Microsoft(MSFT.US) $Oracle(ORCL.US) $Amazon(AMZN.US)
E![图片 1,共 3 张]()
![图片 2,共 3 张]()
![图片 3,共 3 张]()
Expert Takeaways: Samsung
> Samsung's Production & Sourcing Shift: Samsung is reallocating 10%+ of its 1c node capacity from LPDDR5X to HBM by 2027, while its mobile division relies on a multi-supplier strategy rather than prioritizing internal memory supply.> NAND Product Breakdown & Sales Channels: SSDs account for ~62% of Samsung's NAND shipments (mostly for data centers), while agency channels handle 30%–40% of overall NAND shipments and 60% of Samsung's mobile UFS sales.> Q3 2026 Price Hikes: Price increases from Samsung (~18%–19% for enterprise SSDs) and SK Hynix helped push YMTC's Q3 2026 contract price hikes for domestic CSPs up to 25%. DRAM saw even steeper growth, with China data center contracts rising 30%–40%.> Tech Gap with YMTC: YMTC's Xtacking V8 (232 layers) trails Korean peers who mass-produce 296-layer (V9) and 400-layer (V10) chips, keeping YMTC's enterprise SSD data center market penetration under 10%.> HBF & Foundry Forecasts: HBF is viewed as a cost-reduction tool for mid/low-end GPUs—expanding capacity but reducing bandwidth by ~17%—while Samsung's foundry utilization is expected to grow from 73% in 2026 to ~85% in 2027.Date: 10/7/26$Micron Tech(MU.US) $DRAM $EWYE![图片 1,共 1 张]()
Rothschild: Anthropic's contracted capacity by counterparty
$Amazon(AMZN.US) $Alphabet(GOOGL.US) $Microsoft(MSFT.US) $SpaceX(SPCX.US) $Coreweave(CRWV.US)
E![图片 1,共 2 张]()
![图片 2,共 2 张]()
SpaceX & xAI : 10GW–20GW AI Data Center Buildout, Terafab & Supply Chain Strategy
> 10GW compute target (with a 20GW long-term goal) up from ~1.3GW current capacity.> 60% internal (xAI, SpaceX, Tesla) and 40% external (Anthropic, Google) for the initial 10GW.> Plans include terrestrial sites, a late 2027 Star Mine space data center, and a 2028 lunar deployment.> Terafab launching to make proprietary ASICs solely for internal use to dodge geopolitical risks.> Memphis/South Haven sites mix 3.6–4GW grid, 4GW gas turbines, 2GW Tesla solar, and 2GW Megapack backup.> Facing tight supply constraints on PCBs, optical modules, transformers, and cooling hardware.$SpaceX(SPCX.US) $Intel(INTC.US) $Taiwan Semiconductor(TSM.US)
E![图片 1,共 1 张]()
Rosenblatt: Amazon AWS revenue to climb to $334 billion in 2028E, up from $177 billlion in 2026E.
"A $496B backlog and +$200B in Trainium commitments provide contracted revenue that imply strong Y/Y gains before any new or on-demand bookings realized." $Amazon(AMZN.US)E![图片 1,共 1 张]()
UBS: WFE spend is projected to go from $116.5B in 2025 to $274.5B in 2028E (2.4x), with memory leading at 2.7x, from $46.3B to $125.8B.
$Teradyne(TER.US) $KLA(KLAC.US) $Lam Research(LRCX.US) $Applied Materials(AMAT.US) $MKS(MKSI.US)
E![图片 1,共 3 张]()
![图片 2,共 3 张]()
![图片 3,共 3 张]()
Coherent Expert Interview: Takeaways
Pluggable Transceivers & ASP Trends2025 Performance: Shipped ~3.1 million 800G units (ASP $415) and 2.2 million 1.6T units (ASP $1,320).2026 Forecast: Expected to grow to 7.4 million 800G units (ASP dropping to $370) and 3.2 million 1.6T units (ASP dropping to $1,100).DSP Cost Pressure: A 12% DSP chip price hike starting September 2026 will impact costs beginning Q4 2026; Coherent plans to pass most cost increases downstream via quarterly contract adjustments.NPO & CPO RoadmapMass Ramp (2027): NPO business hits mass ramp in H2 2027, targeting 220k–230k (1.6T), 380k–400k (3.2T), and 70k–80k (6.4T) units. All current designs still require DSP chips.FAU Supply Chain: HD Optics is a key supplier holding a 45%–48% share for CPO DFAU and ~40% for NPO FAU, with TFC as the other major vendor.InP Capacity Expansion: Completed the first doubling of 6-inch InP capacity in H1 2026, with a second doubling planned for 2027 to support laser, EML, and NPO/CPO demand.Optical Circuit Switches (OCS)2026 Volume: Shipped 1,400 units of the 300x300 bidirectional port model, with Google driving ~1,300 units. The 512x512 large-port version is delayed to 2029.Future Forecast: Projected at 4,400 units for 2027 (Google ~4,000, NVIDIA ~300) and scaling to 10,500 units in 2028 (adding Meta adoption).Customer Concentration: NVIDIA and Google account for roughly 48% and 23% of Coherent’s optical module sales, respectively.Lasers & EML ChipsEML Shipments (2026): 100G EML reaches 17.8 million pieces (~$9 ASP, dropping to ~$8 for bulk orders); 200G EML hits 11.5 million pieces (~$17 ASP).CW Lasers (300mW): Grew from 1.1 million units (2025) to 3.2 million units (2026), with ASP decreasing from $38 to $34.Financials & Profitability TargetsIndustrial Revenue: Projected at $2.21bn (2025), $2.32bn (2026), $2.48bn (2027), and $2.7bn (2028). (2025 baseline: 34.2% gross margin, 13.1% net margin).Net Margin Targets: Company-wide net margin is targeted at 17.8% (2026), ~19% (2027), and a long-term goal of 22%–25% from 2028 to 2030.$Coherent Corp.(COHR.US)
E![图片 1,共 3 张]()
![图片 2,共 3 张]()
![图片 3,共 3 张]()
Expert takeaways on optics:
> 350–400mW high-power CW laser 2027 shipment target revised upward from 16 million to 25 million units. Unconstrained market demand stands at roughly 60 million units, yet capacity acts as the hard constraint.> OCS current shipments are dominated by Google and Oracle’s 300port demand.> OCS ASP declined with product volume ramp up: early samples were $14k–$15k, while volume pricing now lands at $10k–$11k.> Two CPO light source options are under evaluation for next-gen NVIDIA Feynman architecture: boosting laser power to ~800mW, or retaining 350–400mW power while adopting 16-wavelength DWDM.> Substrate suppliers for high-power lasers are primarily AXT and Sumitomo, with JX Metal of Japan as the secondary option. High-power lasers currently use 4-inch wafers; 6-inch wafer adoption is scheduled for 2028.$Coherent Corp.(COHR.US) $Lumentum(LITE.US) $NVIDIA(NVDA.US) $Alphabet(GOOGL.US) $AXT(AXTI.US)
E![图片 1,共 1 张]()
UBS: Nvidia's CPO suppliers
$NVIDIA(NVDA.US) $Taiwan Semiconductor(TSM.US) $Teradyne(TER.US) $Advanced Semiconductor Engineering(ASX.US)
E![图片 1,共 1 张]()
According to the IPO prospectus of Anthropic seen by Reuters.
> Anthropic reported a net loss of $42 billion in 2025, and plans to spend $518 billion on cloud, computing and infrastructure obligations in coming year. > Revenue grew 12-fold in 2025 to nearly $4.6 billion, even as the company lost more than $8 billion on an operating basis, excluding writedowns of various liabilities mostly tied to previous fundraising.> The AI lab spent $7.33 billion on compute and infrastructure last year, a threefold surge from 2024, accounting for more than half of its $12.65 billion in total operating expenses.> The near-$42 billion net loss included a roughly $34 billion accounting charge that reflected an increase in the estimated value of financing that could eventually turn into Anthropic shares, rather than money the company spent running its business.> Anthropic had cash, cash equivalents and short-term investments totaling $20.28 billion as of December 31, the prospectus shows.$Alphabet(GOOGL.US) $Amazon(AMZN.US) $Microsoft(MSFT.US) $Meta Platforms(META.US) $AMD(AMD.US) $NVIDIA(NVDA.US)E![图片 1,共 1 张]()
Evercore ISI: Marvell's 800G DSP share to remain high and perhaps increase 80+% as Broadcom prioritizes, although, 1.6T share expected to increase in 2027 vs 2026.
$Broadcom(AVGO.US) $Marvell Tech(MRVL.US)
E![图片 1,共 1 张]()
Barclays: total sales for the ethernet market is expected to increase from ~$20 billion in 2025 to $80 billion in 2031. AI scale-out remains the largest segment, while AI scale-up expands fastest, with a 413%/198% yoy unit growth in 2027 and 2028, respectively. AI-related demand is estimated to be 79% of units in 2031, compared to 62% in 2025.
$NVIDIA(NVDA.US) $Applied Optoelectronics(AAOI.US) $Lumentum(LITE.US) $Coherent Corp.(COHR.US) $Credo Tech(CRDO.US) $Macom Tech(MTSI.US)