

Valuation analysis

- P/E
- Price
- High
- Median
- Low
- P/B
- Price
- High
- Median
- Low
- P/S
- Price
- High
- Median
- Low
- Dividend Yield
- Price
- High
- Median
- Low
Institutional View & Shareholder
Analyst Ratings
- Price--
- Highest--
- Lowest--
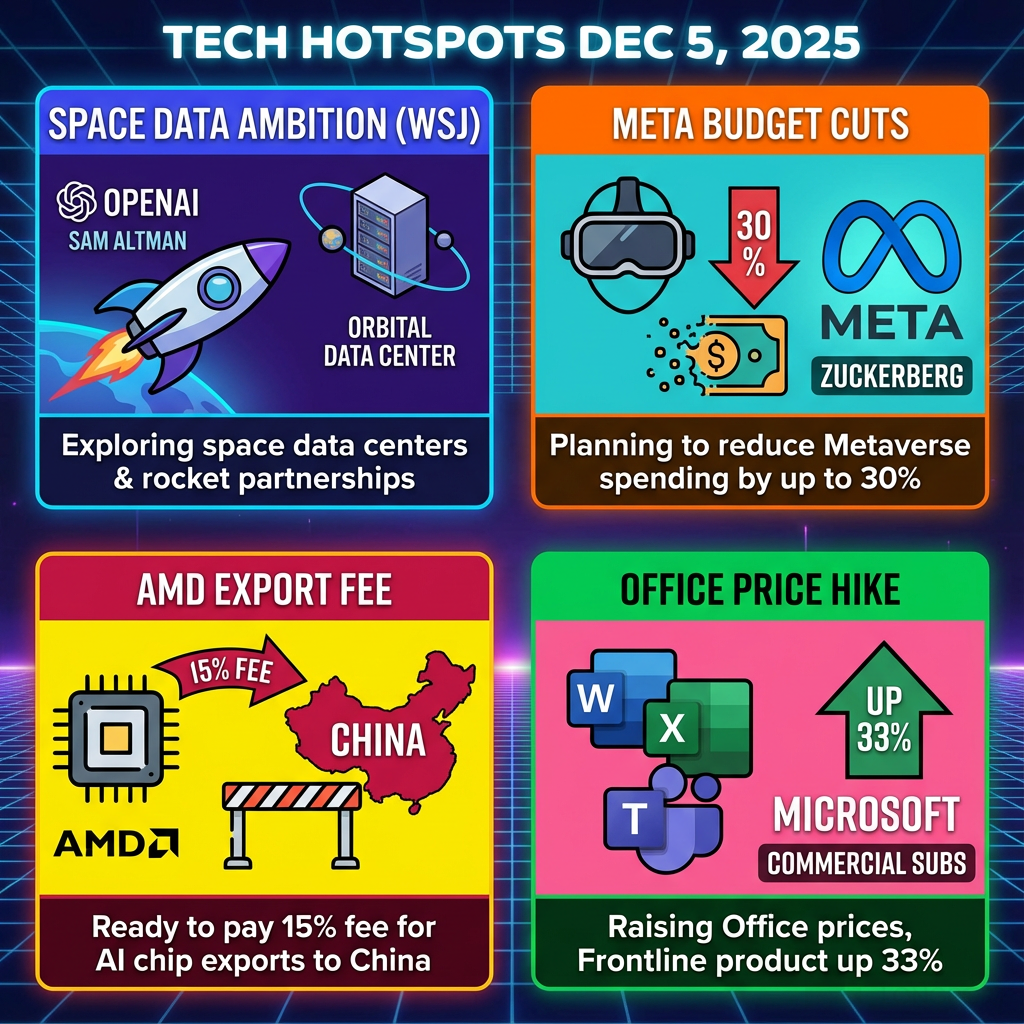
Hey investors — while Asia slept, US tech headlines brought some bold shifts. Here’s your snapshot:🛰️ OpenAI Eyes Space Data CentersWall Street Journal reports Sam Altman has repeatedly shown interes...
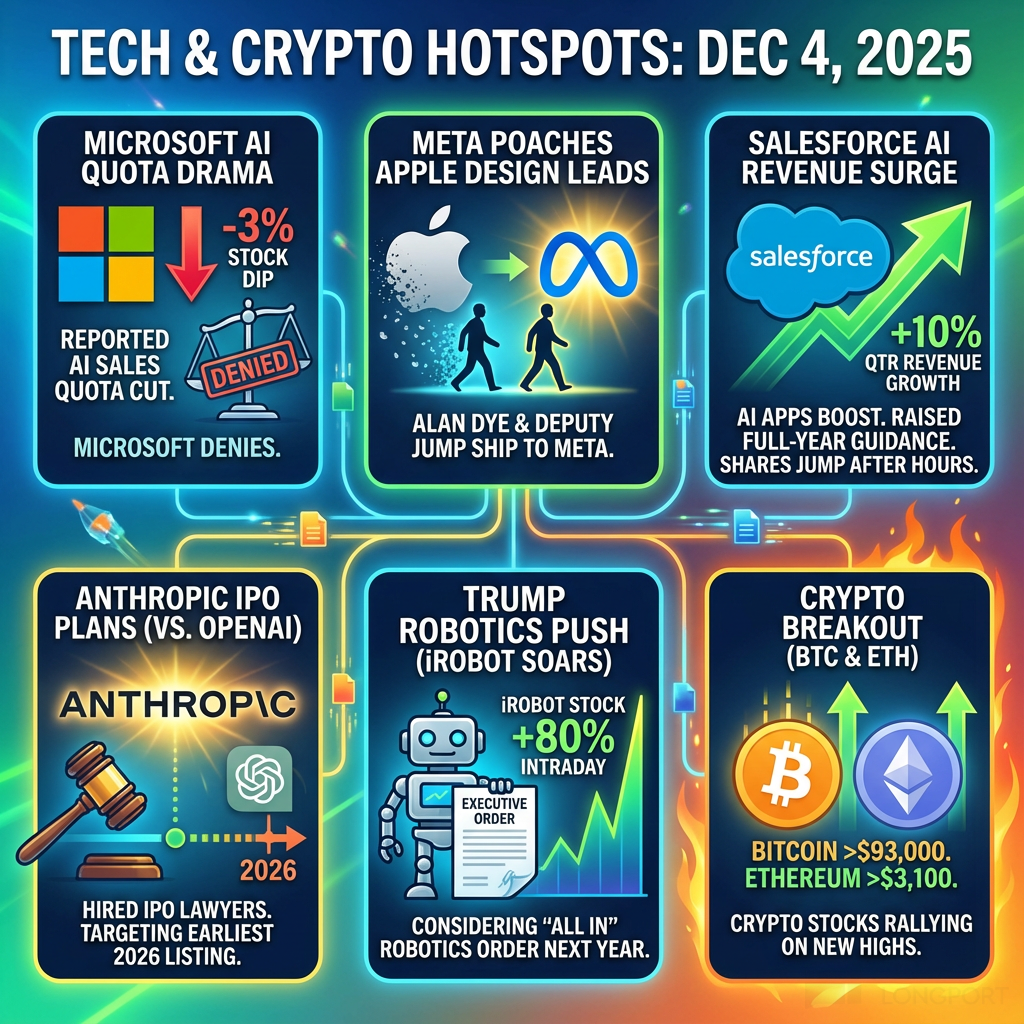
💤 While Singapore slept, the U.S. markets were buzzing with some major moves. Here’s your quick but juicy rundown of what happened and what it could mean for your watchlist:
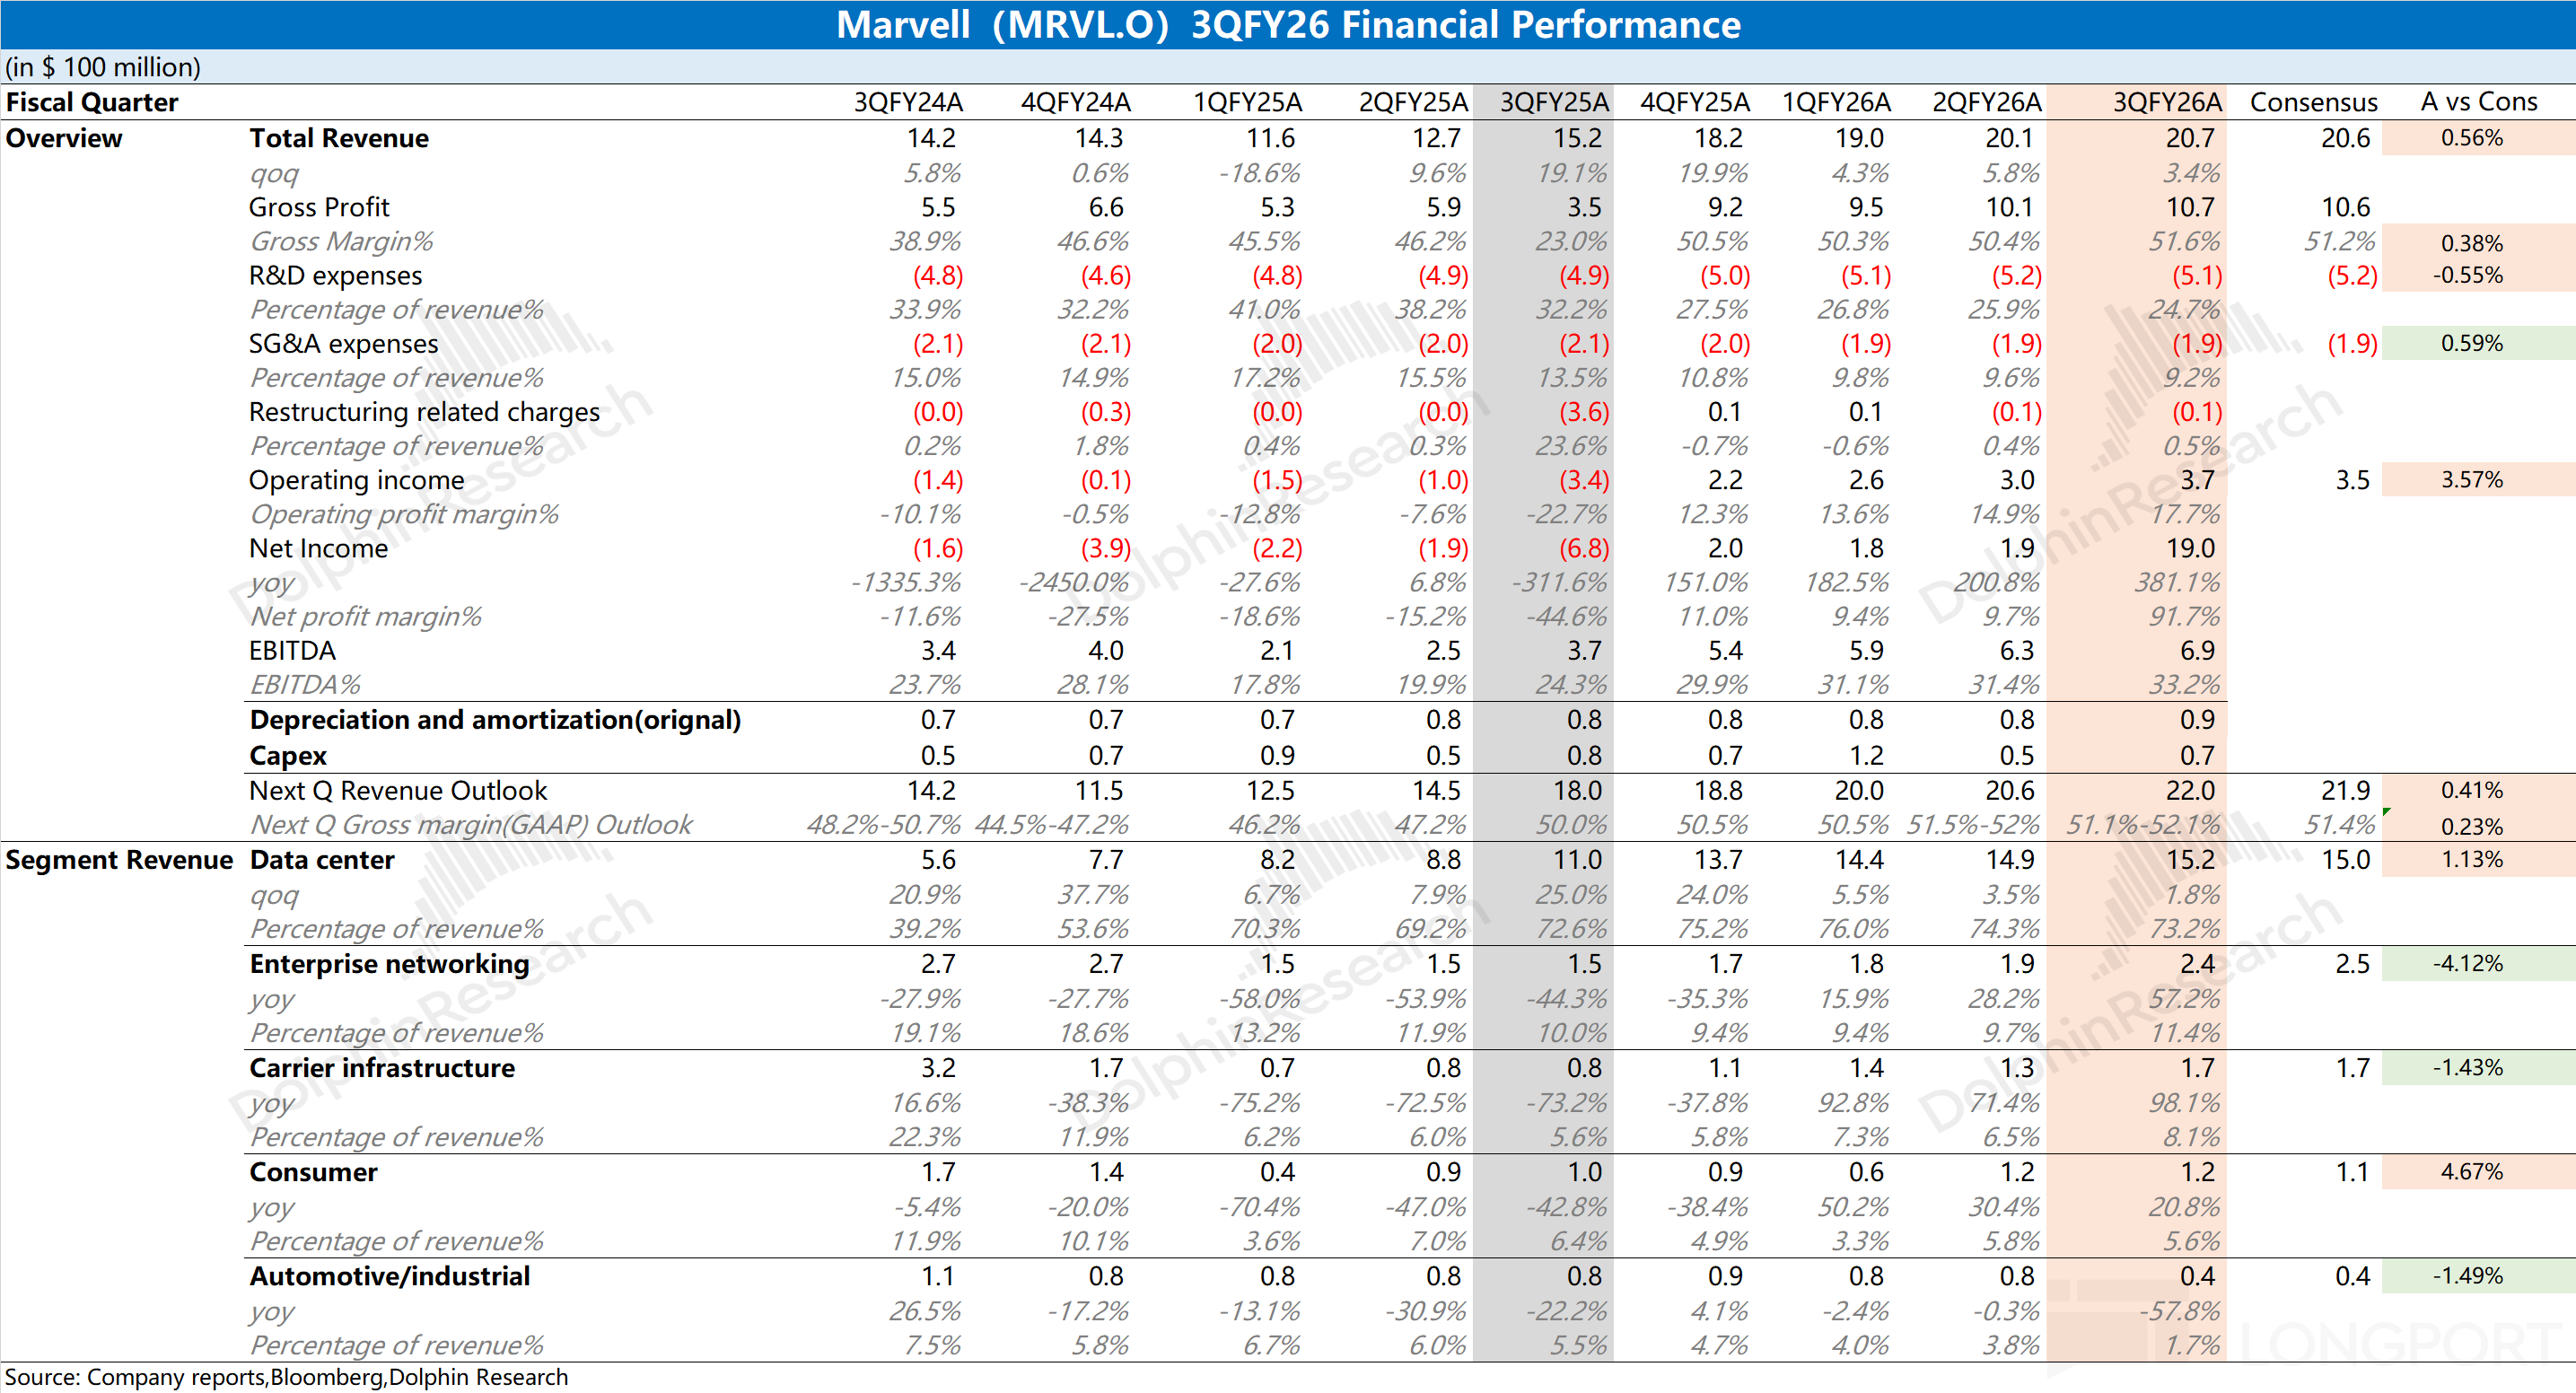
Marvell Technology (MRVL.O) released its third-quarter financial report for fiscal year 2026 (ending October 2025) in the early morning of December 3rd, Beijing time, after the U.S. stock market close......

+6
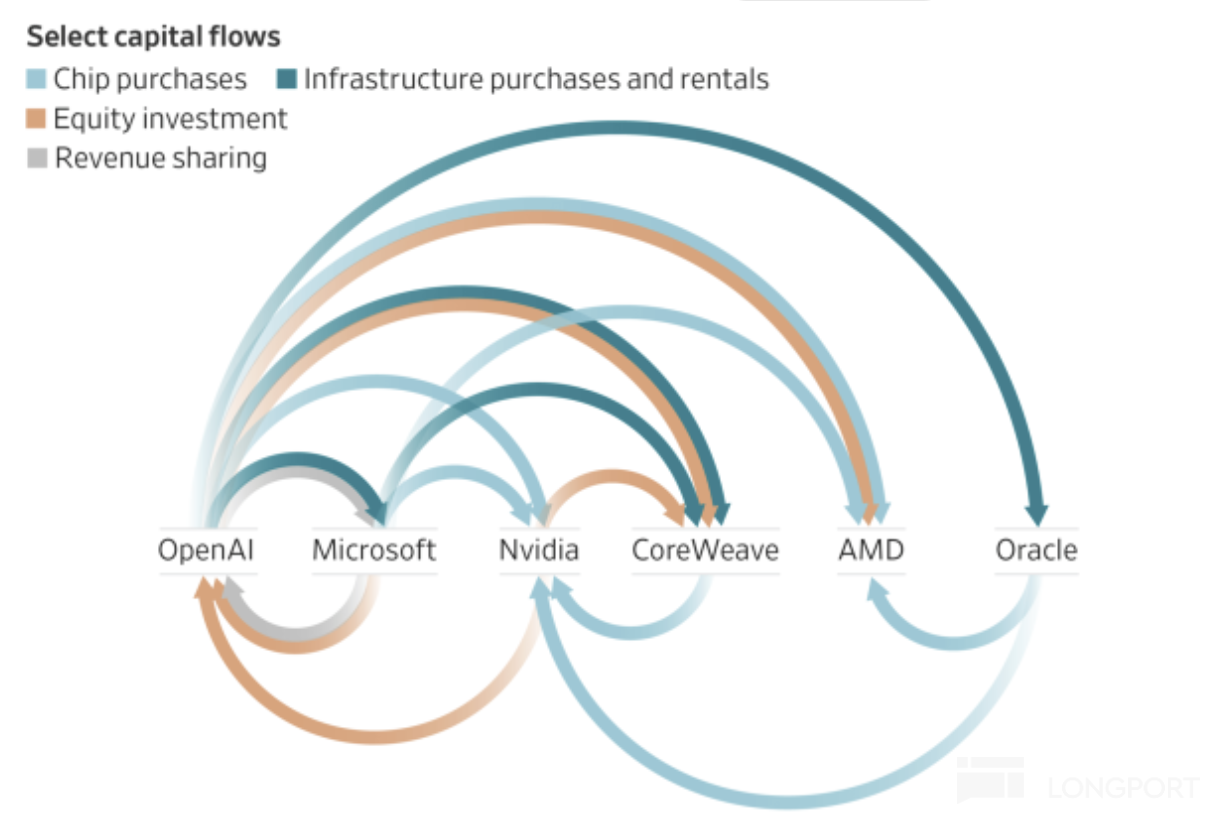
Marked by the release of ChatGPT at the end of 2022, the AI frenzy over the past three years has swept through every sector, from computing power, storage, networking, manufacturing, power infrastruct...

 +6
+6