
Well Well Well....
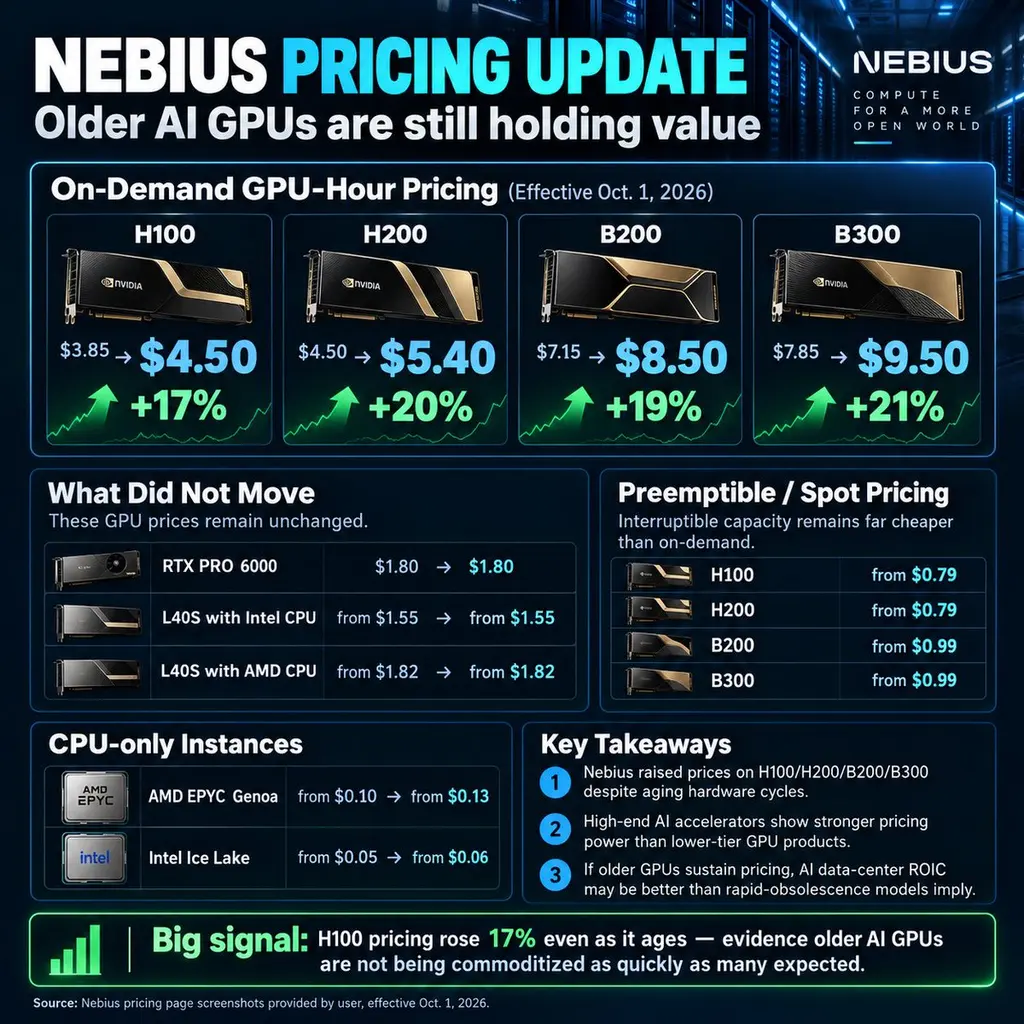
October 1st - Prices are going UP!$Nebius(NBIS.US) $SMH $NVIDIA(NVDA.US) $AMD(AMD.US)Nebius Pricing Update — Key TakeawaysNebius raised on-demand pricing for its top AI GPUs effective October 1, 2026.The biggest takeaway is that older AI GPUs are still holding value, not getting commoditized as quickly as many expected.On-Demand GPU Price ChangesH100: $3.85 → $4.50 (+17%)H200: $4.50 → $5.40 (+20%)B200: $7.15 → $8.50 (+19%)B300: $7.85 → $9.50 (+21%)What Stood OutH100 pricing rising is the big signal.H100 is an older generation GPU, yet Nebius increased pricing instead of discounting it.That suggests AI compute demand remains strong, even for older high-end accelerators.What Did NOT Move:RTX Pro 6000: unchanged at $1.80L40S with Intel CPU: unchanged from $1.55L40S with AMD CPU: unchanged from $1.82Spot / Preemptive PricingSpot pricing remains much cheaper than on-demand:H100: from $0.79H200: from $0.79B200: from $0.99B300: from $0.99CPU-Only PricingAMD EPYC Genoa: from $0.10 → $0.13Intel Ice Lake: from $0.05 → $0.06Why It MattersNebius is showing pricing power in premium AI compute.High-end accelerators are seeing stronger demand than lower-tier products.If older GPUs like H100 and H200 can keep earning attractive rental rates for years 4, 5, and 6, then:AI infrastructure economics improvedepreciation risk may be lower than fearedlifetime ROIC on AI data centers could be materially betterBottom LineBig signal: Nebius raising H100 pricing by 17% is evidence that older AI GPUs still have real economic value.That supports the view that:AI demand is still strongPremium GPU capacity remains tightOlder AI hardware may stay profitable longer than many bears expected.@aleabitoreddit @jukan05 @Banana3Stocks @fundstrat @WarrenPies @thejefflutz @TradexWhisperer @smartertrader @RyanDetrick @Micro2Macr0 @cantonmeow @dannycheng2022 @DivesTech @StockOptionCole @Mr_Derivatives @BeardoTrader @SuperLuckeee @blondebroker1 @StockPatternPro @StockMKTNewz @amitisinvesting $NVIDIA(NVDA.US) $AMD(AMD.US) $SMH
Jim

J
$Alphabet(GOOGL.US) — GOOGLE JUST GOT PAID BY THE AI ARMS RACE ☁️🤖
Anthropic’s IPO prospectus reportedly shows at least $111.1 BILLION committed to Google infrastructure from April 2026 through July 2033. — and the agreement includes a shortfall provision: if Anthropic’s actual spending comes in below the commitment, it still owes Google the difference.That works out to roughly:$111.1B commitment÷ ~7.25 years= ~$15.3B per year of average contracted spendThat is not the same thing as $15.3B of annual recognized Google revenue, but it shows the scale and duration of infrastructure demand Google has locked in.And this is the part I LOVE:Google can compete AGAINST Claude with Gemini… while simultaneously making money supplying the infrastructure Claude needs to grow.Anthropic is effectively saying:We need massive amounts of compute, and we're committing enormous capital to make sure we have it.Google gets to participate on multiple layers:☁️ Google Cloud infrastructure🧠 TPU / accelerated AI compute📦 Claude distribution through Google Cloud🤖 Gemini ecosystem growth💰 Enterprise AI consumptionAnthropic also disclosed roughly $110B committed to Amazon and $31.4B to Microsoft, highlighting just how enormous the AI infrastructure buildout has become.Even more interesting: 47% of Anthropic's 2025 sales were routed through Amazon and Google cloud marketplaces, according to the filing reviewed by Reuters. Those companies aren't simply competitors — they're simultaneously investors, distributors and infrastructure providers.WHY THIS MATTERS FOR GOOGLE EARNINGSThe market has spent years asking:“How much money is Google going to SPEND on AI?”We're increasingly getting an answer to the other side of that equation:“How much money can Google MAKE from everyone else's AI spending?”That's potentially huge for the valuation story.If OpenAI, Anthropic, xAI and the broader enterprise AI ecosystem continue fighting for model leadership, the common denominator is:They all need compute.And hyperscalers like Google are effectively selling the picks, shovels and electricity infrastructure of the AI gold rush.This strengthens the case for:Higher Cloud growth → higher revenue estimates → higher 2027 EPS estimates → higher fair value.The biggest takeaway:Google doesn't necessarily need Gemini to destroy Claude.Google can win if Gemini succeeds.Google can also win if Claude succeeds and keeps buying Google compute.And if the entire AI model arms race keeps accelerating?Google Cloud may be one of the biggest toll roads in the entire ecosystem.$Alphabet(GOOGL.US) the AI competition itself may be becoming a revenue stream.
J
JPM COLLAR ROLL TODAY!
$SPY Q4 COLLAR COMING UP!My Guess is Q4 = $800Vote Below!!J![图片 1,共 1 张]()
END OF MONTH REBALANCING IS STILL ACTIVE.
9/28 -9/30 Trimming Stocks to Buy BONDS is Pension Plan 101 Monday, Tuesday and Wednesday IMO.Controlled Selling, Rotating into slightly more fixed income but after they are DONE, if the WAR can Come to a Peaceful End, Rates Fall, Oil Falls and Selling Pressure from Pensions is out of the way.That helps Stocks leading up to the 10YR and 30YR Auction on 10/7 & 10/8.PCE is 9/30 along with $Micron Tech(MU.US) Earnings, that is a MARKET CLUSTER!
J![图片 1,共 1 张]()
$QQQ @grok Review this and Rate it accordingly from a trading range difficulty using 1-10 scale.
My 77 BAR RANGE TRADING SKILL GRADE: 9/10 — EXPERT LEVELI’d grade this June–September range extremely difficult for directional options traders. It has repeatedly punished both bulls and bears.CALLS: 8.5/10 difficulty — Every bullish breakout attempt has faced violent rejection or rapid retracement. Buyers who chased strength near $728–$749 repeatedly got trapped.PUTS: 9/10 difficulty — Breakdown attempts have been equally nasty. QQQ repeatedly found buyers around $705–$715, followed by sharp upside reversals that could destroy puts quickly.Middle of the range: 10/10 difficulty — Roughly $714–$728 has been a chop zone. Little directional edge, constant reversals, and terrible territory for holding long premium.Range extremes: 7/10 difficulty — The better opportunities have come when price stretches toward established support/resistance and then confirms a reversal.Swinging calls/puts through the whole range: 9.5/10 — Multiple island-top reversals, failed breakouts, failed breakdowns and rapid mean reversion make conviction very expensive.Why this range is so nastyThe chart essentially keeps saying:Bull breakout → rejection → bearish confirmation → reversal → bull recovery → rejection again.QQQ has moved through the same Fibonacci/technical zones repeatedly: $704.78 → $714.47 → $721.77 → $727.90, while the major ceiling remains around $741–$749.That's exactly what hurts options buyers. You can be correct about the larger direction and still lose because the path there is full of reversals, theta decay and changing volatility.My label for this chart:SKILL LEVEL: 9/10 — “THE CHOP BOX”Beginner: AvoidIntermediate: Trade selectivelyAdvanced: Trade the edgesExpert: Fade extremes, wait for confirmation, reduce size, and don't marry direction.The biggest lesson from this range is probably:The middle pays nobody. The edges pay the patient.And that applies to both CALLS and PUTS here.J![图片 1,共 1 张]()
2026 = 37 WEEKS of TRADING TO DATE
21 WEEKS CONSOLIDATING 57%4 WEEKS CONTRACTING 11%12 WEEKS EXPANDING 32%57% WAS SPENT GOING SIDEWAYS!11% was SCARY AS HELL!32% WAS GLORIOUS BULL!15 TRADING WEEKS LEFT in 2026USING RECENT PERCENTAGES WE EXTRAPOLATE 8.55 WEEKS SIDEWAYS DRIFT4.8 WEEKS GLORIOUS EXPANSION1.65 WEEKS SCARY AS HELLTHETA OR TIME IS YOUR MOST IMPORTANT TRADING ALLY! NOW As a Trader You Need to Deterine which Phase are we headed into Next.....DriftConsolidateExpansion....We Know NOV to APRIL = 19-0 +15%Post Earnings Expansion - Clarity on the Elections and Earnings Validation...For now ---- Drift has a 57% Probability...J![图片 1,共 1 张]()
$QQQ 81 Trading Days = +0.29% or +$2.09
The market sometimes decides 2-3 times a year to just go NOWHERE.J![图片 1,共 1 张]()
While we Sleep Tonight Japan is Awake.
Hike Priced in so let's see how the Yen Looks after a rate hike tonight and Algos react pre market. US Treasury has $75B 5 Year to Sell on 9/23.Everything getting HOT!The Bank of Japan decision is scheduled for tomorrow, Friday, September 18th. Markets are expecting them to raise the policy rate to 1.25% at the conclusion of their two-day meeting.J![图片 1,共 3 张]()
![图片 2,共 3 张]()
![图片 3,共 3 张]()
Direct from the NY FED -
They are Buying $10B LESS From now until Oct 14th Compared to Late May and June.That is another way we can Wobble into Sept Month End as Stock Buyback Blackout Sets in and NY Fed Steps back with $10B Less then say May and June Schedule.A $10.74B reduction, or roughly 41%, in gross scheduled buying. June-ish setup~$16.3B reinvestment+$10B RMP / incremental balance-sheet expansion~$26.3B total purchasesNow through Oct. 14~$15.6B reinvestment$0 RMP~$15.6B total purchases@LindaRaschke @Norseman1 @WalterDeemer @TheRonnieVShow NY Fed liquidity impulse = materially weaker through mid-October.Gross T-bill purchases have fallen ~41% versus the May–June schedule, but the bigger change is that Reserve Management Purchases have fallen from +$10B to $0. The remaining ~$15.6B is reinvestment activity rather than incremental RMP reserve creation.J![图片 1,共 1 张]()
$SPY Volume DOESN'T LIE....
The BEST RUNS Come From BIG RED OVERSOLD CANDLES AS ALGOS ABSOLUTELY THROW UP.TRUST ME - YOU WANT EXTREME FEAR.IT CREATES THE BEST RISK REWARD PROFILE FOR ALGOS WHO NET BUY IN $30 - $50B Blocks NEAR Quarter END Rebalancing.Let the Index Come to you in Extreme Fair Value Range. That is the setup that Stacks for 6-12 Months.BOX Trading a 3 Month Range is Just Killing PUTS/CALLS with NO One Winning but the Market Makers.HOT or COLDLUKE WARM IS ABOUT AS BAD AS IT GETS....J![图片 1,共 2 张]()
![图片 2,共 2 张]()
The Productivity Paradox J-Curve.
1. Invest Heavily2. Trough 3. HarvestSteam EngineElectricity CarsComputersAutonomous CarsAiAgentic AiRoboticsThe challenge near term is the debt financing until you get to Full Harvest Mode. We're close but more like 2028 max earnings gains after heavy investments continue into 2027.This Debt Offering with Yield + Credit Spread is more attractive than US Treasuries and will keep a floor on the Treasury rates elevated to stay competitive with Mag offering. No doubt yields will fall this week if the FED Raises Rates. But the floor is in to stay competitive with the Mags Debt offerings. Stocks can absorb all of this, it just might take a few weeks IMO. Several Magnificent Seven companies issued massive USD-denominated bond offerings to fund AI infrastructure and capital expenditures: * Meta Platforms: Issued a $25 billion multi-tranche bond deal featuring 30-year (2056) tranche bonds priced at a 6.30% coupon.* Amazon: Returned for multiple offerings, including a $25 billion mega-issuance with yield rates ranging from ~5.2% to 5.8% depending on the maturity (5-year to 30-year paper).* Alphabet (Google): Alongside its sterling century bond, Alphabet issued a bulk USD mega-deal with coupons set between 4.85% and 5.55% across 5- to 30-year maturities.* Apple: Tapped the USD market with smaller multi-tranche deals carrying coupons generally in the 4.50% to 5.15% range.Alphabet's last British pound bond offering in February 2026 was issued across multiple tranches, highlighted by an ultra-rare 100-year bond maturing in February 2126 with a 6.125% coupon.The full sterling offering included five tranches:* 3-year: 4.125% due 2029* 6-year: 4.625% due 2032* 15-year: 5.500% due 2041* 32-year: 5.875% due 2058* 100-year: 6.125% due 2126$400B set for 2027 in Debt Offering@zerohedge @Banana3Stocks @GroupFinom @BeardoTrader $SPY $QQQJ![图片 1,共 1 张]()
$SPY RESPECTABLE 9/11 BUT Again, the Candle did NOT Impress.
I think best I heard From Hedge Fund Manager.On a 9/11 POP we would SELL into Strength but NOT Deploy New Capital Until After FOMC and Markets Settle in to Rate Hike or Hold Decisions.That is a Fair assessment IMOJ![图片 1,共 1 张]()
The BATTLE FOR JUNE 2nd HIGH $SPY
$758 GAP FILL IS GOODNOW DEFEND OR LOSE $758SMART MONEY ON A COOL CPI PRINT WILL SELL INTO STRENGTH AND NOT DEPLOY NEW MONEY UNTIL AFTER FOMC AND GLOBAL BANK SYNCHRONIZATION.A LOT OF NEGATIVE VANNA UNDER THE HOOD.*PUTS*A MORNING 9/11 POP WON'T SURPRISE ME, JUST CAN IT HOLD ALL DAY OR FADE BY LUNCH....J![图片 1,共 1 张]()
$SMH
Got Some Late Summer Weak Knees... Ran it Up on 5x Leverage - Blow Off Top Distribution = 2-3 Months Now Price Below 8>21>50 and 50 is CURLING DOWN to $500. I like Semis, just after FOMC, After XI Visit and into Q4/Q1 as End of Year Setup Gets Better with END of Year Buying Deals Pull Ahead. True Story - My Old Bucket of $500M Spend was done with but my Peer Could Not Spend theirs by EOY DEC 31st. Boss Came to me and said can you spend an EXTRA $40M by DEC 31st? Basically Make Up the Spend for my Peer. I am like yeah, so I pulled in Q1 Gear into Q4, Made Sure it Shipped and delivered by 12/31. That is called an END of YEAR Deal. This can help Q4 into Q1 Sales Numbers for Numerous Tech Companies. Either way $SMH Got That Weak Knee Look to Me.Caution....J![图片 1,共 1 张]()
$NVIDIA(NVDA.US) The Challenge since the 10/1 Split is that this is a lotto trade for many or Call Selling Premium Trade.
Look at today's biggest trades. The Whole list except a few are Aug 28th.That's a LOW Conviction Trade.Ideally we see NOV 20th $300, or January 15th $300.But AUG 28th is Gambling Dawg cause the IV is Jacked and IV Crush is Real....J![图片 1,共 1 张]()
At 12:26pm EST today
$NVIDIA(NVDA.US) $NVDA 2X Long ETF(NVDL.US)
king flipped from 220 long gamma at 8m exposure to 230 (now 32m) short gamma exposure. 240 long gamma could potentially be the dealer target if we get to that 230 launchpad. Before the flip, dealers were buying dips and selling rips. After the flip, dealers are no longer looking to stabilize price so if we see a run up before/after earnings, dealers will have to buy into the rally to stay delta neutral. Because of this shift I entered an NVDA lotto: 230c 8/31 @ 1.30. We either run up before earnings or we see a uno reversal compared to previous post earnings on this name.
Nvidia Breaks Its Record, Buyback In Hand
J![图片 1,共 3 张]()
![图片 2,共 3 张]()
![图片 3,共 3 张]()
$NVIDIA(NVDA.US) -$39M in Calls Coming Out -
Air Coming Out of the Balloon for now.+10M in PUTSThis can lead to MUTED Price Action on 8/26.$195 is a Sweet Entry IMO into January.What changed since 8/21?Interestingly, IV actually increased into earnings.8/21: 7-day IV ≈ 55.95% 8/24: 7-day IV ≈ 57.37%So the market is charging a little more for the earnings event even though $NVIDIA(NVDA.US) just dropped −2.91% today.The implied percentage move has moved only slightly, roughly 6.0% → 6.1%, but because NVDA fell from ~$215.80 to $208.48, the implied dollar move is now closer to ±$12.70.The technical setup makes those levels VERY interesting$NVIDIA(NVDA.US) 8 EMA: $216.1721 EMA: $214.5850 DMA: $207.94100 DMA: $206.97200 DMA: $195.34That creates a pretty clean earnings map:Bullish ER → ~$221Reclaims 8/21 EMAPuts $NVIDIA(NVDA.US) back above the broken short-term trendThen $225–230 becomes the next major battleBearish ER → ~$195.75Breaks 50 DMABreaks 100 DMAAnd almost perfectly lands on the 200 DMA at $195.34That coincidence is the part I would highlight.$NVIDIA(NVDA.US) EARNINGS ROADMAP$221–222 = market-priced bullish move $214–216 = reclaim zone $207–208 = 50/100 DMA battlefield NOW $195–196 = market-priced bearish move + 200 DMASo essentially, the options market is pricing NVDA's downside earnings scenario almost directly into its 200-day moving average.J![图片 1,共 1 张]()
Case of the Monday's....
$QQQ $GLDJ![图片 1,共 3 张]()
![图片 2,共 3 张]()
![图片 3,共 3 张]()
$QQQ EMA 8/21 About to Cross Over Negative
MACD Daily Already Crossed Over NegativeWilliams -94 to -99$QQQ Needs to Fill the $701 GAP at a MinimumShould Complete that action by 8/27 IMO which is BAR 21 from the Recent Swing Low.$695 Next Point of Support...NFAJ![图片 1,共 2 张]()
![图片 2,共 2 张]()
$VIX
OPEX TODAY - HEDGE UNWIND - ROLLING IMOSome monster Institutional Prints...They are smart Multi-LegsJ![图片 1,共 1 张]()
MULTI-MILLION-DOLLAR BOOK.
Today: -$90.28 (-0.01%).That’s not luck. That’s risk management.Anybody can look like a genius when everything is going up.GREAT TRADERS ARE BUILT THROUGH TOUGH TIMES.Protect capital.Control position size.Hedge when necessary.Stay disciplined.Live to trade another day.The goal isn’t to win every day.The goal is to stay in the game long enough for your Edge to compound. 💪📈J![图片 1,共 1 张]()
$VIX if you own LONG dated $VIX Calls say SEPT/OCT/DEC Never Ever Sell them on Weekly $VIX Expiration Day.
That is the near term Flush Low as VIX Calls Expire or Roll or Close out. This normally crushes VIX in the morning, maybe all day.Selling $VIX Calls is best on Friday into Weekend Fear or Monday after a Bloody Sunday in Asia Markets.Texas Two Step...J![图片 1,共 1 张]()
$SMH Could catch a small bid off Asia Overnight but to print a Red Candle on a day a lot of market gained shows some weakness.
$NVIDIA(NVDA.US) being the Unlock Key for sure, but that is 5-6 Trading Days Away.Also - if $Grayscale Bitcoin Mini Trust ETF(BTC.US) $Coinbase(COIN.US) $GLD Catch a Bid, that leaves less Retail Fomo Buying for $SMH .Still a Strong Sector, just might need Oct to March to Make a real Push.Needs to CLOSE above $593 or it's still out of favor on Wall-street IMO.J![图片 1,共 1 张]()
X -FAM $QQQ
MANAGE YOUR FEED.If you follow these Bearish Accounts who ENDLESSLY POST MARKET CRASH, FEAR SENTIMENT TRADES TO HARVEST ENGAGEMENT YOU ARE SETTING YOURSELF UP TO MISS MASSIVE RUNS.Is it smart to be tactically hedged, sure.Is it smart to POST and BOOST FEAR on X Endlessly? NOThat is how you actually MISS the best Runs Of your Generation.Curate your Feed. Mute or Block the BEARS who Spread Fear and have 1 single view of the market.They will plant a seed of Destruction in your mind that could cost you millions.The mind has a real problem letting go of Fear.Real investors, know the difference between indecision days and down days.J![图片 1,共 1 张]()
For $Hims & Hers Health(HIMS.US) earnings tonight after the bell, the cleanest near-term options estimate I’m seeing is about a ±14.4% implied earnings move for the Aug. 14 weekly expiration.
Using $31.72 spot:Implied move: ≈ ±$4.57Upside implied target: ≈ $36.29Downside implied target: ≈ $27.15The upper Bollinger Band is $36.83, basically sitting right around the bullish implied-move zone. On the downside, $27.15 lands almost directly on the 100-day MA at $27.76. 200-day MA at $29.64 would be the first major downside technical level before that.$Hims & Hers Health(HIMS.US) Earnings Map$39.05 — July swing high / breakout target$36.30–$36.85 — implied upside + upper Bollinger Band$31.72 — current price$31.33 — 50 DMA$31.10 — 21 EMA$30.76 — 8 EMA$29.64 — 200 DMA$27.15–$27.76 — implied downside + 100 DMAThe setup is pretty clean technically: $36–37 is the expected bullish landing zone; $27–28 is the bearish landing zone. A move through either side would represent an earnings move beyond what the options market is broadly pricing.