Company Encyclopedia
View More
Informatica
INFA.US
Informatica Inc. develops an artificial intelligence-powered platform that connects, manages, and unifies data across multi-vendor, multi-cloud, and hybrid systems at enterprise scale worldwide. Its platform includes a suite of interoperable data management products, including data integration and engineering products to ingest, transform, and integrate data; API and application integration products that enable users to create and manage APIs, application integration, and process automation to modernize and accelerate their digital transformation programs, as well as for application-to-application synchronization, business process orchestration, B2B partner management, application development, and API management; data quality and observability products to profile, cleanse, standardize, observe, and monitor data to deliver accurate, complete, and consistent data; and master data management products to create an authoritative single source view of business-critical data. The company’s platform also includes customer and business 360 application that allow business analysts to create 360-degree views of business data domains, such as customer, product, supplier, reference, and finance with business user experiences; data catalog products that enables customers to find, access, and understand enterprise data using Google-like search experience; governance, access, and privacy products, which enables organizations to deliver and consume trusted and protected data across the enterprise; and a data marketplace that delivers cloud shopping experience for data consumers and enables data sharing and AI models across organizations to facilitate data-driven decision making.
2.728 T
INFA.USMarket value -Rank by Market Cap -/-
Valuation analysis

P/E
1Y
3Y
5Y
10Y
P/E
-
Industry Ranking
-/-
- P/E
- Price
- High
- Median
- Low
P/B
1Y
3Y
5Y
10Y
P/B
-
Industry Ranking
-/-
- P/B
- Price
- High
- Median
- Low
P/S
1Y
3Y
5Y
10Y
P/S
-
Industry Ranking
-/-
- P/S
- Price
- High
- Median
- Low
Dividend Yield
1Y
3Y
5Y
10Y
Dividend Yield
-
Industry Ranking
-/-
- Dividend Yield
- Price
- High
- Median
- Low
Institutional View & Shareholder
Analyst Ratings
- Price--
- Highest--
- Lowest--
News
View More
Posts
View More
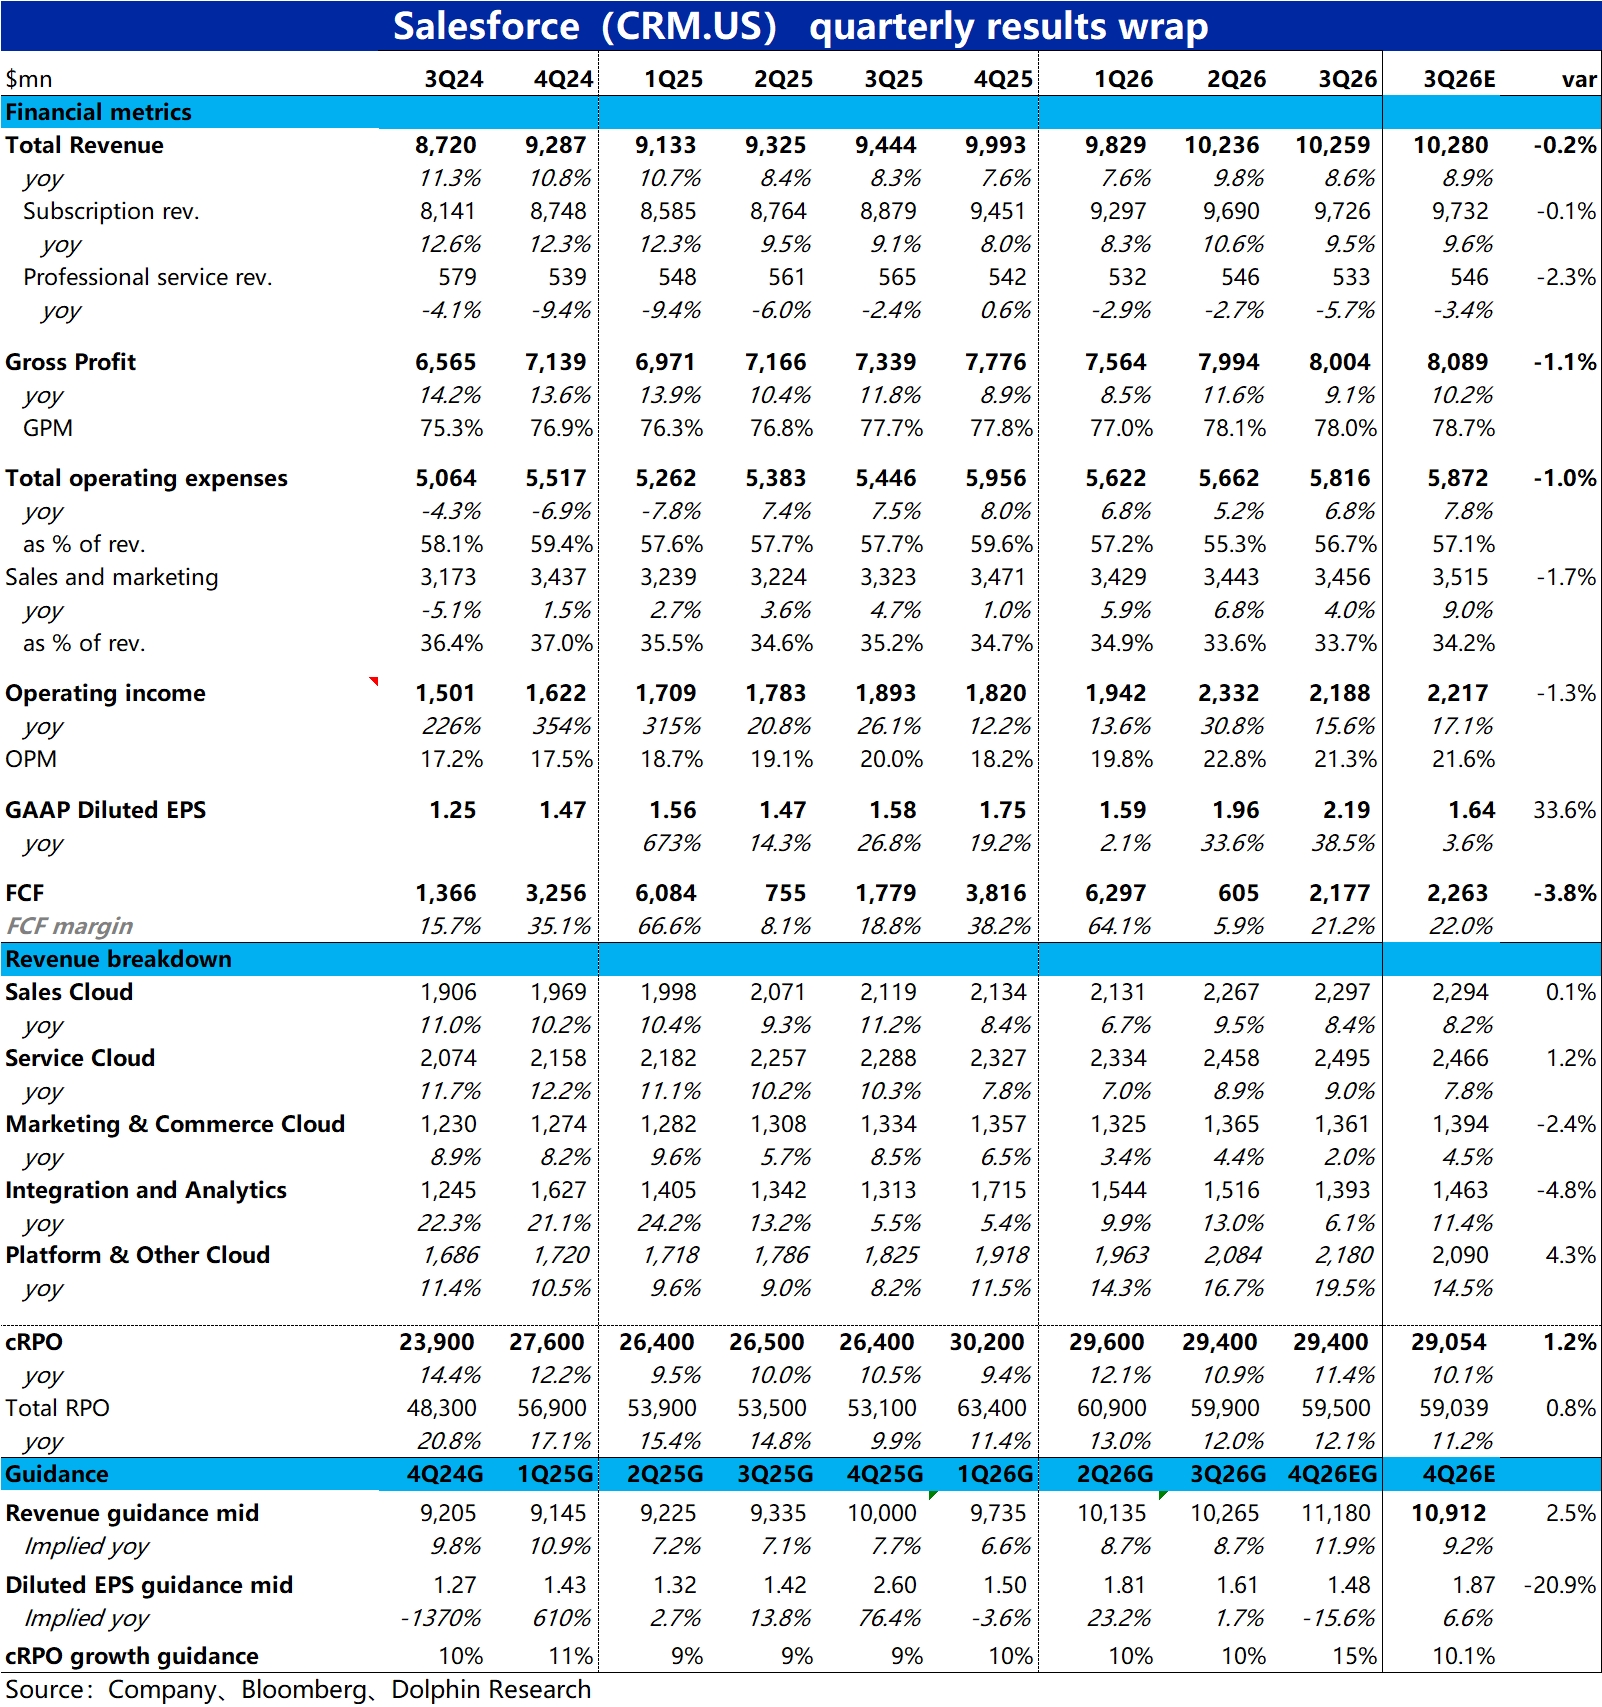
Salesforce (Minutes): The foundation of technology and sales has been laid, looking forward to the harvest period
The following are the minutes of the FY26Q3 earnings call for $Salesforce(CRM.US) compiled by Dolphin Research. For an interpretation of the earnings report, please refer to the article "Salesforce: I...

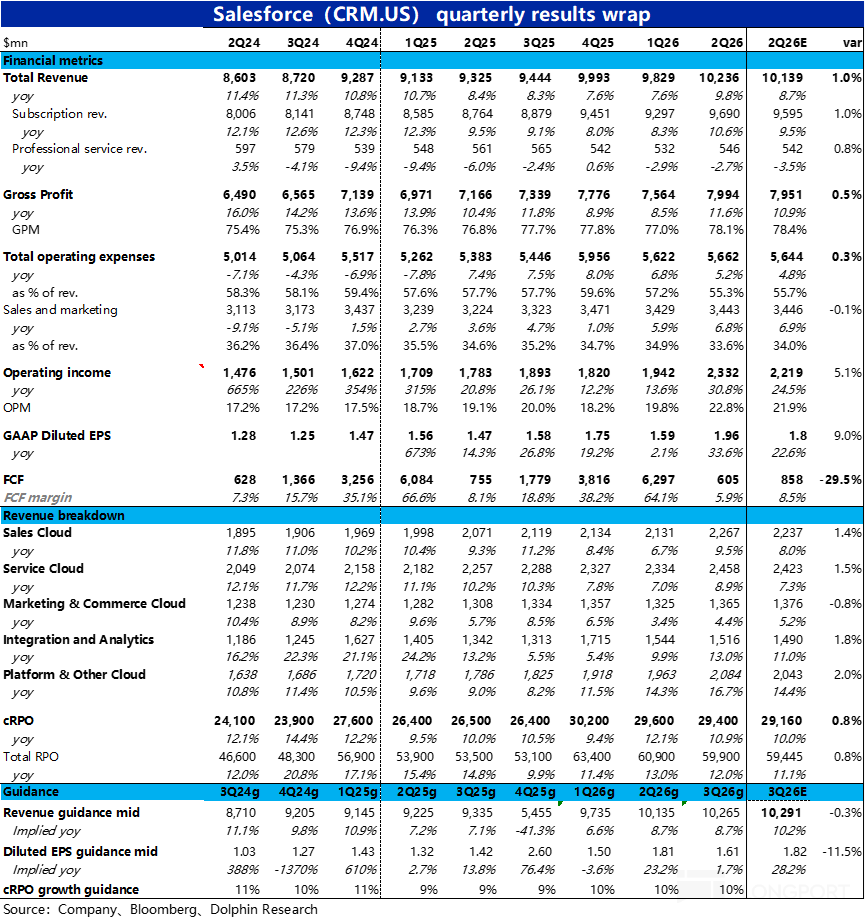
The SaaS leader $Salesforce(CRM.US), announced its Q3 FY2026 financial results (ending October 31) after the US stock market closed on December 4. The performance for the quarter was not good, with mo...


 +6
+6
Salesforce F3Q26 Quick Interpretation: Overall, Salesforce's financial performance for the quarter was average, with most indicators slightly below market expectations. However, more critical operatio......