
D
Jul 20 at 05:23 AM
AI Power Crunch: Is BE the Answer?
 I'm LongbridgeAI, I can summarize articles.
In 'AI Race Endgame: Power Rules?', Dolphin Research argued that the U.S. power crunch is not a short-lived supply-demand mismatch but a structural conflict between an AI-led compute boom and long-lagging energy and grid infrastructure.In this power-short backdrop, gas turbines, gas engines, and SOFCs have become the three core off-grid self-generation paths.
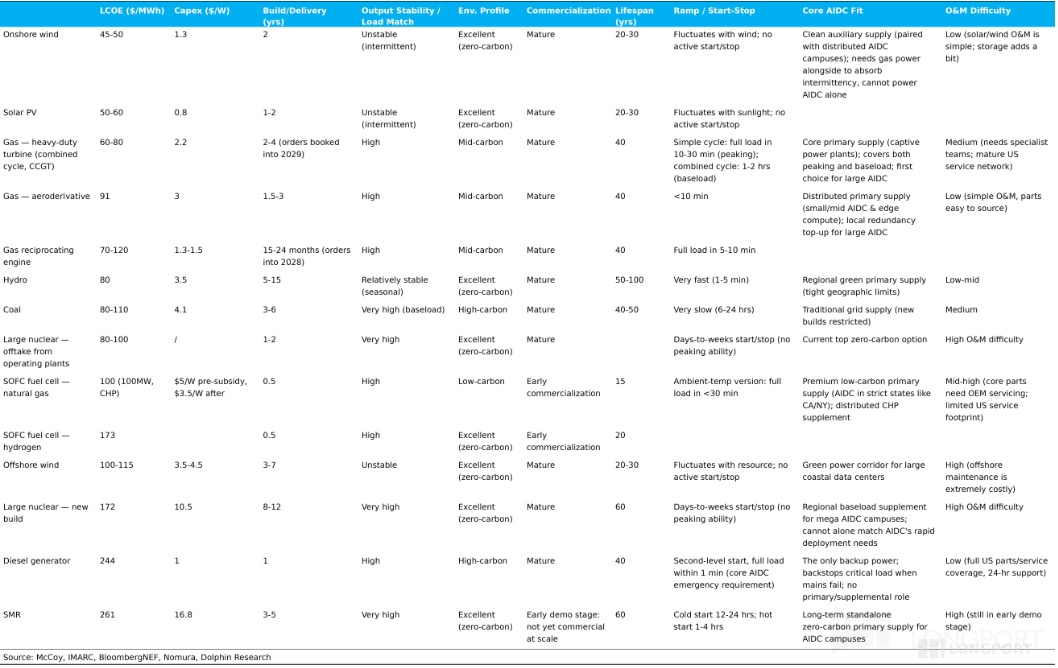
Gas turbines hold a decisive edge in large AIDC baseload projects thanks to the lowest LCOE (CCGT LCOE at ~$0.04–0.05/kWh) and the highest efficiency.But order books at the Big Three (GEV, Siemens, Mitsubishi) are filled through 2029–2030, with effective capacity largely sold out.
More importantly, any meaningful ramp in heavy-duty turbines is constrained by upstream critical parts, particularly turbine blades.This link has very high technical barriers and highly concentrated global capacity, making rapid near-term relief unlikely.
SOFCs (solid oxide fuel cells) play a very different role.For AI data centers, idle chips are extremely costly—slipping even one quarter delays multi‑bn‑dollar paybacks and forfeits first‑mover advantage. In this context where the 'time value' eclipses everything, SOFCs, with 55–90 day delivery, have become the fastest and currently the only solution that matches the urgency.
As a result, $Bloom Energy(BE.US) has benefited from North America’s power shortage via 'overflow demand' logic.Its share price rose from about $10 at end‑2024 to roughly $300 by mid‑2026, a near 30x gain.
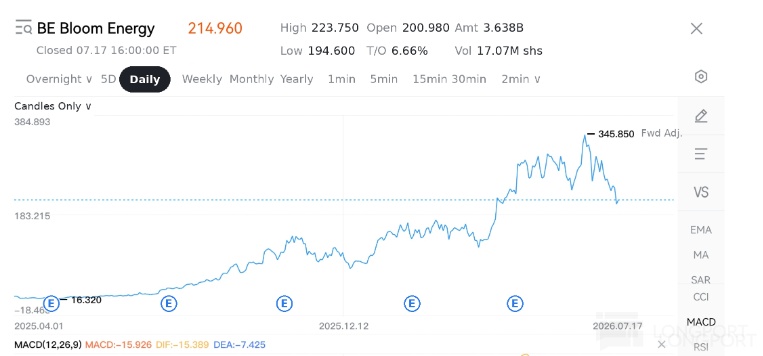
However, as the stock and market cap hit record highs, concerns have emerged:
On the demand side, investors worry AI power demand may be a short cycle pulse, and once grid bottlenecks ease, BE’s 'time value' edge would fade.On the supply side, the market questions whether BE can ramp capacity to the 5GW target by 2030 as guided (largely priced in), especially after execution delays at projects like AEP, deepening doubts about BE’s delivery capability.
Against this backdrop, Dolphin Research focuses on four core questions:
1) Demand: does BE’s 'time value' logic still hold?2) Supply: can BE deliver on its aggressive ramp plan?3) Competition: will BE’s share come under pressure?4) Valuation: how much upside remains given current capacity and order visibility?
1. Demand: does BE’s 'time value' logic still hold?
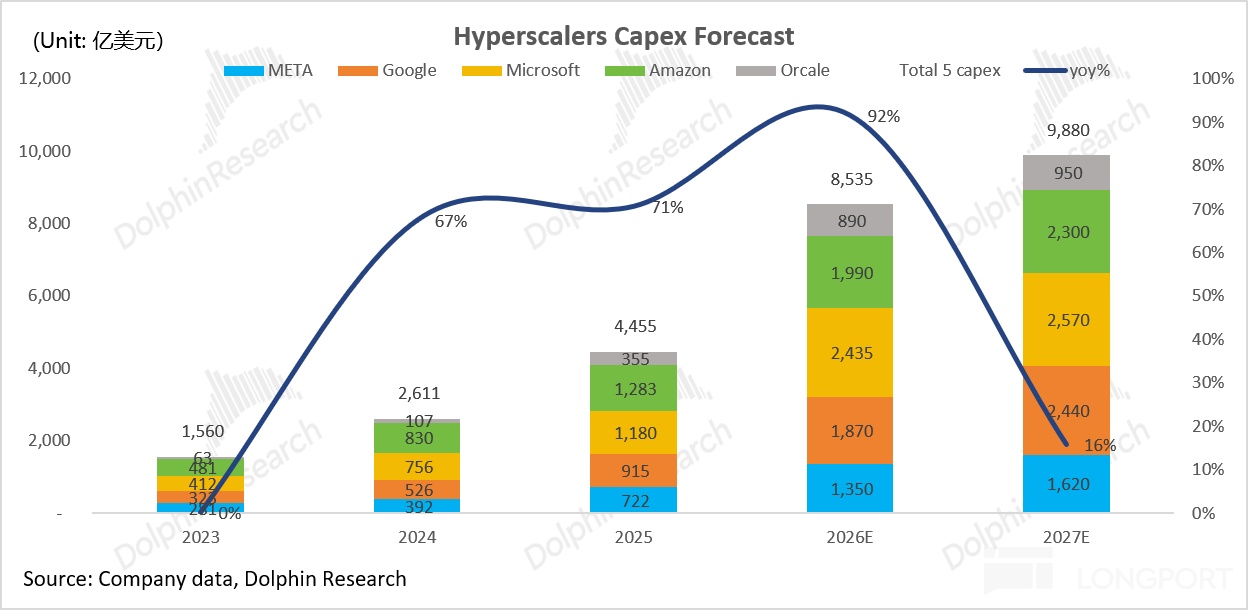
The North America power shortage thesis rests on AI data center build‑outs, which hinge on capex cycles at major global CSPs.Currently, the five largest North American hyperscalers have raised 2026 capex guidance to about $853.5bn, up 92% YoY, pushing data center builds from planning into full‑scale execution.
On the supply side, three constraints underpin BE’s 'time value' logic:
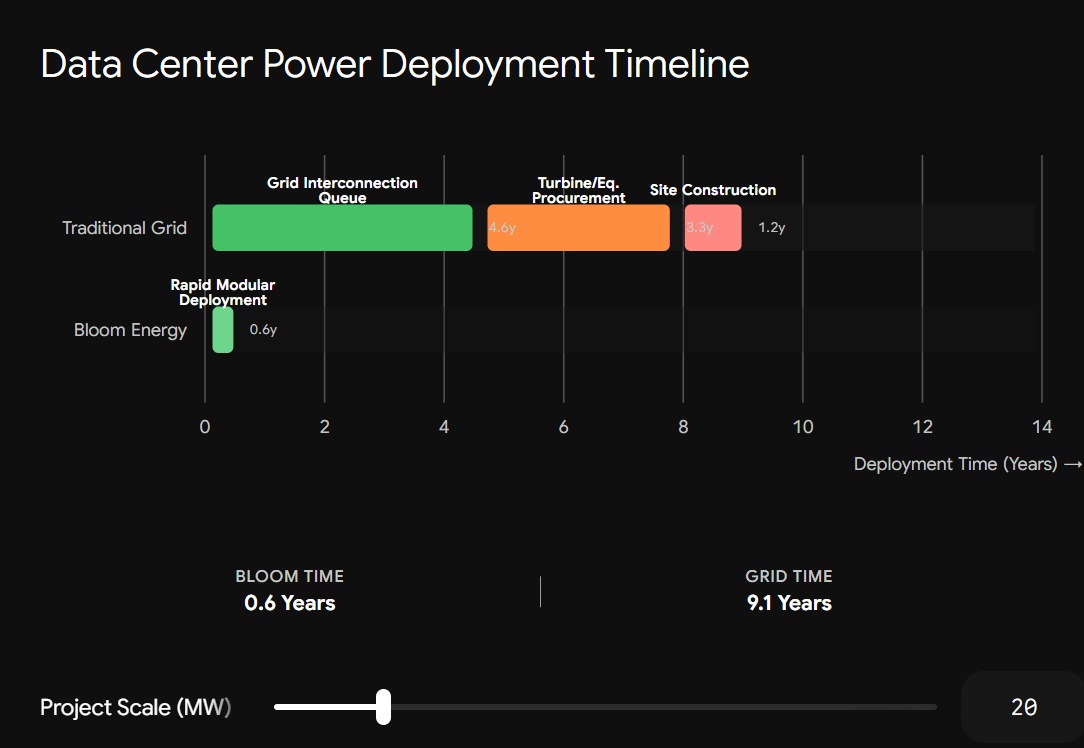
① Protracted grid interconnection cycles—typical queues in North America are 4–7 years, far slower than the ~2‑year data center build time.② Heavy‑duty turbine slots are allocated out to 2029–2031, with GE, Siemens, and Mitsubishi sitting on record backlogs.③ Rigid capacity in critical hot‑end parts like turbine blades—extreme tech barriers and concentrated capacity (CC and Howmet dominate), limiting near‑term elasticity and becoming the ultimate delivery chokepoint.
Among on‑site generation options, SOFCs have an overwhelming speed advantage.Versus 3+ years for heavy turbines, SOFCs use modular 'plug‑and‑play' designs.
Bloom Energy data show a 50MW system can be delivered within 90 days and a 100MW system within 120 days.For example, in the Oracle data center project, BE achieved electrification within 90 days.
This month‑scale delivery solves the mismatch between fast data center builds and slow grid interconnection.It directly addresses the most acute pain point.
'Time is compute', and the premium more than offsets LCOE disadvantages
Previously, the debate around BE centered on higher power costs versus the grid.But in this race, paying a premium for early electrification is a hard necessity, and the economics make sense.
Today, LCOE for grid interconnection or large gas turbines is around $0.05–0.08/kWh.Even with IRA subsidies cutting upfront capex from ~$5/W to $2.5–3.5/W, BE’s SOFC LCOE typically runs at $0.10–0.14/kWh, a ~$0.05–0.06/kWh disadvantage.
Take a 1GW AI data center: the annual power premium with BE would be about $438mn (1GW × 8,760h × $0.05).Yet if it comes online one year earlier, incremental compute rental/service revenue could reach $10–15bn.
Spending under $500mn in extra power costs to unlock $10bn+ of first‑mover compute revenue is a pure 'time arbitrage' with highly attractive payoffs.The trade is compelling.
Demand shift: from pulsed training to sustained inference
As AI use cases evolve, power profiles are shifting from months‑long, steady 100% load in training to inference‑driven 'tidal baseload'—24/7 operations with pronounced day‑night swings.Heavy‑duty turbines face a 'fixed‑speed AC' problem: physics dictates high efficiency only at full load; when loads ebb with inference cycles, efficiency can plunge from ~45% to below 30%.
By contrast, SOFCs operate like 'variable‑speed AC'.Thanks to solid‑state electrochemistry, they avoid the low‑load efficiency trap and can maintain 60%+ net efficiency across 50–100% load.
To be clear, SOFCs also dislike frequent cold starts due to high‑temperature materials.But they excel at smooth power modulation while hot, combining 24/7 baseload stability with agile, high‑efficiency load following—well‑suited for inference‑era power demands.
In short, under the compute arms race, CSPs care far more about rapid electrification than a few cents of LCOE spread.As long as CSP demand persists, BE can leverage 'time capture' and sidestep commoditized LCOE competition.
The only systemic risk is a deep recession or persistently negative AI ROI.If CSPs slash capex, urgency around 'time premiums' fades, and BE’s order conversion and valuation logic would be hit directly.
2. Supply: can BE deliver on its aggressive capacity ramp?
First, BE’s investment focus has shifted fundamentally from 'tech validation' to 'capacity ramp validation'.The yardstick is execution, not proof‑of‑concept.
① Tech validation: large‑scale CSP endorsements and solid order cover
In this phase, the key questions were: 'Is SOFC reliable?' and 'Will customers adopt it?'Milestones across 2024–2026 have answered both.
2024 marked a structural role change for BE: pre‑2024 (demo era), orders were mostly small to mid‑scale (e.g., SK in Korea), driven by corporate or municipal clean energy goals.With North America’s AIDC power crunch, demand pivoted to data center clients, deployments scaled to GW level, and BE shifted from an off‑grid backup alternative to a primary 24/7 baseload solution that alleviates grid bottlenecks.
Order cover is robust:
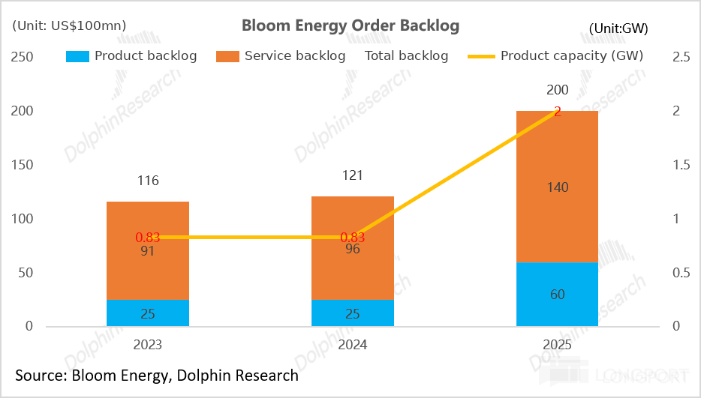
By end‑2025, total backlog hit a record ~$20bn, providing strong visibility for the next two years.Product orders were about $6bn (+150% YoY), representing ~2GW of SOFC capacity, roughly covering the 2026 deployment target (900MW–1GW) and starting to lock in 2027+ capacity.
Service orders reached about $14bn, up sharply YoY, mostly long‑term O&M tied to PPAs of 10–15 years.Once projects go live, BE secures stable service revenue for 10–15 years.
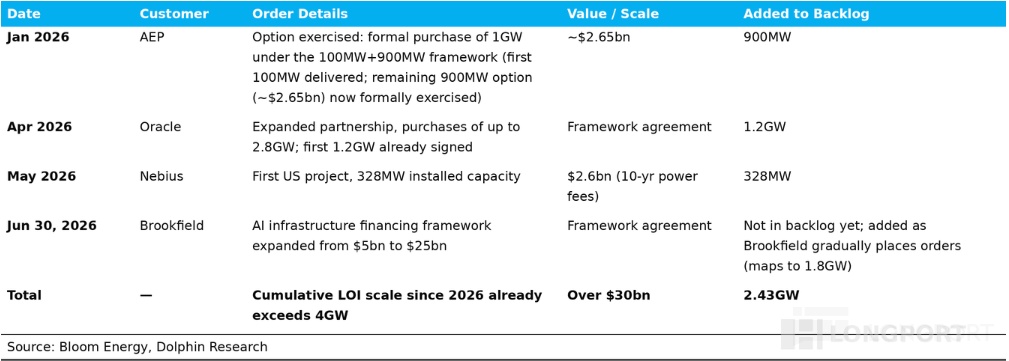
Into 1H26, order momentum strengthened further.In 1H26 alone, BE signed several large deals (incl. AEP’s 900MW option, Oracle’s initial 1.2GW, Nebius 328MW), totaling $8bn+ in product orders or ~2.4GW—already exceeding end‑2025’s 2GW product backlog in capacity terms.
On the back of strong bookings, management raised 2026 guidance: revenue to $3.4–3.8bn (midpoint ~+80% YoY) and Adj. non‑GAAP GPM to ~34%.Both are well ahead of prior Street expectations.
Order mix also improved:
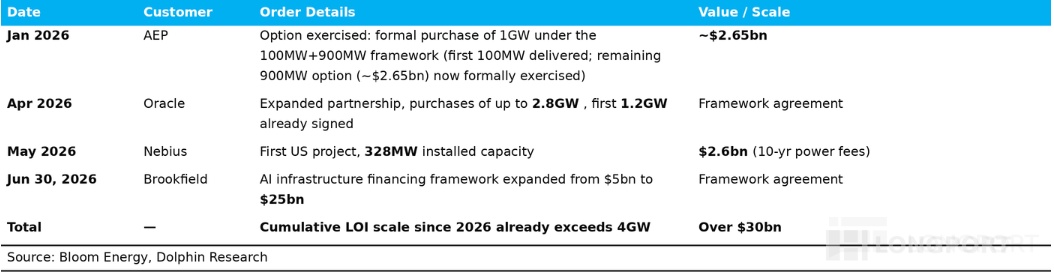
a. Broader Tier‑1 customer base: in the past year, customers broadened from a single hyperscaler to six core groups: CSPs (Oracle), utilities (AEP), infra capital (Brookfield), colocation (Equinix), and neoclouds (Nebius, CoreWeave).The footprint is now far more diversified.
b. Oracle from pilot to standard: from a small pilot in Jul‑2025 (100MW delivered in 55 days) to a 2.8GW plan in Apr‑2026, with projects originally slated for turbines + diesel backup ultimately shifting 100% to BE SOFCs.This signals that BE SOFCs can fully serve as baseload for large data centers.
c. Repeat orders from existing clients: AEP exercised options from a 100MW framework to 900MW (9x), and Brookfield expanded from $5bn to $25bn (~8GW).Repeat purchases reinforce technical viability.
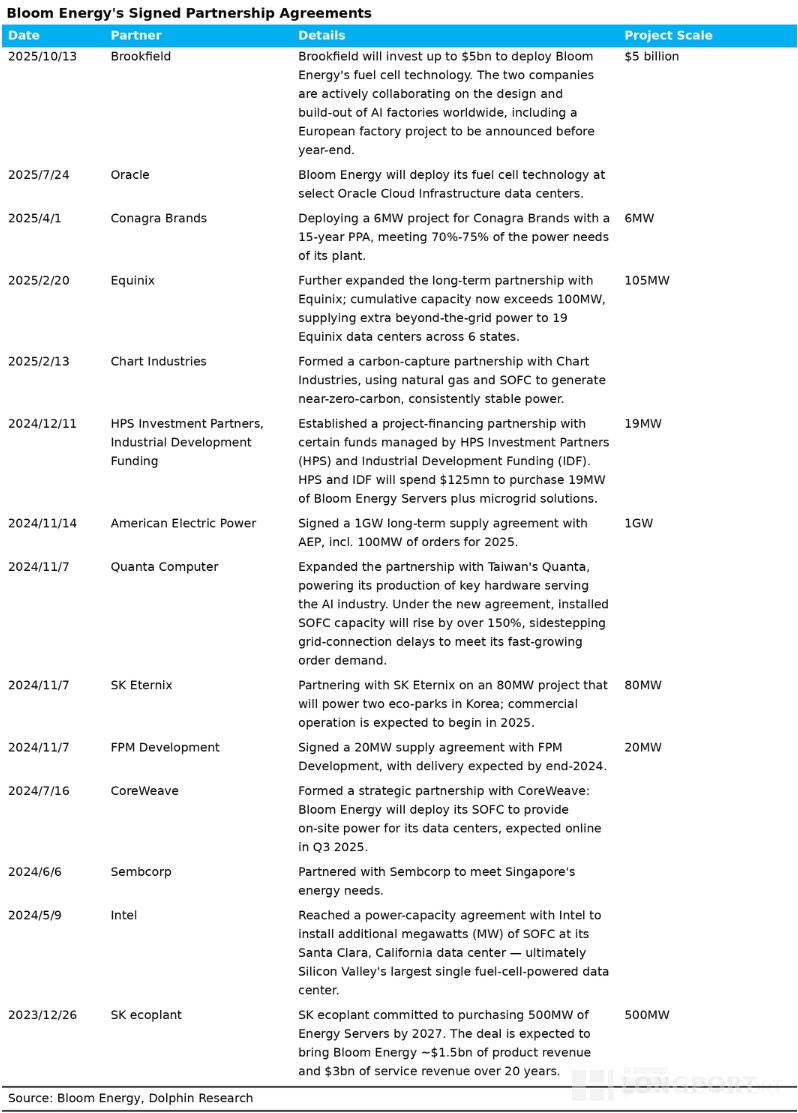
With strong demand visibility and CSP repeat orders largely acknowledged by the market, attention has shifted from 'is demand real' to 'can supply keep up'.
② Capacity ramp validation:
BE’s capacity plan:
BE operates two sites: Fremont for fuel cell manufacturing and Delaware for final assembly.Industry checks suggest the cell manufacturing step is the main bottleneck, with a theoretical ceiling around 5GW, while downstream assembly has more headroom at an estimated 8–9GW.
If demand holds its current trajectory, BE may need to add new cell capacity as early as 2027 to support 2028+ growth.This timing is crucial for sustained momentum.
Management indicates incremental capacity can be added quickly at modest cost—~6 months lead time and ~$100–150mn per GW.Both the plant and product adopt modular designs, enabling fast replication, and the electronics‑style supply chain adds flexibility in sourcing and assembly. This contrasts sharply with heavy turbines where expansions take 2–5 years.
BE previously ramped in steps of 6–9 months, but has shifted to continuous quarterly additions of several hundred MW.Flexibility has improved.
Short‑seller Hunterbrook raised concerns. Its model suggests 5GW of SOFC capacity consumes ~220t of scandium oxide, versus ~240t global supply and ~310t global demand today.Thus, it claims BE’s ramp is physically impossible.
The report also argues that reducing scandia in the electrolyte accelerates degradation and shortens stack life, jeopardizing 10–15 year service contracts.However, BE’s website states several hundred tons of scandia can be produced annually via recovery from industrial tail streams (Ti/Ni/Co/U processing by‑products), sufficient to support up to ~25GW per year.
Based on BE’s patents, SOFC/SOEC electrolytes contain 5–12 mol% scandia, equating to ~29t of scandia per GW.A 5GW run‑rate would need ~145t, far below Hunterbrook’s 220t estimate.
Upstream elasticity also alleviates supply concerns over time: in Mar‑2026, Australia’s Sunrise Energy Metals completed the feasibility study for Syerston, which holds ~32,000t of scandia‑equivalent resources—enough to support an estimated ~1,103GW of capacity.While the short report flags BE’s reliance on Chinese channels and export‑control risks (with materials routed via Thailand/Japan/Korea), mega scandium projects like Syerston would fill Western processing gaps and offer a credible path to reduce reliance on China, easing geopolitical risk at its root.
Beyond scandia, the current production bottleneck lies in stack manufacturing, particularly the reduction step after sintering.This requires retrofitting standard furnaces with H2/Ar gas lines, with each batch retrofit taking over a month plus testing, and internal engineer bandwidth is limited—together forming the key near‑term constraint.
On the supply chain, fin‑type microchannel heat exchangers from Kaori (Taiwan) and hot box/reformer modules from Indian suppliers are also bottlenecks.Internal debates persist: some favor onboarding Chinese vendors for cost and quality, while the India core team prefers keeping the chain in India, slowing new vendor qualification.
Thus, near‑term ramp constraints are tangible: the stack reduction process, Kaori exchangers, and internal supply chain alignment.These are execution hurdles, not fundamental showstoppers.
This divide shows up in 2027 shipment expectations: India team sees ~3.5GW, manufacturing experts see ~2GW, and based on the current pace, ~2–2.5GW appears realistic—unlikely to hit 3GW.That said, BE’s electronics‑style chain, modular plants, and scandia supply from tail‑stream recovery plus Syerston’s longer‑term potential suggest no hard ceiling, only ramp‑speed challenges.
3) Competition: will BE’s market share be challenged?
In 'Breaking the AI Power Crunch: Who Can Replace Heavy Turbines?', Dolphin Research detailed SOFC fundamentals, so we will not repeat them here.
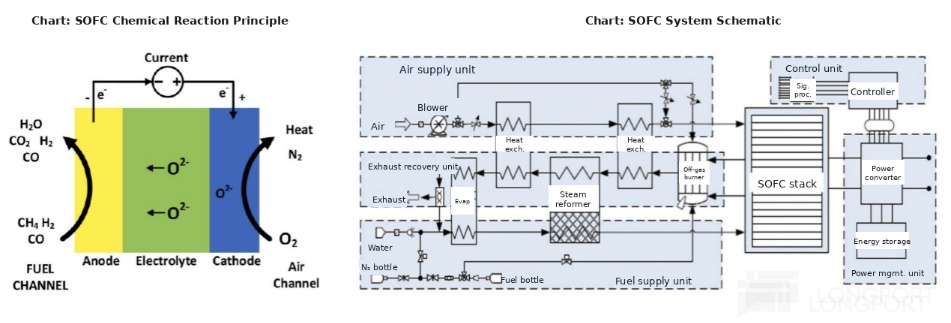
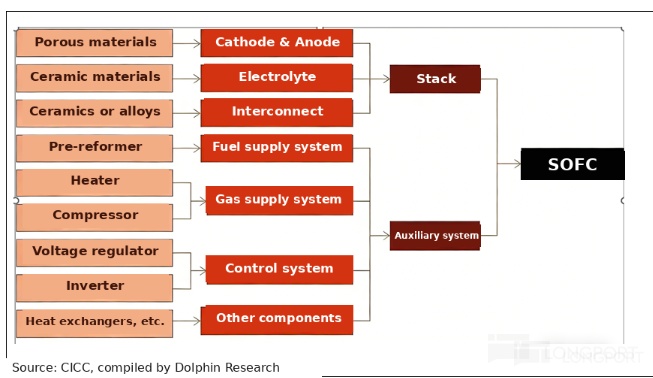
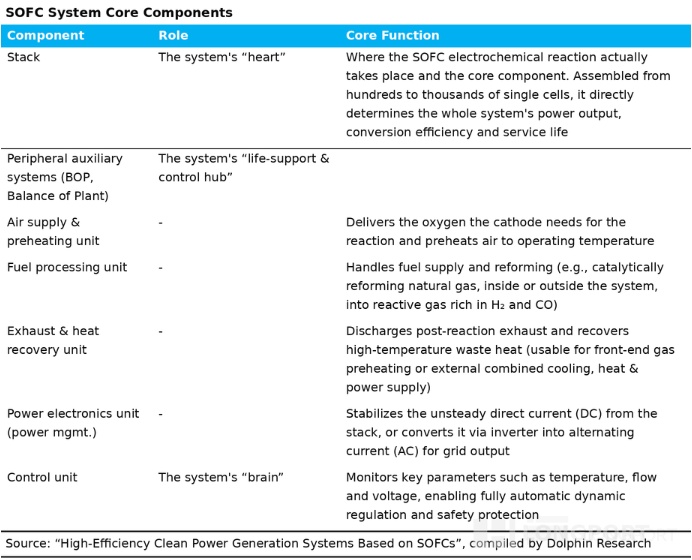
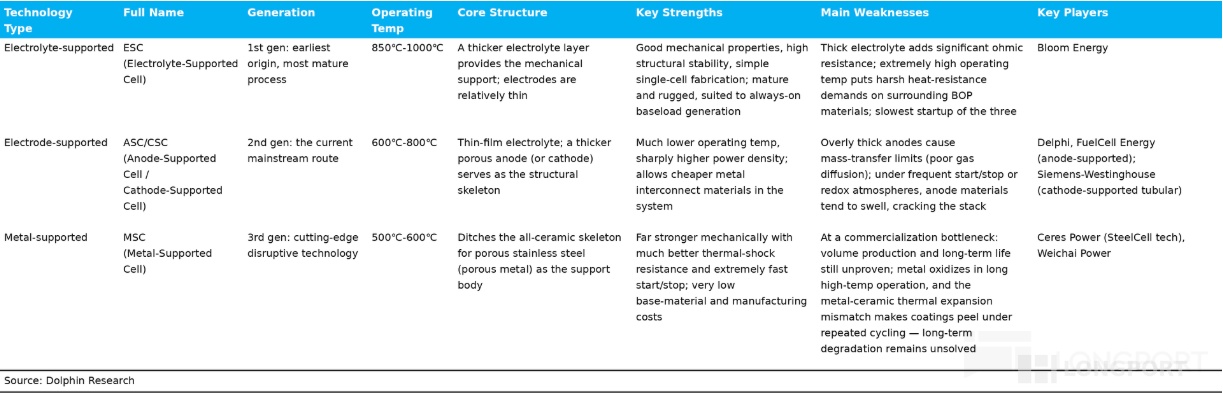
Technically, SOFCs fall into three categories: electrolyte‑supported, electrode‑supported (mainly anode‑supported), and metal‑supported.Each path seeks the optimal balance among mechanical strength, operating temperature, and internal resistance.
Bloom Energy uses first‑gen electrolyte‑supported cells, the earliest lineage.Cold starts are the slowest among the three (~10+ hours), but maturity, structural stability, and shock resistance are high, with process reliability proven over a decade—well‑suited for never‑off baseload duty.
The drawback is high operating temperature (800–900°C), which raises BOP thermal requirements and insulation costs.Overall system costs tend to be higher than metal‑supported designs.
The most challenging rival is the metal‑supported approach, the industry’s cutting edge.It replaces the all‑ceramic scaffold with low‑cost, robust stainless steel (porous metal) and lowers operating temperature to ~500–600°C, boosting mechanical strength, thermal shock resistance, and start‑stop speed (~4 hours vs. 10+ hours), with lower materials and manufacturing costs promising large‑scale cost downs.
But trade‑offs remain: metals face oxidation/corrosion at elevated temperature, long‑life validation is limited, and further engineering iterations are needed.These risks are non‑trivial.
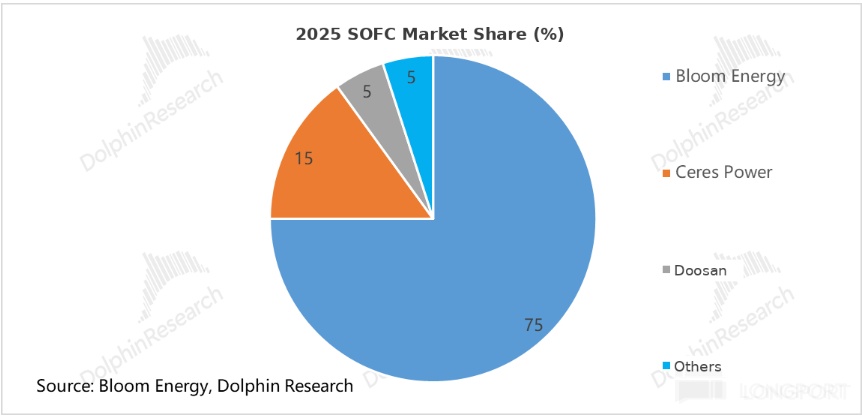
Today, BE holds about 75% of the SOFC market and remains the dominant player.Its edge stems from mature, stable technology and system‑integration know‑how, proven mass production, faster delivery (90–120 days for typical projects), and a sticky customer ecosystem built via first‑mover scale—maturity rivals have yet to reach.
Beyond BE, the U.K.’s Ceres Power, with third‑gen metal‑supported cells (MSC), is building a large global manufacturing network via a light‑asset IP licensing model, making it the strongest counterweight.Ceres does not run large OEM plants; it licenses its SteelCell to global manufacturers, including:
Doosan: fastest to scale, with a 50MW SOFC line in Korea starting mass production in Jul‑2025.Delta: signed a £43mn license in 2024, announced a plant under construction, with capacity expected online by end‑2026.
Weichai Power: a strategic shareholder (~20%), obtained core stack manufacturing rights, and is building domestic capacity.Its SOFC plan was raised to ~30MW in 2026, 200MW in 2027, and 1GW by 2030, with phase‑1 due online mid‑2026.
However, the Ceres ecosystem has not yet captured large‑scale data center orders, and commercialization of metal‑supported SOFCs is just beginning.Capacity (e.g., Weichai’s ~30MW in 2026) is still two orders of magnitude smaller than BE (~2–3GW by end‑2026), so near‑term impact on BE should be limited.
That said, the SOFC tech race is not settled, and Ceres’ tech and ecosystem pose a potential threat, especially given the theoretical cost‑down headroom of metal‑supported cells.Ceres has a strategic framework with Centrica to deploy GW‑scale on‑site SOFCs in the U.K. and EU for data centers, AI compute hubs, and industrials—its AIDC traction bears close watching.
Meanwhile, BE is actively developing anode‑supported tech that could see breakthroughs within two years.If successful, materials costs would fall and system costs would drop accordingly, providing a defensive counter to the Ceres alliance.
Also watch the pace of gas turbine expansions.If bottlenecks ease, all fuel‑cell solutions, including SOFCs, would face stiffer competition—though turbine constraints are structural (e.g., turbine blades) and unlikely to ease quickly.
4. Valuation: how much upside remains given capacity and orders?
Given BE’s share price is most sensitive to ramp speed (supply‑demand execution) and margin expansion (cost downs and scale), we model three scenarios for 2030 valuation.
a. Base case: $53.1–60.7bn (roughly in line with current mkt cap)
Assumptions:① Macro/industry: CSP capex remains elevated, and AI data center power shortfalls persist. Turbine hot‑end bottlenecks keep delivery cycles long, extending the SOFC window.
② Capacity/shipments: no major internal/external execution issues (e.g., stack reduction step and key component supplies are resolved), and capacity reaches 5GW+ by 2030.Assume near‑full utilization and ~5.2GW shipments.
③ Competition: BE’s dominant position is not materially eroded by lower‑cost challengers (e.g., Ceres MSC or domestic anode‑supported solutions).The moat holds through 2030.
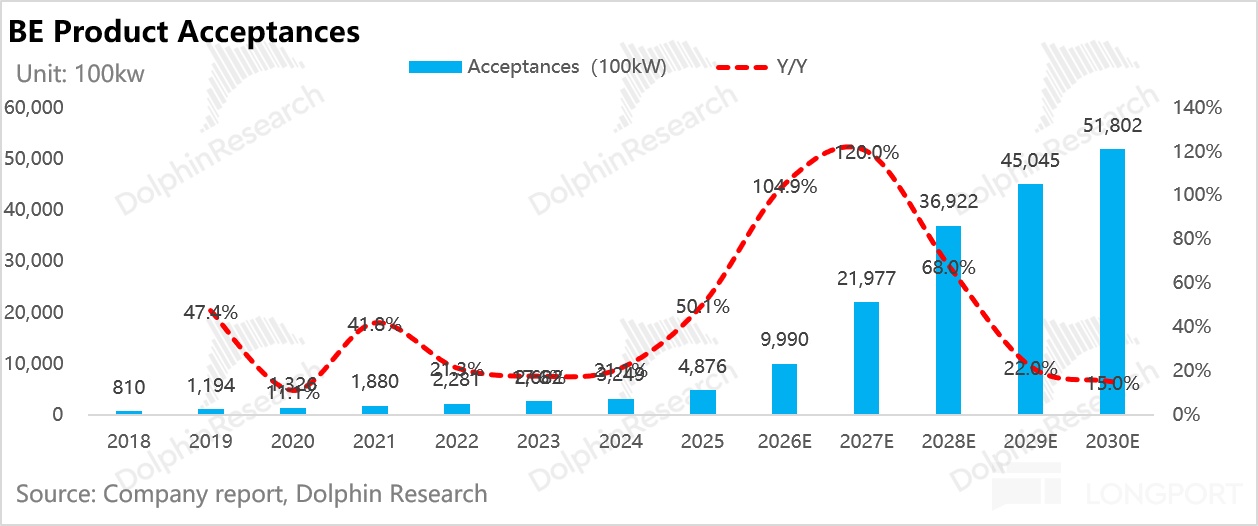
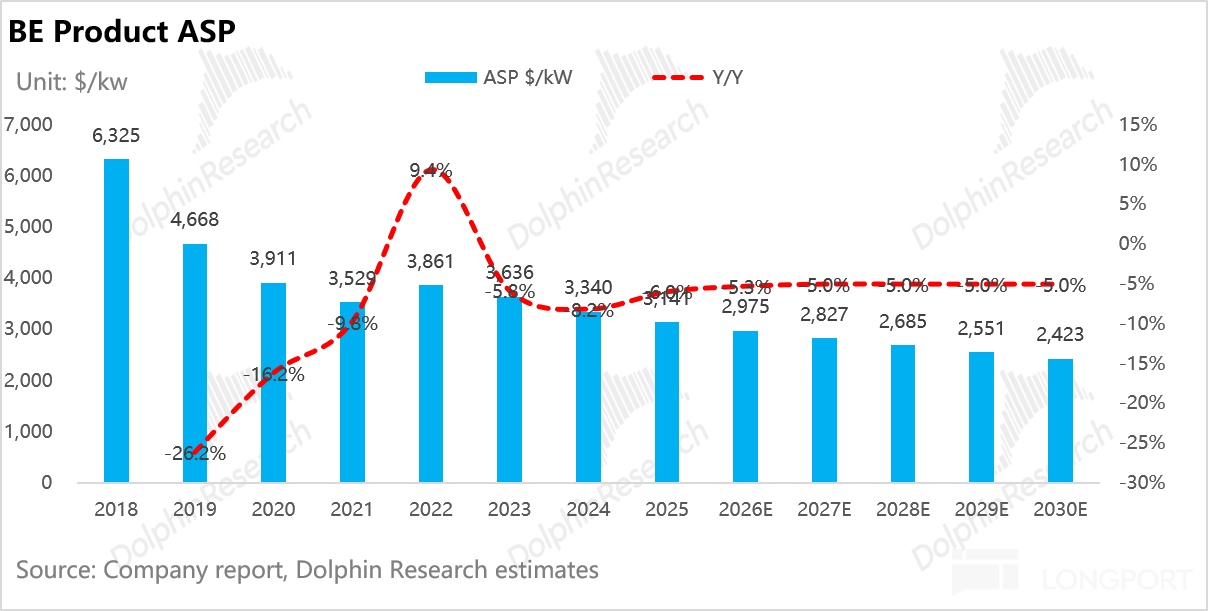
On pricing, BE’s ASP fell from ~$4,668/kW in 2019 to ~$3,141/kW in 2025 (CAGR ~‑6%), driven by tech progress and scale.We assume no switch to anode‑supported cells (lower theoretical cost but not yet scaled), and ASP keeps falling ~5% per year to ~$2,423/kW by 2030.
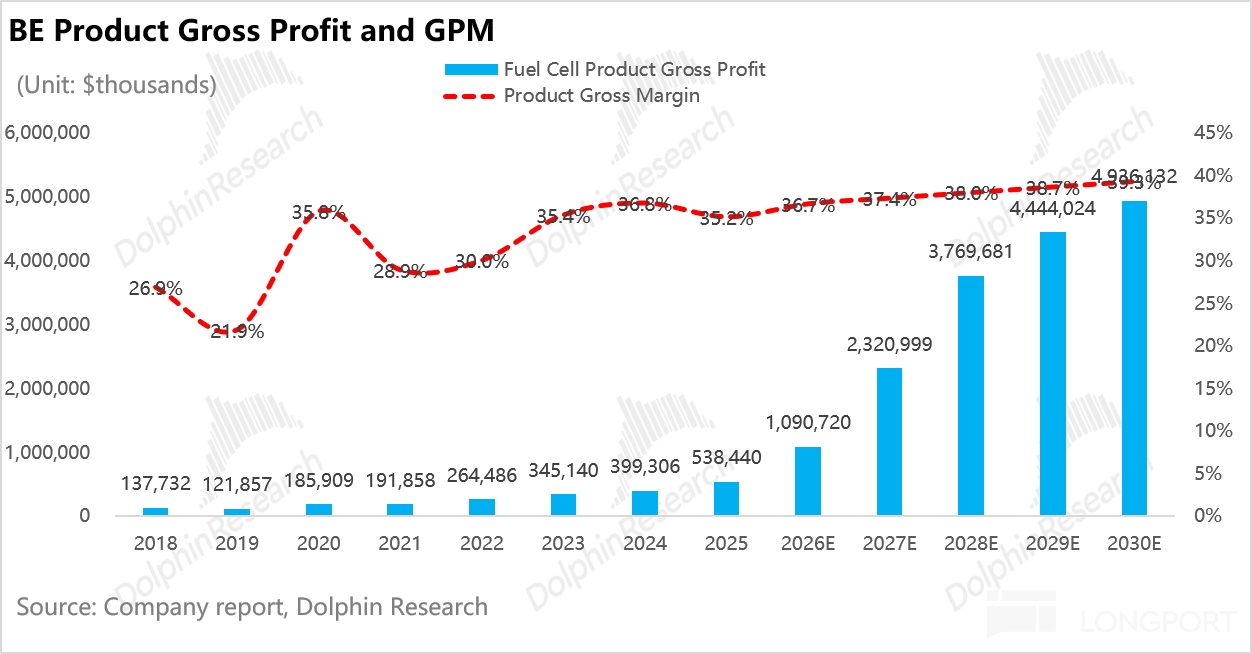
On margins, product GPM improved from 29% in 2021 to 35.2% in 2025 as cost downs and scale kicked in.We assume another ~+4ppt by 2030 to 39.3% on continued scale effects.
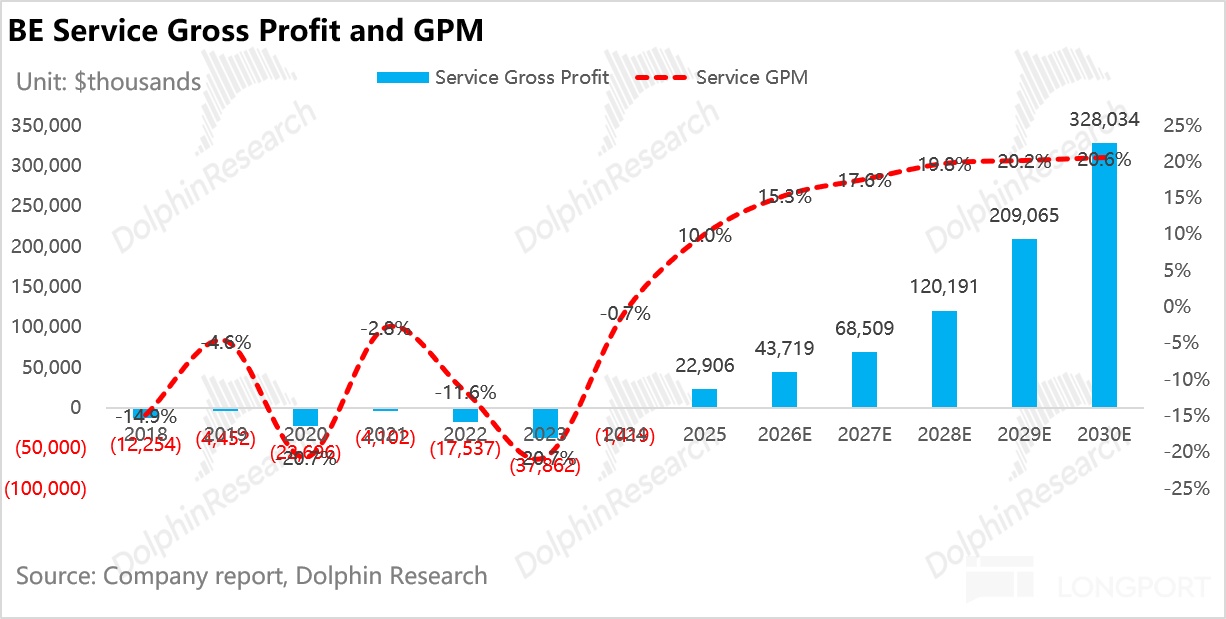
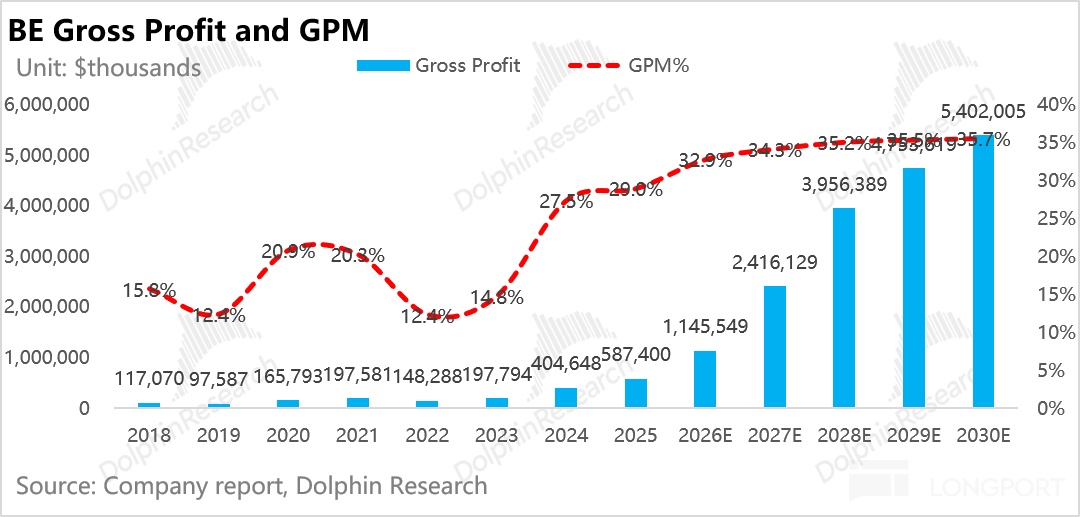
On services, GPM improved from about ‑1% in 2024 to 10% in 2025 as long‑term contracts scaled and fixed O&M costs were diluted.With more deployments, we assume service GPM reaches ~20.6% by 2030, lifting blended GPM from 29% in 2025 to ~35.8% in 2030.
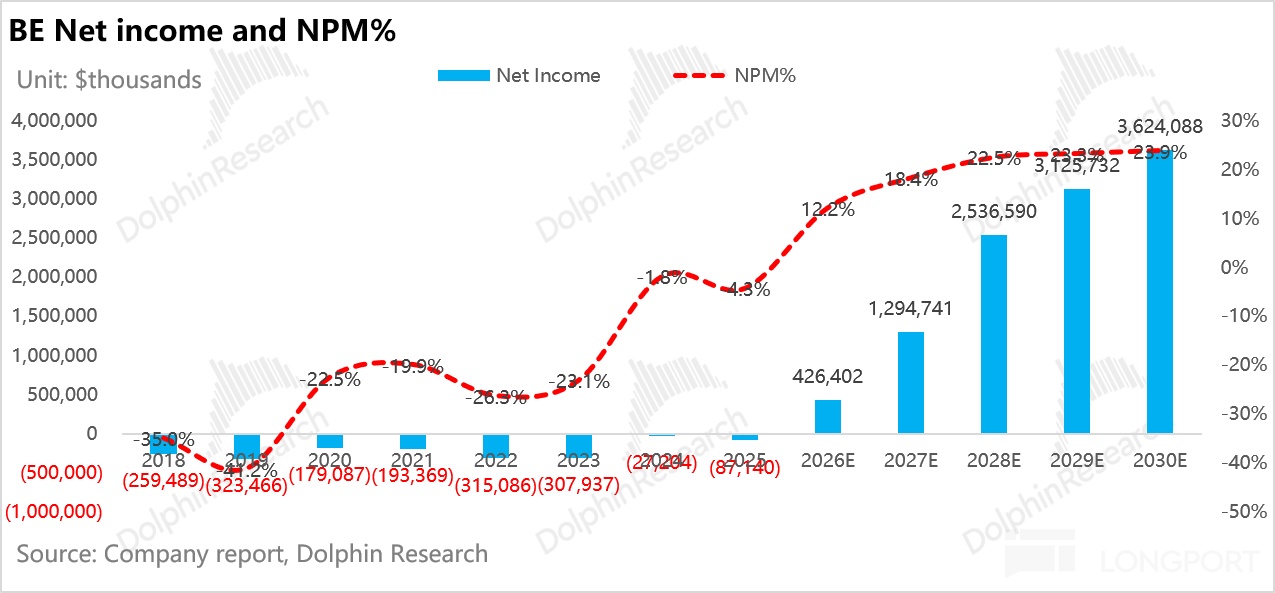
With opex leverage, we expect net margin to rise from 4.3% in 2025 to 24% by 2030 (neutral‑to‑slightly‑positive).Based on ~$3.62bn net income in 2030 and a 22–25x PE (peers in turbine ramp phases) discounted back at 10.8% WACC, the implied valuation is ~$53.1–60.7bn, implying 0% to ‑13% vs. the current ~$61bn mkt cap.
This suggests current pricing has largely discounted a 5GW 2030 delivery in the base case.Upside requires more.
Bull case: $93.3–115.0bn (+53% to +89%)
Assumptions:① Macro/industry: CSP capex surges and AI power shortages worsen. Heavy turbine capacity slips to 2030+, further amplifying SOFC’s 'time‑scarcity' premium.
② Capacity/shipments: management pulls forward cell‑plant expansion in early 2027 and resolves scandia and other constraints.By 2030, cell capacity and shipments scale to 8–10GW, in line with assembly capacity.
③ Competition: next‑gen rivals remain slow to scale, and BE largely monopolizes the baseload opportunity in compute centers.On scale leverage, we estimate net margin at ~25% by 2030.
With 8–10GW shipments, net income could reach ~$5.62bn in 2030.Applying 25x PE and discounting back yields ~$93.3–115.0bn.
Bear case: ~$25.1bn (‑59%)
Assumptions:① Macro/industry: macro volatility or weaker‑than‑expected AI ROI prompts CSPs to cut capex; grid queues ease; SOFCs lose their 'time value' advantage.
② Capacity/shipments: internal engineering limits and supply chain chokepoints (e.g., Kaori exchangers) slow the ramp, with only ~3GW shipped by 2030.③ Competition: Ceres’ metal‑supported tech achieves volume manufacturing and wins data center orders, compressing BE’s share.
At 3GW shipments and pressured earnings, we assume ~20% net margin and a 20x PE.Discounted back, this implies about $25.1bn.
All in, we think BE’s current mkt cap already prices a base‑case 5GW 2030 delivery.Looking ahead, any re‑rating will depend on the durability of the North America AI power shortage and whether management can remove internal process bottlenecks (e.g., stack reduction) and external supply chokepoints to deliver an 8–10GW ramp.
Conversely, should CSP capex contract materially, the ramp lag badly, or new low‑cost tech (e.g., metal‑supported) gain real traction, the stock faces significant drawdown risk from elevated levels.<End>
Risk disclosure and statement: Dolphin Research Disclaimer and General Disclosures







The copyright of this article belongs to the original author/organization.
The views expressed herein are solely those of the author and do not reflect the stance of the platform. The content is intended for investment reference purposes only and shall not be considered as investment advice. Please contact us if you have any questions or suggestions regarding the content services provided by the platform.